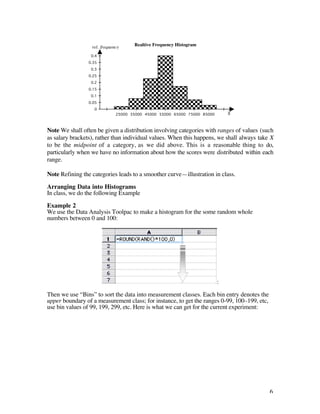
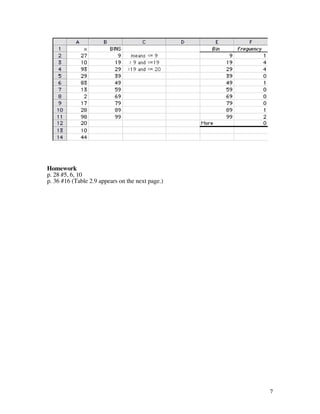
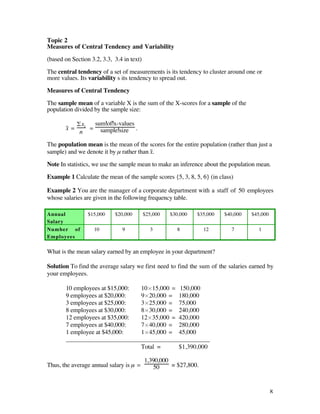
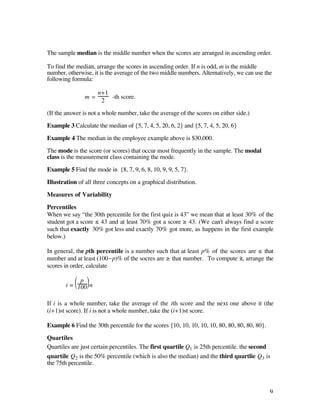
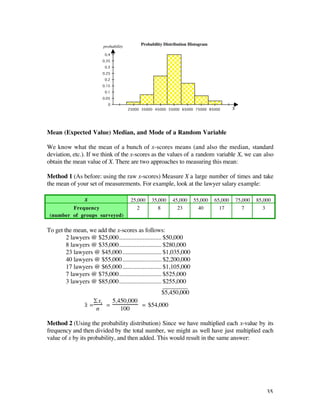
The document discusses various statistical measures used to describe data, including measures of central tendency (mean, median, mode) and measures of variability (range, variance, standard deviation, percentiles, quartiles). It provides examples of calculating each measure for sample data sets. It also discusses how data can be organized and displayed graphically using histograms, bar graphs, and other visualizations. The goal of descriptive statistics is to summarize key aspects of a data set, such as its central tendency and variability, which provides critical information for understanding the data.

![1. That an author is established, given that she is successful
2. That an author is successful, given that he is established
3. That an author is unsuccessful, given that she is established
4. That an author is established, given that he is unsuccessful
5. That an unsuccessful author is established
6. That an established author is successful
[Answers: 1. 5/6 2. 5/16 3. 11/16 4. 11/14 5. 11/14 6. 5/16 ]
32](https://image.slidesharecdn.com/qm1notes-110920043524-phpapp01/85/Qm1-notes-33-320.jpg)
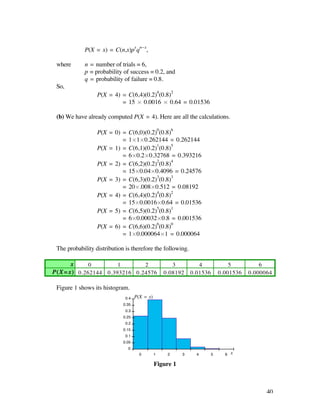
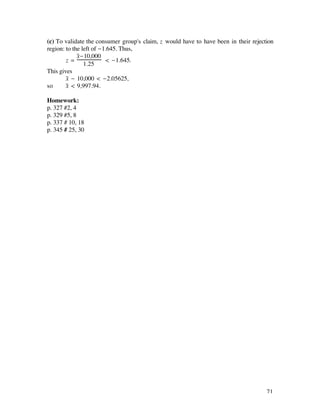
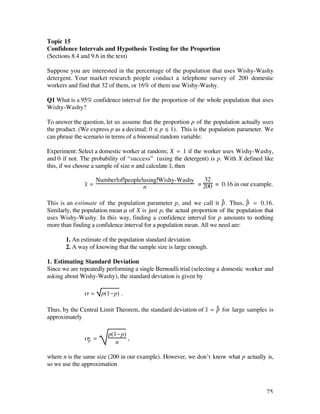
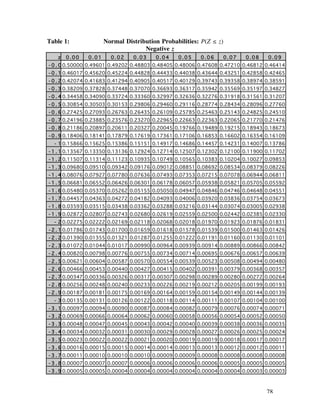
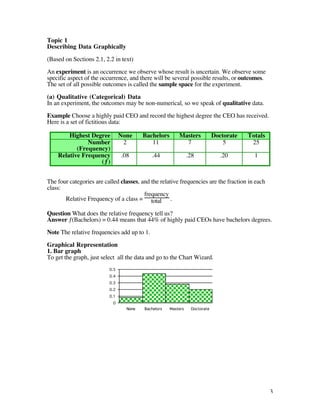
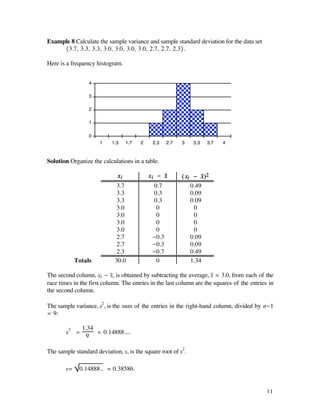
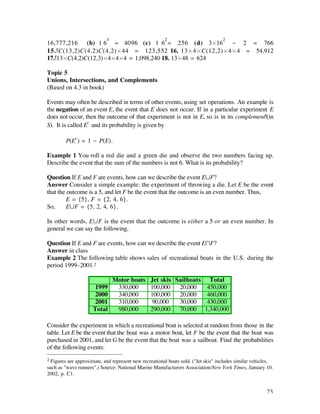
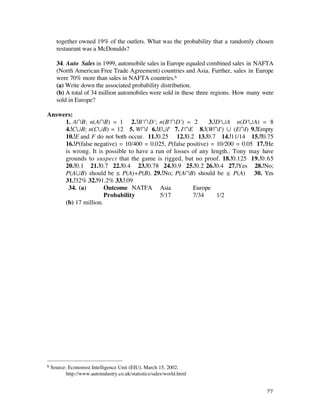
![Answer in the box
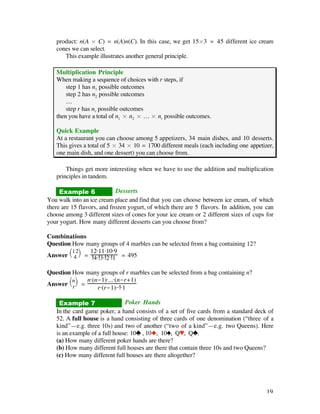
Mean, Variance, and Standard Deviation of Binomial Random Variable
Mean = µ = np
Variance = ß2 = npq
St. Deviation = ß = npq
Example 4 (Similar to Example 4.9 and 4.10 in book)
(a) Your manufacturing plant produces 10% defective airbags. If the next 5 airbags are
tested, find the probability that three of them are defective.
(b) Compute the probability distribution (that is, find p(0), p(1), ..., p(5)), graph them, and
locate µ and ß on the graph.
(c) What fraction of the outcomes will fall within 2 standard deviations of the mean?
Answer to part (b)
Ê 5ˆ
P(X=x) = Á x ˜ (0.1)x (0.9)5-x.
Ë ¯
Ê 5ˆ
Thus: P(X=0) = Á 0 ˜ (0.1)0(0.9)5-0 =
Ë ¯ 0.59049
Ê 5ˆ
P(X=1) = Á 1 ˜ (0.1)1(0.9)5-1 =
Ë ¯ 0.32805
Ê 5ˆ
P(X=2) = Á 2 ˜ (0.1)2(0.9)5-2 =
Ë ¯ 0.07290
Ê 5ˆ
P(X=3) = Á 3 ˜ (0.1)3(0.9)5-3 =
Ë ¯ 0.0081
Ê 5ˆ
P(X=4) = Á 4 ˜ (0.1)4(0.9)5-4 =
Ë ¯ 0.00045
Ê 5ˆ
P(X=5) = Á 5 ˜ (0.1)5(0.9)5-5 =
Ë ¯ 0.00001
Answer to (c) We calculate µ = 0.5, and ß = 0.67. Thus, the interval is
[µ - 2ß, µ + 2ß] = [-0.84, 1.84]
These are values of x, and the interval includes x = 0 and 1. Since
P(X=0 or X=1) = 0.59049 + 0.32805 = 0.9185, we conclude that at least 91.85%
of the outcomes will be within 2 standard deviations of the mean.
Example 5 Use Excel (cumulative probabilities if necessary)
60% of a company's employees favor unionization, and a poll of 20 employees is taken.
Use the tables for each of the following.
(a) Find P(X < 10)
(b) Find P(X > 12)
(c) Find P(X = 11)
42](https://image.slidesharecdn.com/qm1notes-110920043524-phpapp01/85/Qm1-notes-43-320.jpg)

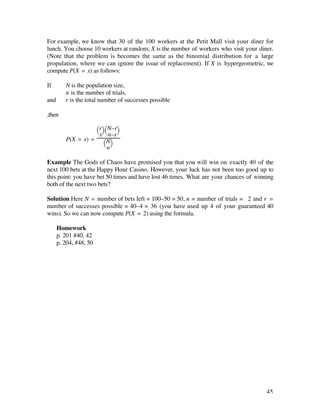
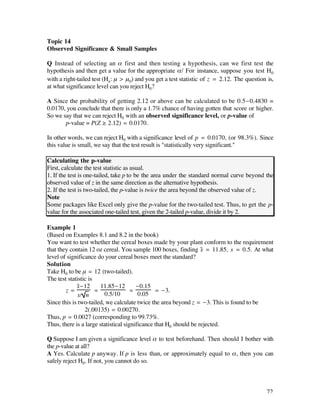
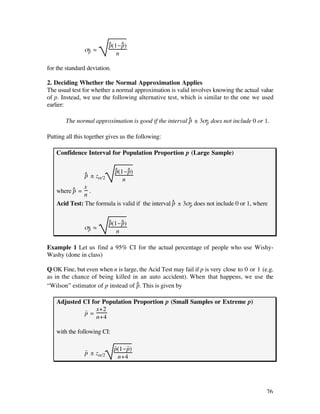
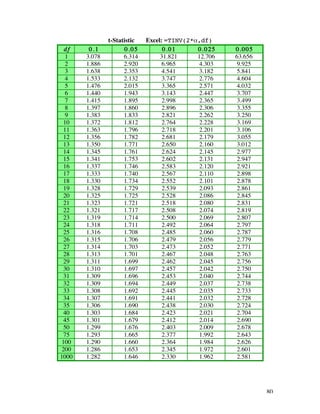
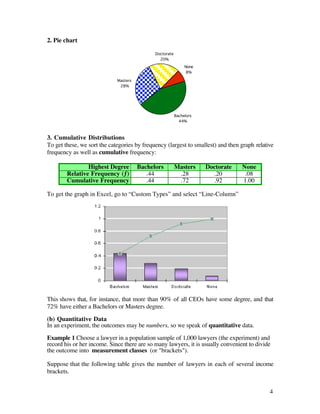
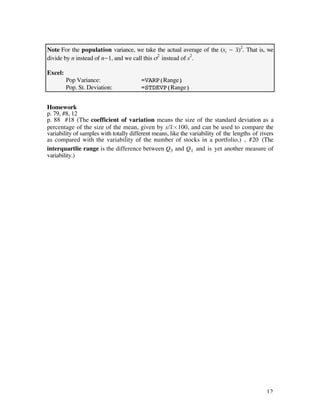
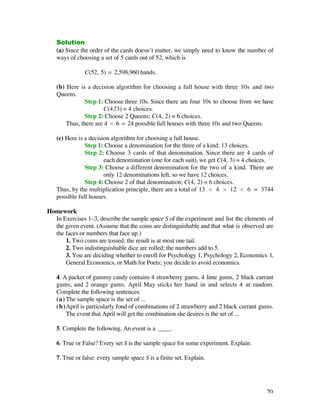
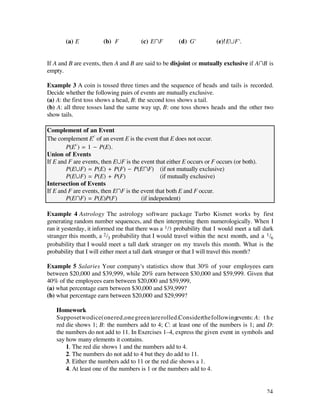
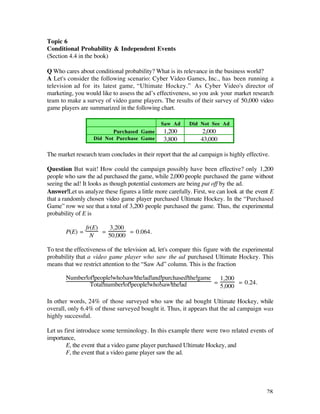
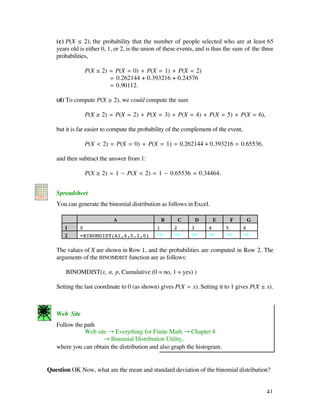
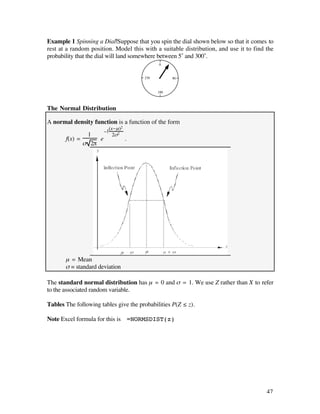
![Topic 10
Continuous Random Variables: Uniform and Normal
(Based on Sections 6.1-6.2 in the book)
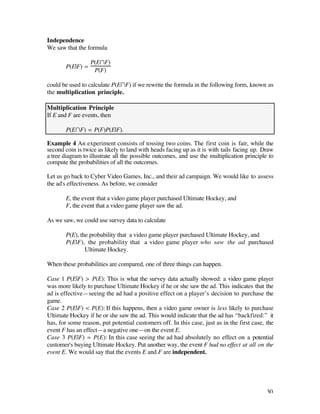
When a random variable is continuous, we use the following to describe the associated
probabilities. Note that, in this case, P(X = x) = 0. So instead, we will look at probabilities
in a range: P(a < X < b).
A probability density function (or probability distribution) for a continuous random
variable X is a function f(x) so that P(a < X < b) is the area under the curve between a and
b. Further, we require:
• f(x) ≥ 0 for every x
• The area under the entire curve = 1 (why?)
An Example:
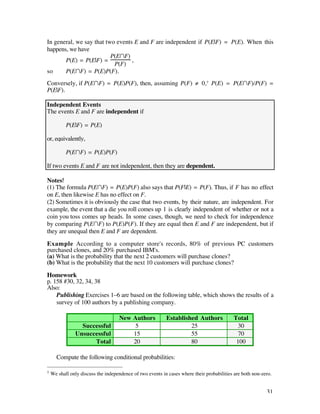
The Uniform Distribution The uniform density function on the interval [c,d] is
given by
1
f(x) = .
d-c
Its graph is a horizontal line (see the figure)
Probabilities are calculated by
b-a
P(a < X < b) = .
d-c
The mean and standard deviation of a uniformly distributed random variable is given by
c+d d-c
µ= ß= .
2 12
46](https://image.slidesharecdn.com/qm1notes-110920043524-phpapp01/85/Qm1-notes-47-320.jpg)
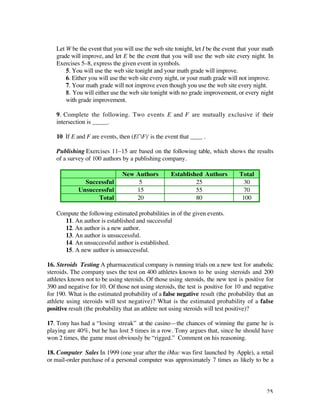
![(a) The claim is correct, and you were in the unlucky 1% group that gets the duds
(b) The claim is wrong—perhaps the standard deviation should be bigger...
Using the Table Backwards: Finding Z
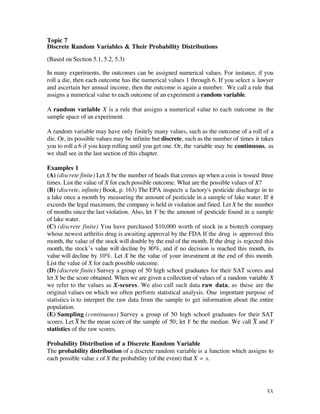
Example 5 (based on Example 5.10 in the book) Daily paint production at a manufacturing
plant has a mean of 100,000 gals. with a standard deviation of 10,000 gals. Management
wants to reward production crews that exceed the 90th percentile. How many gallons of
paint does this represent?
Solution We want a value of x0 such that 90% of production is below that level; that is,
P(X ≤ x0) = 0.90.
First obtain the appropriate z-score:
P(Z ≤ z0) = 0.90
From the table, we find z0 ‡ 1.28.
Excel Formula for this: =NORMSINV(0.9) = 1.28155
Next, convert this to an x-score:
x -µ
z0 = 0
ß
x -100,000
1.285 = 0
10,000
so that x0 = 12,800 + 100,000 = 112,800 gallons.
Technology Notes
Graphing Calculator
Many calculators permit you to calculate the area under the standard normal curve
without using a table. On the TI-83, press [2nd] VARS to obtain the selection of
distribution functions. The first function, normalpdf, gives the values of the normal
density function (whose graph is the normal curve). The second, normalcdf, gives
P(a ≤ Z ≤ b). For example, to compute P(0 ≤ Z ≤ 2.43), enter
normalcdf(0, 2.43).
To compute P(-1.37 ≤ Z ≤ 2.43), enter
normalcdf(-1.37, 2.43).
51](https://image.slidesharecdn.com/qm1notes-110920043524-phpapp01/85/Qm1-notes-52-320.jpg)
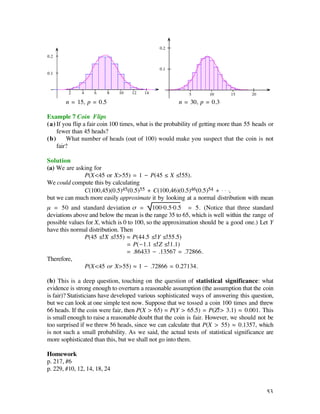
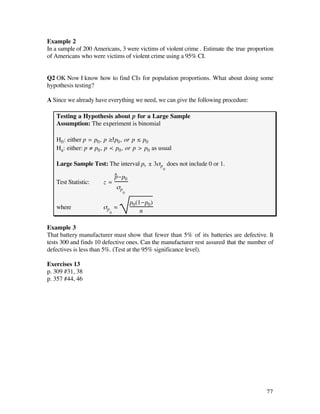
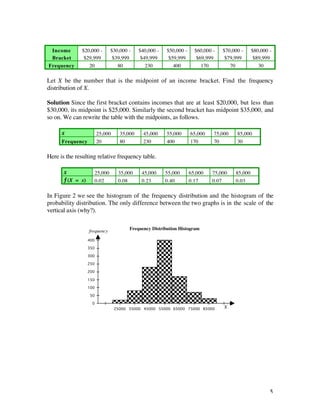
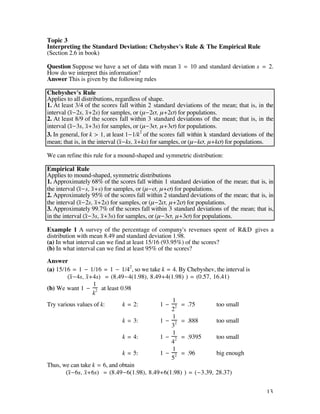
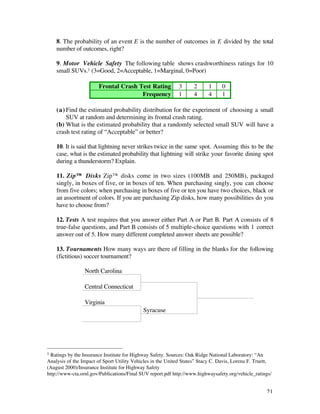
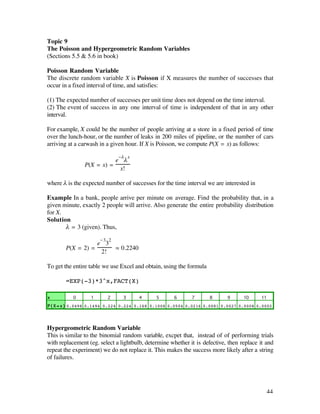
![Also:
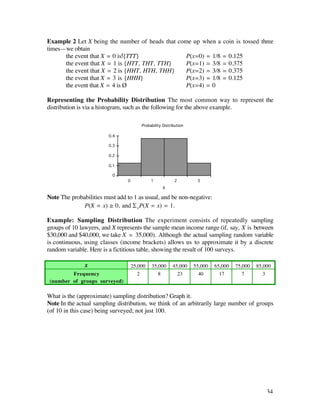
1. If you roll a die 100 times, what is the probability that you will roll between 15 and 20
ones? (Round your answer to 2 decimal places.)
[ 0.57 ]
2. Aviation The probability of a plane’s crashing on a single trip in 1989 was
0.00000165.11 Find the probability that, in 100,000,000 flights, there will be fewer than 180
crashes.
[ 0.871 ]
3. Polls In a certain political poll, each person polled has a 90% probability of telling his or
her real preference. Suppose that 55% of the population really prefer candidate Goode, and
45% prefer candidate Slick. Find first the probability that a person polled will say that he or
she prefers Goode, then find the probability that, if 1,000 people are polled, candidate
Goode will get more than 52%.
[ Probability that a person will say Goode = 0.54. Probability that Goode polls more than
52% ‡ 0.892. ]
11 Source for this exercise and the following three: National Transportation Safety Board.
54](https://image.slidesharecdn.com/qm1notes-110920043524-phpapp01/85/Qm1-notes-55-320.jpg)
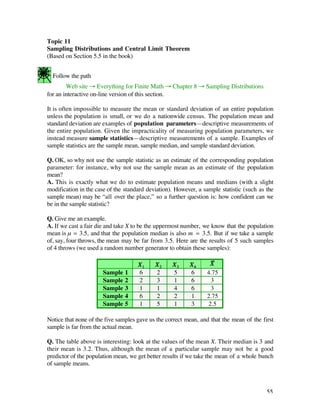
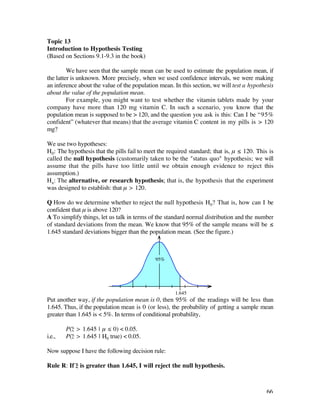
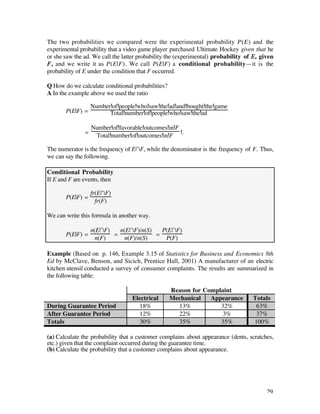
![A. You have put your thumb on one of the most important concepts inferential statistics; the
values of X— are values of a random variable (take a sample of 5, and measure the mean), and
its probability distribution is called the sampling distribution of the sample mean. The
above table suggests that the expected value of the sampling distribution of the mean is the
same as the population mean, and this turns out to be true.
Sampling Distribution
The sampling distribution of a statistic S for samples of size n is defined as follows. The
experiment consists of choosing a sample of size n from the population and measuring the
statistic S. The sampling distribution is the resulting probability distribution.
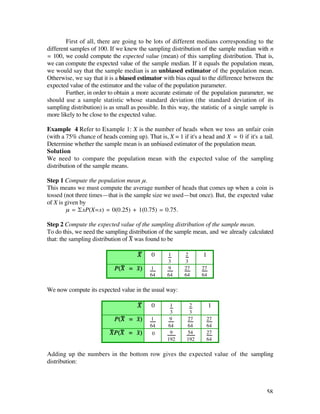
Example 1 Sampling Distribution
An unfair coin has a 75% chance of landing heads-up. Let X = 1 if it lands heads-up, and X
= 0 if it lands tails-up. Find the sampling distribution of the mean X— for sample size 3.
Solution The experiment consists of tossing a coin 3 times and measuring the sample
mean X—. The following table shows the collection of all possible outcomes (samples) and
associated sample mean.
Outcome HHH HHT HTH HTT THH THT TTH TTT
Probability 27 9 9 3 9 3 3 1
64 64 64 64 64 64 64 64
X— 1 2 2 1 2 1 1 0
3 3 3 3 3 3
The values of X— are 0, 1/3, 2/3, and 1. The desired sampling distribution is its probability
distribution, shown below.
X— 0 1 2 1
3 3
P(X— = x–) 1 9 27 27
64 64 64 64
Note For this small sample size, the distribution of the sample mean is a binomial
distribution. The Central Limit Theorem will tell us that, for large sample sizes, it must look
more and more like a normal distribution.
Example 2
Look at Example 6.1 on p. 242-243, which has a larger list of possible samples.
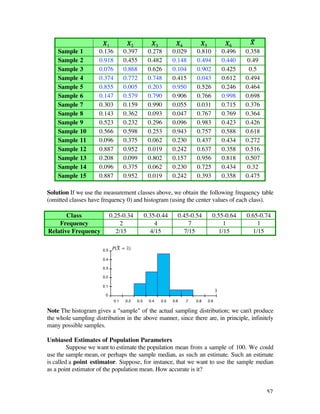
Example 3 Sampling from a Uniform Distribution
The example with which we began this section involved taking five samples from a finite
uniform random variable. Here is a sequence of 15 samples with n = 6 taken from a
continuous uniform distribution with domain [0, 1]. Give the relative frequency histogram
for X— using measurement classes 0.05-0.14, 0.15-0.24, 0.25-0.34, 0.35-0.44, ...
56](https://image.slidesharecdn.com/qm1notes-110920043524-phpapp01/85/Qm1-notes-57-320.jpg)
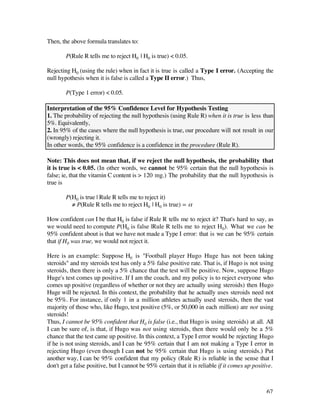
![Answer: It is the value of Z such that P(0 ≤ Z ≤ z0.05) = 0.45. In other words, z0.05 is the
number such that
P(Z ≥ z0.05) = 0.05,
That is, it is the number (measured in standard deviations) such that the area of the upper
half of the tail of the Z-distribution is 0.05.
Here is the usual convention. We let å be such that (1-å) is the desired confidence. For
instance, here
1-å = 0.9,
so å = 0.10
for 90% confidence. Then, the z-value we want is z0.05 = zå/2.
Common Values of zå / 2 (so we don’t have to go to the tables every time)
Confidence Level:
(1-å) å å/2 Zå/2
0.90 0.10 0.05 1.645
0.95 0.05 0.025 1.96
0.99 0.01 0.005 2.575
Now we can put everything together and get a “method box:”
How to find the (1-å) Confidence Interval for the Population Mean µ
(1) If we know the population standard deviation ß, then we can be 100(1-å)% certain that
µ is in the interval
x– ± zå/2ß/ n .
(2) If ß is not known, we can estimate it as s, the sample standard deviation.
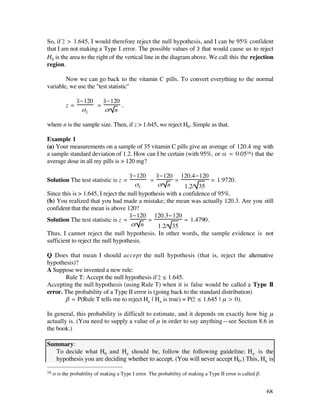
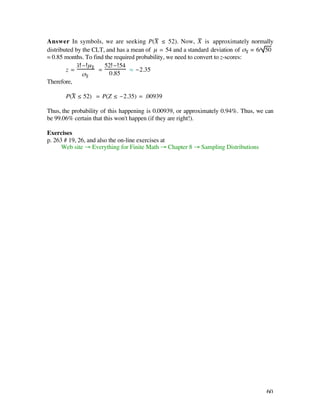
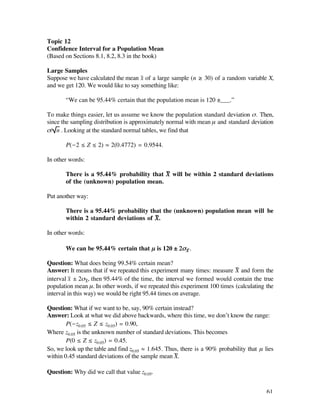
Example 1 (Computing a Confidence Interval)
You are an airline executive, and are trying to decide whether to increase the carrier size for a
particular flight from LA to NY at a certain time.† 225 flight records are randomly selected,
giving a sample mean of x– = 11.6 unoccupied seats with s = 4.1 seats. Estimate a 90%
confidence interval for the mean number of unoccupied seats.
Solution A confidence level of 90% gives å/2 = 0.05, and zå/2 = 1.645 standard
deviations. Thus, the 90% confidence interval is
x– ± zå/2ß/ n = 11.6 ± 1.645(4.1)/ 225 ‡ 11.6 ± 0.45,
or [11.15, 12.05].
†Californian residents are fleeing to New York in droves now that Arnold Schwartzenegger has become
governor.
62](https://image.slidesharecdn.com/qm1notes-110920043524-phpapp01/85/Qm1-notes-63-320.jpg)
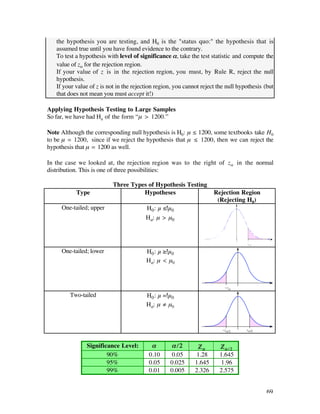
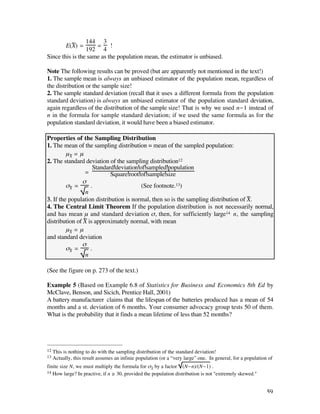
![Summary: Dealing with Small Samples
1. If we know the population standard deviation, we can use the z-statistic as usual (making
the assumption that the original distribution is approximately normal), and the
confidence interval is
x– ± zå/2ß/ n
as usual.
2 . If all we know is the sample standard deviation, we must use the t-statistic for n-1
degrees of freedom (ñ = n-1), and the confidence interval is
x– ± tå/2s/ n .
Assumption in both cases: The population distribution is approximately normal.
Example 3
The lifetime of an inkjet printer head (in millions of characters printed until failure) for 15
different inkjet heads is 1.24, with a sample standard deviation of 0.19.
(a) Form the 99% confidence interval.
(b) If the population standard deviation is also 0.19, is the resulting confidence interval
wider or narrower?
Solution
(a) Number of degrees of freedom is ñ = n-1 = 14
t0.005 = 2.977.
Thus, the interval is
2.977¿0.19
x– ± tå/2s/ n = 1.24 ± ‡ 1.24±0.146,
15
or [1.094, 1.386] million characters.
(b) If we used z instead, we would obtain
2.575¿0.19
x– ± zå/2ß/ n = 1.24 ± ‡ 1.24±0.126,
15
a much narrower interval.
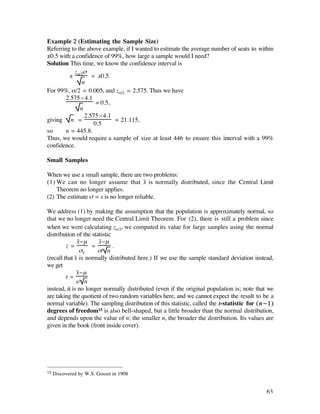
Example 4 (Estimating Sample Size Again)
If we wanted to estimate the lifetime of the above inkjet head to within ±0.1 million
characters with 99% certainty, how large should our sample size be?
Solution It is impossible to solve for n in the t-distribution, since it also depends on both s
and n. Instead, we go with the z-distribution, and hope for the best:
zå/2ß
= 0.1.
n
For 99%, å/2 = 0.005, and zå/2 = 2.575. Thus we have
2.575¿0.19
= 0.1,
n
2.575¿0.19
giving n = ‡ 4.8925,
0.1
so n ‡ 24.
64](https://image.slidesharecdn.com/qm1notes-110920043524-phpapp01/85/Qm1-notes-65-320.jpg)