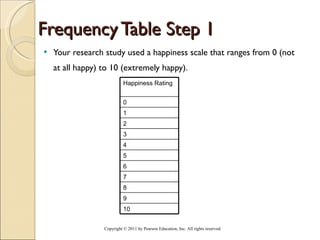
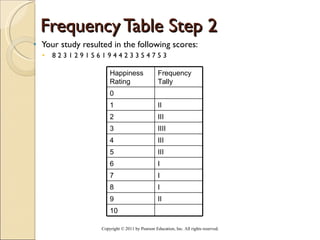
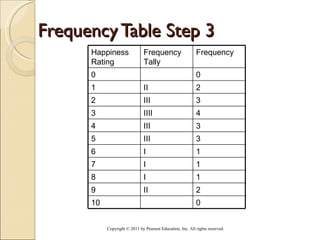
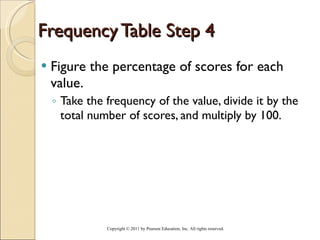
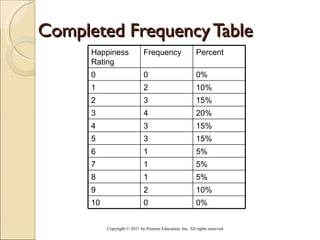
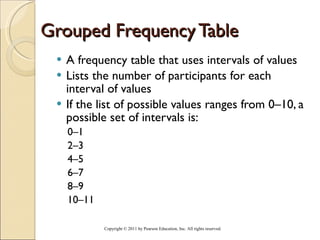
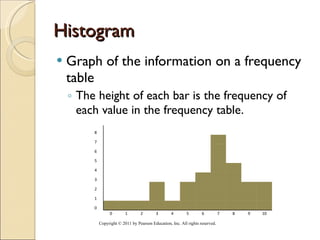
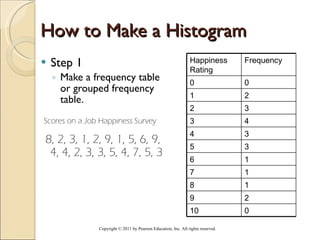
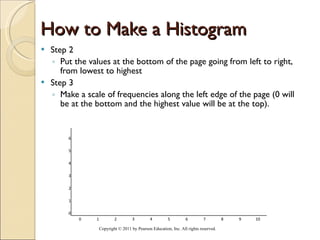
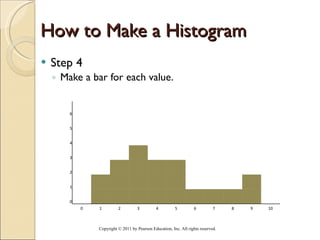
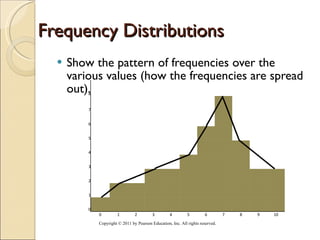
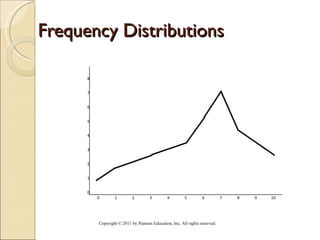
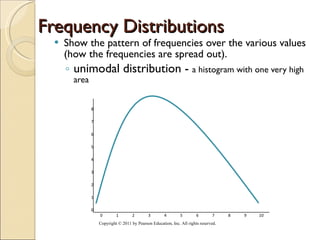
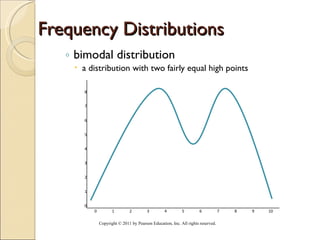
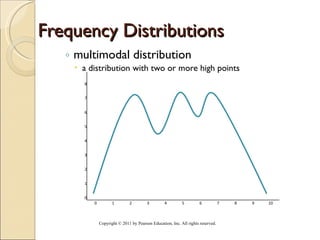
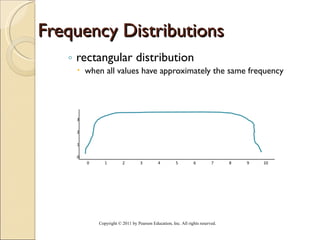
This document provides an overview of key concepts in descriptive statistics, including frequency tables, histograms, and distributions. It explains that frequency tables and histograms summarize and describe patterns in a set of scores or values. A frequency table shows the counts of observations at each value, while a histogram uses bar heights to represent frequencies, making distributions visually apparent. An example shows how to construct a frequency table and histogram from a set of job happiness ratings ranging from 0 to 10.