Downloaded 176 times


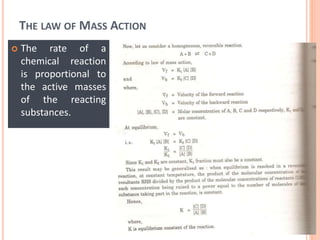

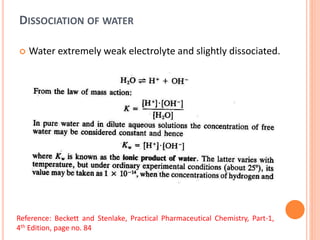
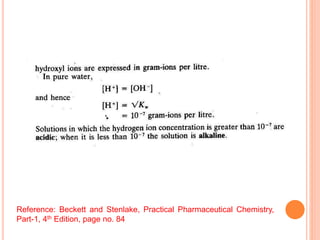
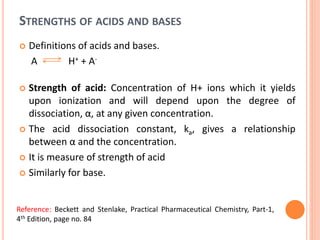
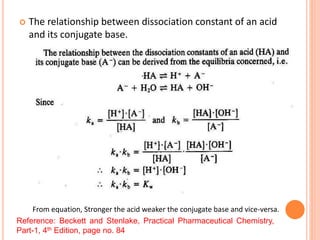


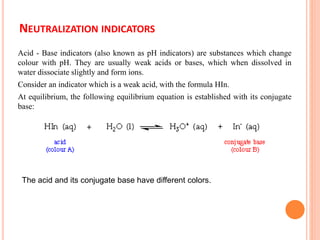
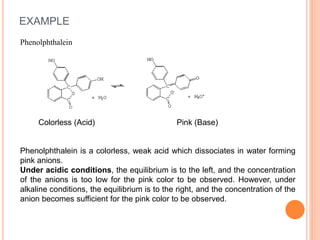


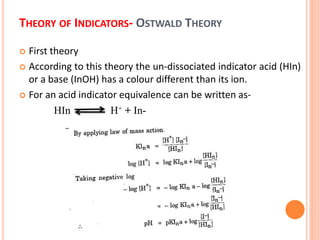
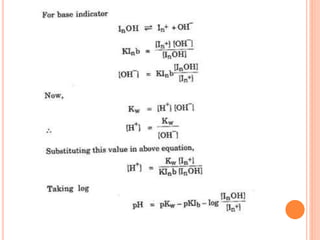
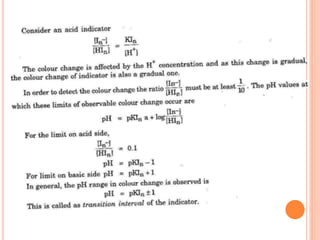
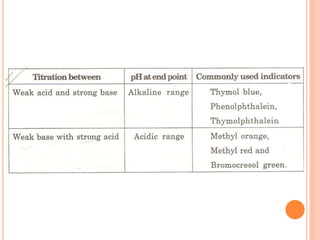


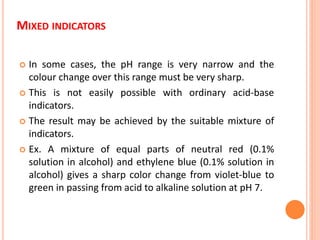
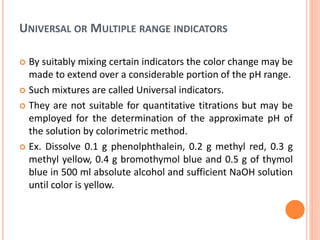

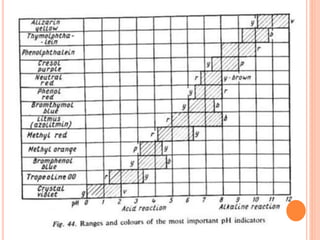
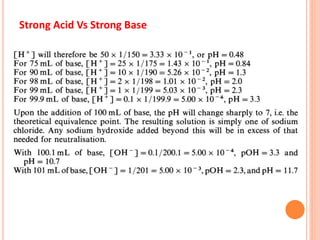


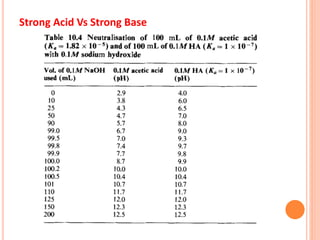
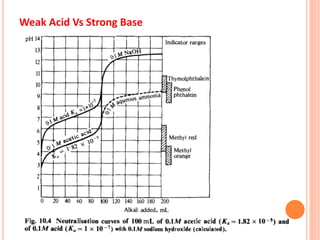

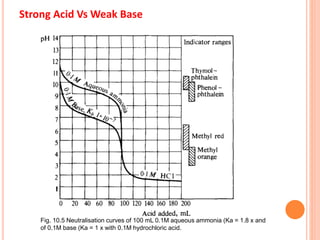


The document discusses acid-base titrations and concepts. It describes primary and secondary standard substances used for titrations. The key theories covered include Arrhenius, Bronsted-Lowry, and the law of mass action. It also discusses strong vs weak electrolytes, acid and base strength definitions, hydrolysis of salts, end point detection using indicators, and different types of neutralization curves between strong acids/bases and weak acids/bases. Neutralization indicators and their properties are explained in detail through Ostwald and resonance theories.


