Download to read offline


![TPS II
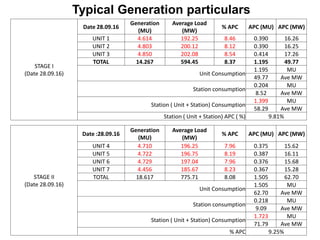
(Date 28.09.16)
Total (Stage I + II) Generation
32.884 MU
1370.16 Ave MW
Total (Stage I + II)Unit Consumption
2.70 MU
112.47 Ave MW
Total (Stage I + II)Station consumption
0.42 MU
17.61 Ave MW
Total (Station + Unit) Consumption
3.122 MU
130.08 Ave MW
Station % APC 9.49%
Station %APC = [Fed to the bus (Export) – Station Consumption (Import)] / [Total Generation]
Typical Generation particulars](https://image.slidesharecdn.com/7-200912152008/85/APC-in-thermal-power-plant-5-320.jpg)
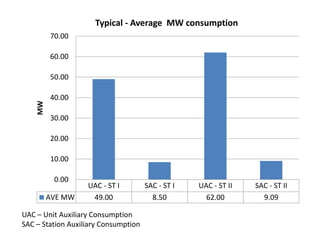
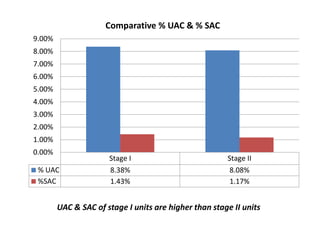
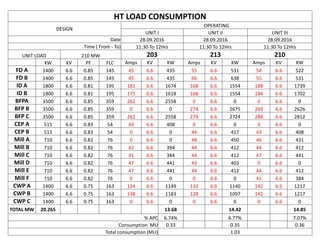
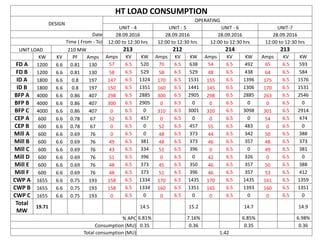
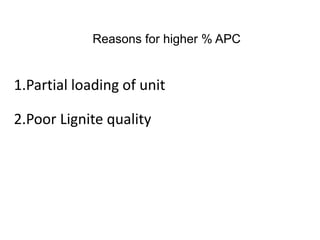
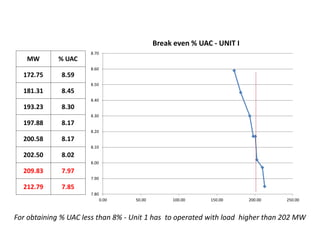
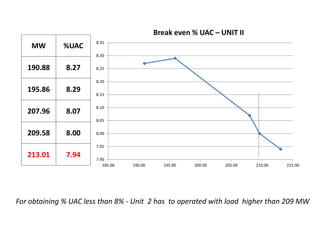
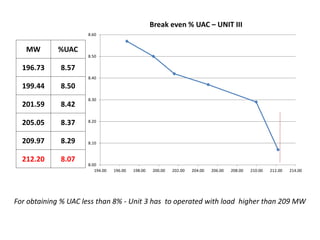

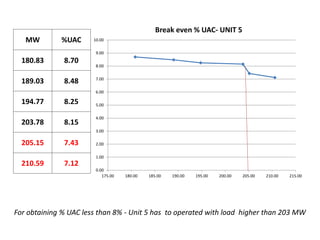
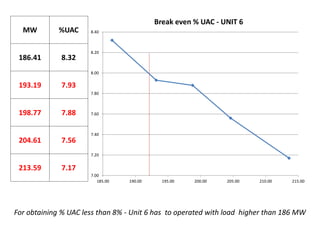
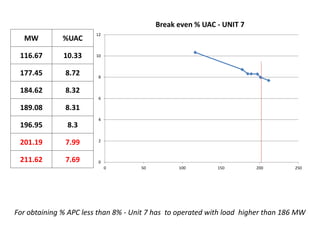
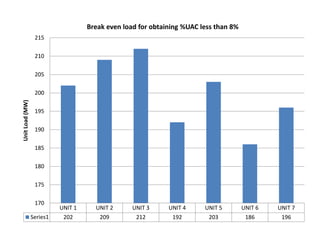

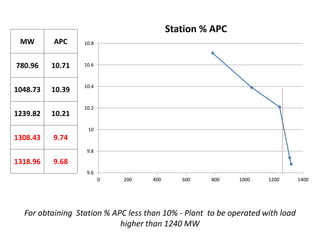
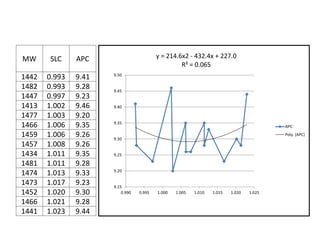
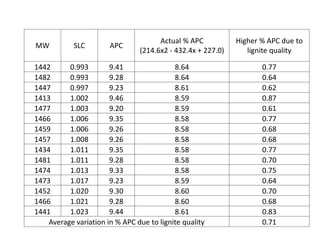

This document contains a study report on auxiliary power consumption (APC) at a thermal power station (TPS). It provides APC data for 7 generating units over two stages on a given date. The total APC for both stages was 9.49% of total generation. Charts show the average APC is higher for Stage I units compared to Stage II. Additional charts show the minimum loads required to achieve less than 8% APC for each unit, ranging from 186-213 MW. Partial loading and poor quality lignite are identified as reasons for higher APC percentages.