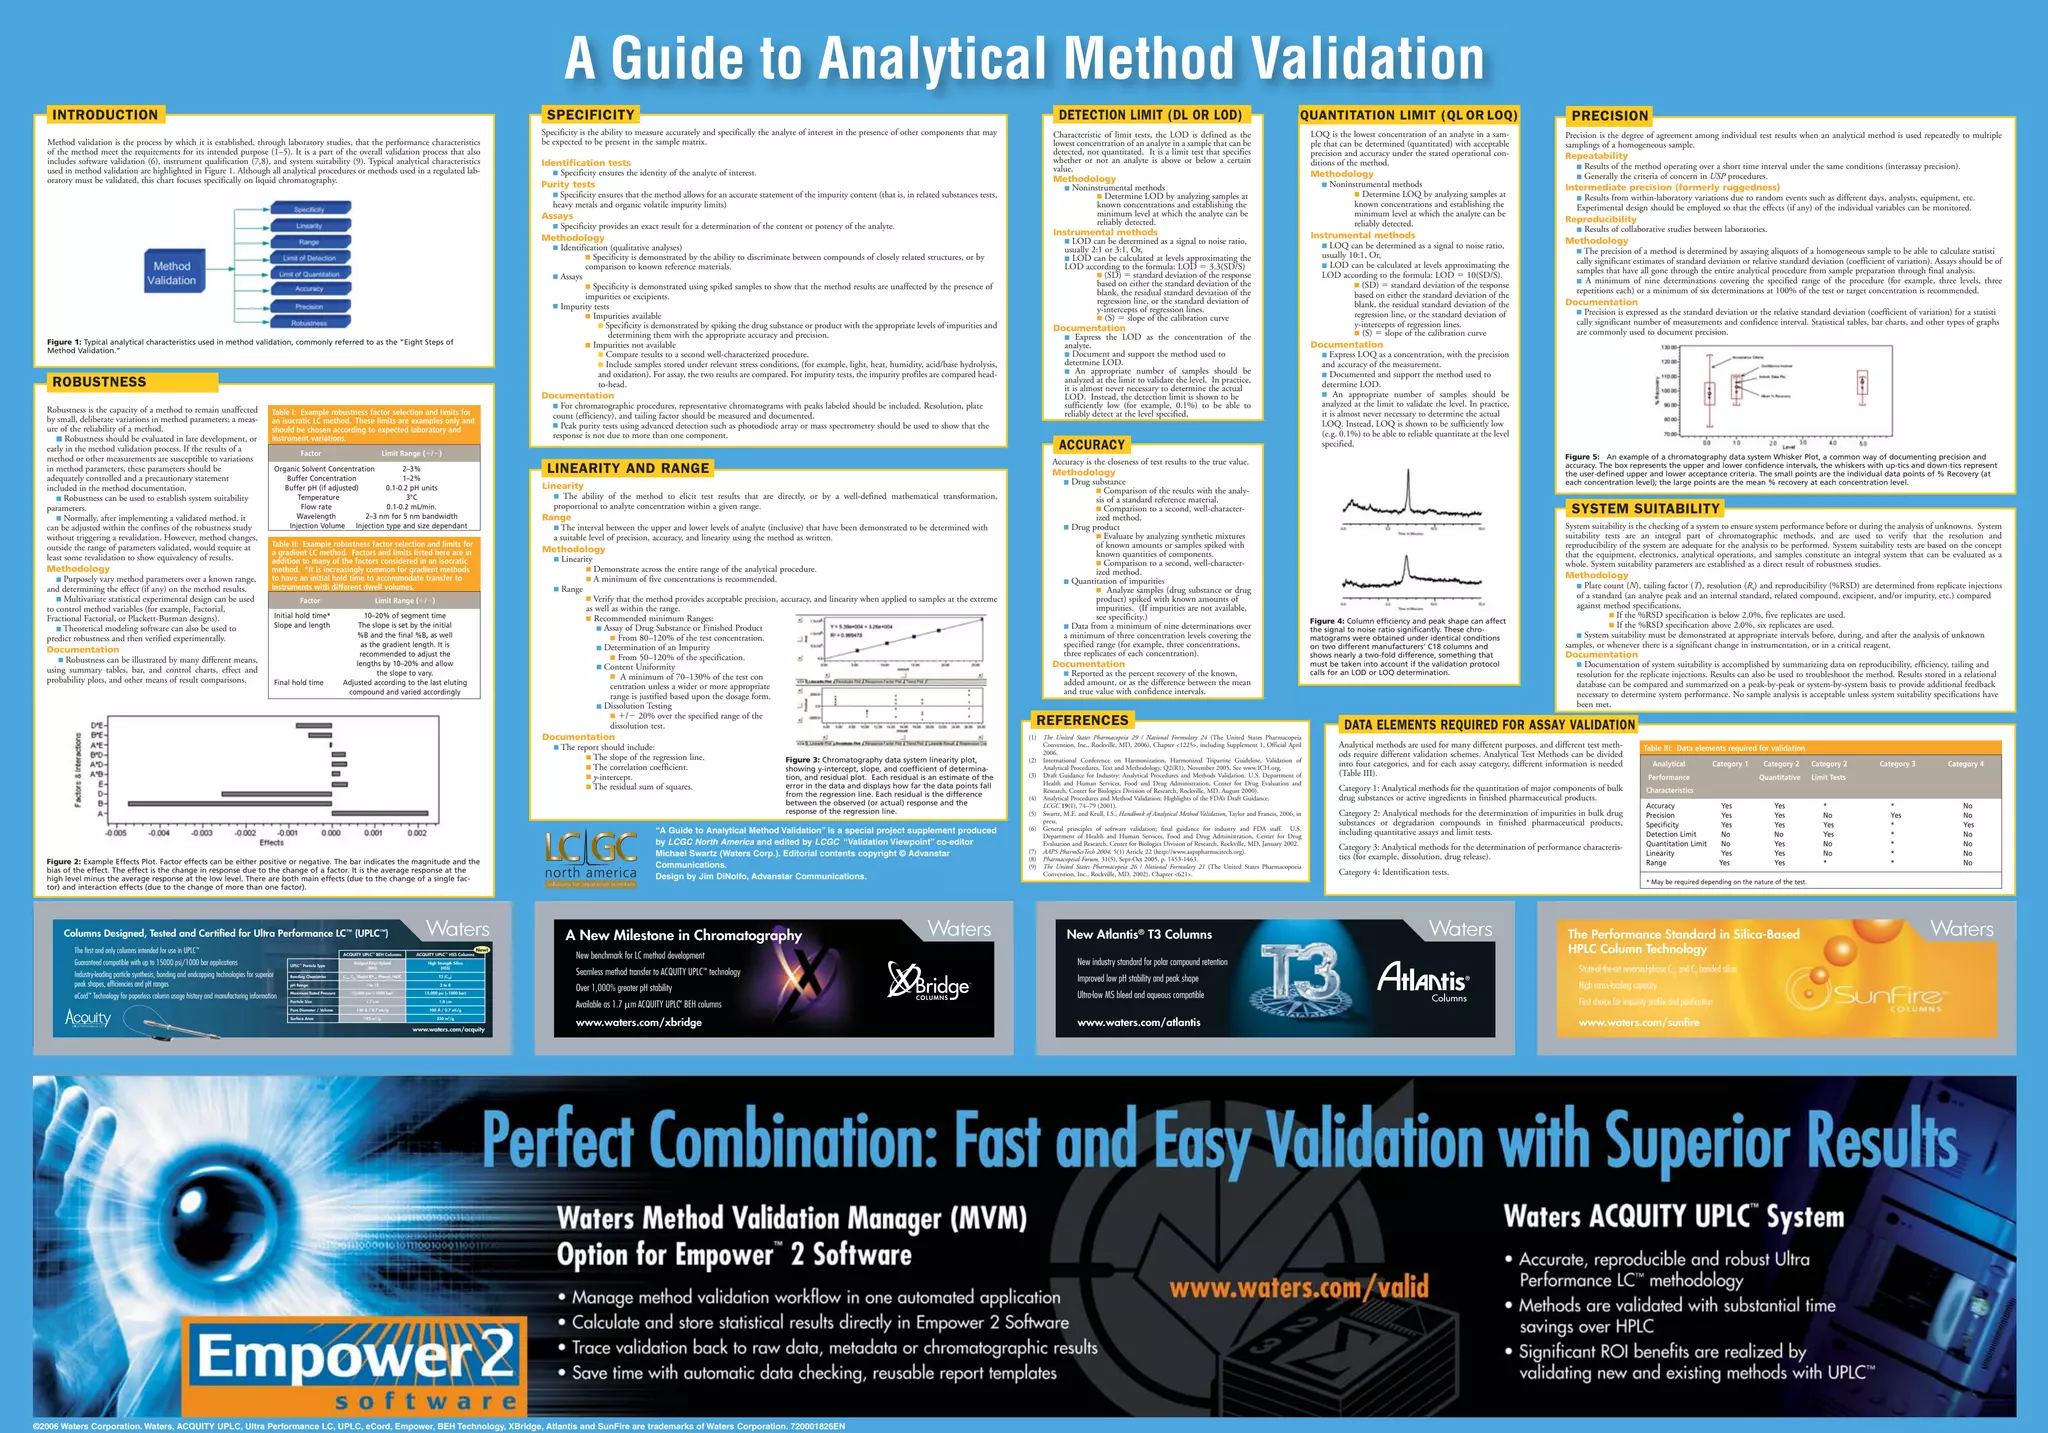
SlideShare a Scribd company logo
SPECIFICITY
LINEARITY AND RANGE
INTRODUCTION
“A Guide to Analytical Method Validation” is a special project supplement produced
by LCGC North America and edited by LCGC “Validation Viewpoint” co-editor
Michael Swartz (Waters Corp.). Editorial contents copyright © Advanstar
Communications.
Design by Jim DiNolfo, Advanstar Communications.
©2006 Waters Corporation. Waters, ACQUITY UPLC, Ultra Performance LC, UPLC, eCord, Empower, BEH Technology, XBridge, Atlantis and SunFire are trademarks of Waters Corporation. 720001826EN
REFERENCES DATA ELEMENTS REQUIRED FOR ASSAY VALIDATION
PRECISION
SYSTEM SUITABILITY
ROBUSTNESS
QUANTITATION LIMIT (QL OR LOQ)
A Guide to Analytical Method Validation
A New Milestone in Chromatography
New benchmark for LC method development
Seamless method transfer to ACQUITY UPLC™
technology
Over 1,000% greater pH stability
Available as 1.7 µm ACQUITY UPLC
™
BEH columns
www.waters.com/xbridge
Columns Designed, Tested and Certified for Ultra Performance LC™
(UPLC™
)
The first and only columns intended for use in UPLC™
Guaranteed compatible with up to 15000 psi/1000 bar applications
Industry-leading particle synthesis, bonding and endcapping technologies for superior
peak shapes, efficiencies and pH ranges
eCord™
Technology for paperless column usage history and manufacturing information
www.waters.com/acquity
ACQUITY UPLC™
BEH Columns ACQUITY UPLC™
HSS Columns
UPLC™
Particle Type
Bridged Ethyl Hybrid
(BEH)
High Strength Silica
(HSS)
Bonding Chemistries C18
, C8
, Shield RP18
, Phenyl, HILIC T3 (C18
)
pH Range 1 to 12 2 to 8
Maximum Rated Pressure 15,000 psi (~1000 bar) 15,000 psi (~1000 bar)
Particle Size 1.7 µm 1.8 µm
Pore Diameter / Volume 130 Å / 0.7 mL/g 100 Å / 0.7 mL/g
Surface Area 185 m2
/g 230 m2
/g
New!
New Atlantis®
T3 Columns
New industry standard for polar compound retention
Improved low pH stability and peak shape
Ultra-low MS bleed and aqueous compatible
www.waters.com/atlantis
The Performance Standard in Silica-Based
HPLC Column Technology
State-of-the-art reversed-phase C18
and C8
bonded silica
High mass-loading capacity
First choice for impurity profile and purification
www.waters.com/sunfire
Method validation is the process by which it is established, through laboratory studies, that the performance characteristics
of the method meet the requirements for its intended purpose (1–5). It is a part of the overall validation process that also
includes software validation (6), instrument qualification (7,8), and system suitability (9). Typical analytical characteristics
used in method validation are highlighted in Figure 1. Although all analytical procedures or methods used in a regulated lab-
oratory must be validated, this chart focuses specifically on liquid chromatography.
Figure 1: Typical analytical characteristics used in method validation, commonly referred to as the “Eight Steps of
Method Validation.”
Figure 2: Example Effects Plot. Factor effects can be either positive or negative. The bar indicates the magnitude and the
bias of the effect. The effect is the change in response due to the change of a factor. It is the average response at the
high level minus the average response at the low level. There are both main effects (due to the change of a single fac-
tor) and interaction effects (due to the change of more than one factor).
Robustness is the capacity of a method to remain unaffected
by small, deliberate variations in method parameters; a meas-
ure of the reliability of a method.
 Robustness should be evaluated in late development, or
early in the method validation process. If the results of a
method or other measurements are susceptible to variations
in method parameters, these parameters should be
adequately controlled and a precautionary statement
included in the method documentation.
 Robustness can be used to establish system suitability
parameters.
 Normally, after implementing a validated method, it
can be adjusted within the confines of the robustness study
without triggering a revalidation. However, method changes,
outside the range of parameters validated, would require at
least some revalidation to show equivalency of results.
Methodology
 Purposely vary method parameters over a known range,
and determining the effect (if any) on the method results.
 Multivariate statistical experimental design can be used
to control method variables (for example, Factorial,
Fractional Factorial, or Plackett-Burman designs).
 Theoretical modeling software can also be used to
predict robustness and then verified experimentally.
Documentation
 Robustness can be illustrated by many different means,
using summary tables, bar, and control charts, effect and
probability plots, and other means of result comparisons.
Table I: Example robustness factor selection and limits for
an isocratic LC method. These limits are examples only and
should be chosen according to expected laboratory and
instrument variations.
Factor Limit Range (/)
Organic Solvent Concentration 2–3%
Buffer Concentration 1–2%
Buffer pH (if adjusted) 0.1-0.2 pH units
Temperature 3°C
Flow rate 0.1-0.2 mL/min.
Wavelength 2–3 nm for 5 nm bandwidth
Injection Volume Injection type and size dependant
Table III: Data elements required for validation.
Analytical Category 1 Category 2 Category 2 Category 3 Category 4
Performance Quantitative Limit Tests
Characteristics
Accuracy Yes Yes * * No
Precision Yes Yes No Yes No
Specificity Yes Yes Yes * Yes
Detection Limit No No Yes * No
Quantitation Limit No Yes No * No
Linearity Yes Yes No * No
Range Yes Yes * * No
* May be required depending on the nature of the test.
Table II: Example robustness factor selection and limits for
a gradient LC method. Factors and limits listed here are in
addition to many of the factors considered in an isocratic
method. *It is increasingly common for gradient methods
to have an initial hold time to accommodate transfer to
instruments with different dwell volumes.
Factor Limit Range (/)
Initial hold time* 10–20% of segment time
Slope and length The slope is set by the initial
%B and the final %B, as well
as the gradient length. It is
recommended to adjust the
lengths by 10–20% and allow
the slope to vary.
Final hold time Adjusted according to the last eluting
compound and varied accordingly
Specificity is the ability to measure accurately and specifically the analyte of interest in the presence of other components that may
be expected to be present in the sample matrix.
Identification tests
 Specificity ensures the identity of the analyte of interest.
Purity tests
 Specificity ensures that the method allows for an accurate statement of the impurity content (that is, in related substances tests,
heavy metals and organic volatile impurity limits)
Assays
 Specificity provides an exact result for a determination of the content or potency of the analyte.
Methodology
 Identification (qualitative analyses)
 Specificity is demonstrated by the ability to discriminate between compounds of closely related structures, or by
comparison to known reference materials.
 Assays
 Specificity is demonstrated using spiked samples to show that the method results are unaffected by the presence of
impurities or excipients.
 Impurity tests
 Impurities available
 Specificity is demonstrated by spiking the drug substance or product with the appropriate levels of impurities and
determining them with the appropriate accuracy and precision.
 Impurities not available
 Compare results to a second well-characterized procedure.
 Include samples stored under relevant stress conditions, (for example, light, heat, humidity, acid/base hydrolysis,
and oxidation). For assay, the two results are compared. For impurity tests, the impurity profiles are compared head-
to-head.
Documentation
 For chromatographic procedures, representative chromatograms with peaks labeled should be included. Resolution, plate
count (efficiency), and tailing factor should be measured and documented.
 Peak purity tests using advanced detection such as photodiode array or mass spectrometry should be used to show that the
response is not due to more than one component.
Linearity
 The ability of the method to elicit test results that are directly, or by a well-defined mathematical transformation,
proportional to analyte concentration within a given range.
Range
 The interval between the upper and lower levels of analyte (inclusive) that have been demonstrated to be determined with
a suitable level of precision, accuracy, and linearity using the method as written.
Methodology
 Linearity
 Demonstrate across the entire range of the analytical procedure.
 A minimum of five concentrations is recommended.
 Range
 Verify that the method provides acceptable precision, accuracy, and linearity when applied to samples at the extreme
as well as within the range.
 Recommended minimum Ranges:
 Assay of Drug Substance or Finished Product
 From 80–120% of the test concentration.
 Determination of an Impurity
 From 50–120% of the specification.
 Content Uniformity
 A minimum of 70–130% of the test con
centration unless a wider or more appropriate
range is justified based upon the dosage form.
 Dissolution Testing
 / 20% over the specified range of the
dissolution test.
Documentation
 The report should include:
 The slope of the regression line.
 The correlation coefficient.
 y-intercept.
 The residual sum of squares.
Figure 3: Chromatography data system linearity plot,
showing y-intercept, slope, and coefficient of determina-
tion, and residual plot. Each residual is an estimate of the
error in the data and displays how far the data points fall
from the regression line. Each residual is the difference
between the observed (or actual) response and the
response of the regression line.
Characteristic of limit tests, the LOD is defined as the
lowest concentration of an analyte in a sample that can be
detected, not quantitated. It is a limit test that specifies
whether or not an analyte is above or below a certain
value.
Methodology
 Noninstrumental methods
 Determine LOD by analyzing samples at
known concentrations and establishing the
minimum level at which the analyte can be
reliably detected.
Instrumental methods
 LOD can be determined as a signal to noise ratio,
usually 2:1 or 3:1, Or,
 LOD can be calculated at levels approximating the
LOD according to the formula: LOD  3.3(SD/S)
 (SD)  standard deviation of the response
based on either the standard deviation of the
blank, the residual standard deviation of the
regression line, or the standard deviation of
y-intercepts of regression lines.
 (S)  slope of the calibration curve
Documentation
 Express the LOD as the concentration of the
analyte.
 Document and support the method used to
determine LOD.
 An appropriate number of samples should be
analyzed at the limit to validate the level. In practice,
it is almost never necessary to determine the actual
LOD. Instead, the detection limit is shown to be
sufficiently low (for example, 0.1%) to be able to
reliably detect at the level specified.
LOQ is the lowest concentration of an analyte in a sam-
ple that can be determined (quantitated) with acceptable
precision and accuracy under the stated operational con-
ditions of the method.
Methodology
 Noninstrumental methods
 Determine LOQ by analyzing samples at
known concentrations and establishing the
minimum level at which the analyte can be
reliably detected.
Instrumental methods
 LOQ can be determined as a signal to noise ratio,
usually 10:1, Or,
 LOD can be calculated at levels approximating the
LOD according to the formula: LOD  10(SD/S).
 (SD)  standard deviation of the response
based on either the standard deviation of the
blank, the residual standard deviation of the
regression line, or the standard deviation of
y-intercepts of regression lines.
 (S)  slope of the calibration curve
Documentation
 Express LOQ as a concentration, with the precision
and accuracy of the measurement.
 Documented and support the method used to
determine LOD.
 An appropriate number of samples should be
analyzed at the limit to validate the level. In practice,
it is almost never necessary to determine the actual
LOQ. Instead, LOQ is shown to be sufficiently low
(e.g. 0.1%) to be able to reliable quantitate at the level
specified.
Figure 4: Column efficiency and peak shape can affect
the signal to noise ratio significantly. These chro-
matograms were obtained under identical conditions
on two different manufacturers’ C18 columns and
shows nearly a two-fold difference, something that
must be taken into account if the validation protocol
calls for an LOD or LOQ determination.
DETECTION LIMIT (DL OR LOD)
ACCURACY
Accuracy is the closeness of test results to the true value.
Methodology
 Drug substance
 Comparison of the results with the analy-
sis of a standard reference material.
 Comparison to a second, well-character-
ized method.
 Drug product
 Evaluate by analyzing synthetic mixtures
of known amounts or samples spiked with
known quantities of components.
 Comparison to a second, well-character-
ized method.
 Quantitation of impurities
 Analyze samples (drug substance or drug
product) spiked with known amounts of
impurities. (If impurities are not available,
see specificity.)
 Data from a minimum of nine determinations over
a minimum of three concentration levels covering the
specified range (for example, three concentrations,
three replicates of each concentration).
Documentation
 Reported as the percent recovery of the known,
added amount, or as the difference between the mean
and true value with confidence intervals.
Precision is the degree of agreement among individual test results when an analytical method is used repeatedly to multiple
samplings of a homogeneous sample.
Repeatability
 Results of the method operating over a short time interval under the same conditions (interassay precision).
 Generally the criteria of concern in USP procedures.
Intermediate precision (formerly ruggedness)
 Results from within-laboratory variations due to random events such as different days, analysts, equipment, etc.
Experimental design should be employed so that the effects (if any) of the individual variables can be monitored.
Reproducibility
 Results of collaborative studies between laboratories.
Methodology
 The precision of a method is determined by assaying aliquots of a homogeneous sample to be able to calculate statisti
cally significant estimates of standard deviation or relative standard deviation (coefficient of variation). Assays should be of
samples that have all gone through the entire analytical procedure from sample preparation through final analysis.
 A minimum of nine determinations covering the specified range of the procedure (for example, three levels, three
repetitions each) or a minimum of six determinations at 100% of the test or target concentration is recommended.
Documentation
 Precision is expressed as the standard deviation or the relative standard deviation (coefficient of variation) for a statisti
cally significant number of measurements and confidence interval. Statistical tables, bar charts, and other types of graphs
are commonly used to document precision.
Figure 5: An example of a chromatography data system Whisker Plot, a common way of documenting precision and
accuracy. The box represents the upper and lower confidence intervals, the whiskers with up-tics and down-tics represent
the user-defined upper and lower acceptance criteria. The small points are the individual data points of % Recovery (at
each concentration level); the large points are the mean % recovery at each concentration level.
System suitability is the checking of a system to ensure system performance before or during the analysis of unknowns. System
suitability tests are an integral part of chromatographic methods, and are used to verify that the resolution and
reproducibility of the system are adequate for the analysis to be performed. System suitability tests are based on the concept
that the equipment, electronics, analytical operations, and samples constitute an integral system that can be evaluated as a
whole. System suitability parameters are established as a direct result of robustness studies.
Methodology
 Plate count (N), tailing factor (T), resolution (Rs) and reproducibility (%RSD) are determined from replicate injections
of a standard (an analyte peak and an internal standard, related compound, excipient, and/or impurity, etc.) compared
against method specifications.
 If the %RSD specification is below 2.0%, five replicates are used.
 If the %RSD specification above 2.0%, six replicates are used.
 System suitability must be demonstrated at appropriate intervals before, during, and after the analysis of unknown
samples, or whenever there is a significant change in instrumentation, or in a critical reagent.
Documentation
 Documentation of system suitability is accomplished by summarizing data on reproducibility, efficiency, tailing and
resolution for the replicate injections. Results can also be used to troubleshoot the method. Results stored in a relational
database can be compared and summarized on a peak-by-peak or system-by-system basis to provide additional feedback
necessary to determine system performance. No sample analysis is acceptable unless system suitability specifications have
been met.
Analytical methods are used for many different purposes, and different test meth-
ods require different validation schemes. Analytical Test Methods can be divided
into four categories, and for each assay category, different information is needed
(Table III).
Category 1: Analytical methods for the quantitation of major components of bulk
drug substances or active ingredients in finished pharmaceutical products.
Category 2: Analytical methods for the determination of impurities in bulk drug
substances or degradation compounds in finished pharmaceutical products,
including quantitative assays and limit tests.
Category 3: Analytical methods for the determination of performance characteris-
tics (for example, dissolution, drug release).
Category 4: Identification tests.
(1) The United States Pharmacopeia 29 / National Formulary 24 (The United States Pharmacopeia
Convention, Inc., Rockville, MD, 2006), Chapter 1225, including Supplement 1, Official April
2006.
(2) International Conference on Harmonization, Harmonized Tripartite Guideline, Validation of
Analytical Procedures, Text and Methodology, Q2(R1), November 2005, See www.ICH.org.
(3) Draft Guidance for Industry: Analytical Procedures and Methods Validation. U.S. Department of
Health and Human Services, Food and Drug Administration, Center for Drug Evaluation and
Research, Center for Biologics Division of Research, Rockville, MD, August 2000).
(4) Analytical Procedures and Method Validation: Highlights of the FDA’s Draft Guidance.
LCGC 19(1), 74–79 (2001).
(5) Swartz, M.E. and Krull, I.S., Handbook of Analytical Method Validation, Taylor and Francis, 2006, in
press.
(6) General principles of software validation; final guidance for industry and FDA staff. U.S.
Department of Health and Human Services, Food and Drug Administration, Center for Drug
Evaluation and Research, Center for Biologics Division of Research, Rockville, MD, January 2002.
(7) AAPS PharmSciTech 2004, 5(1) Article 22 (http://www.aapspharmscitech.org).
(8) Pharmacopeial Forum, 31(5), Sept-Oct 2005, p. 1453-1463.
(9) The United States Pharmacopeia 26 / National Formulary 21 (The United States Pharmacopoeia
Convention, Inc., Rockville, MD, 2002), Chapter 621.

More Related Content

What's hot

Analytical method validation by manoj ingale(best ppts)
Analytical method validation by manoj ingale(best ppts)Analytical method validation by manoj ingale(best ppts)
Analytical method validation by manoj ingale(best ppts)
Indus Biotech Pvt.Ltd.
 
Basic skills training guide hplc method development and validation- an over...
Basic skills training guide   hplc method development and validation- an over...Basic skills training guide   hplc method development and validation- an over...
Basic skills training guide hplc method development and validation- an over...
bmarkandeya
 
Quality assurance part_2
Quality assurance part_2Quality assurance part_2
Quality assurance part_2
ThorikulHuda2
 
Quantitation techniques used in chromatography
Quantitation techniques used in chromatographyQuantitation techniques used in chromatography
Quantitation techniques used in chromatography
Vrushali Tambe
 
Assay-Method validation-PPT _slide
Assay-Method validation-PPT _slideAssay-Method validation-PPT _slide
Assay-Method validation-PPT _slide
Bhanu Prakash N
 
FDA (invited) Presentation - Specifications and Analytical Method Lifecycle f...
FDA (invited) Presentation - Specifications and Analytical Method Lifecycle f...FDA (invited) Presentation - Specifications and Analytical Method Lifecycle f...
FDA (invited) Presentation - Specifications and Analytical Method Lifecycle f...
Stephan O. Krause, PhD
 
Risk-based Analytical Method Validation and Maintenance Strategies SK-Sep13
Risk-based Analytical Method Validation and Maintenance Strategies SK-Sep13Risk-based Analytical Method Validation and Maintenance Strategies SK-Sep13
Risk-based Analytical Method Validation and Maintenance Strategies SK-Sep13
Stephan O. Krause, PhD
 
Method Validation - ICH /USP Validation, Linearity and Repeatability
Method Validation - ICH /USP Validation, Linearity and Repeatability Method Validation - ICH /USP Validation, Linearity and Repeatability
Method Validation - ICH /USP Validation, Linearity and Repeatability
labgo
 
Item 2. Verification and Validation of Analytical Methods
Item 2. Verification and Validation of Analytical MethodsItem 2. Verification and Validation of Analytical Methods
Item 2. Verification and Validation of Analytical Methods
Soils FAO-GSP
 
AMV final 20Jun17
AMV final 20Jun17AMV final 20Jun17
AMV final 20Jun17
Stephan O. Krause, PhD
 
Analytical method validation
Analytical method validation Analytical method validation
Analytical method validation
Dr. Amit Gangwal Jain (MPharm., PhD.)
 
Analytical method validation
Analytical method validationAnalytical method validation
Analytical method validation
Arti Thakkar
 
Analytical method development and validation
Analytical method development and validationAnalytical method development and validation
Analytical method development and validation
ANANT NAG
 
Method-Validation-HPLC-case-study
Method-Validation-HPLC-case-studyMethod-Validation-HPLC-case-study
Method-Validation-HPLC-case-study
Shreekant Deshpande
 
Analytical purity method development and validation by gas chromatography of ...
Analytical purity method development and validation by gas chromatography of ...Analytical purity method development and validation by gas chromatography of ...
Analytical purity method development and validation by gas chromatography of ...
Alexander Decker
 
Theory of hplc_quantitative_and_qualitative_hplc
Theory of hplc_quantitative_and_qualitative_hplcTheory of hplc_quantitative_and_qualitative_hplc
Theory of hplc_quantitative_and_qualitative_hplc
Vanya Dimcheva
 
Method validation for drug substances and drug product _remodified_2014
Method validation for drug substances and drug product _remodified_2014Method validation for drug substances and drug product _remodified_2014
Method validation for drug substances and drug product _remodified_2014
Ramalingam Badmanaban
 
Analytical method development,validation by uv spectroscopy
Analytical method development,validation by uv spectroscopyAnalytical method development,validation by uv spectroscopy
Analytical method development,validation by uv spectroscopy
thota lakshmi bhavani
 
ICP QC protocol
ICP  QC  protocolICP  QC  protocol
ICP QC protocol
Gamal Abdel Hamid
 
Analytical method development and validation for simultaneous estimation
Analytical method development and validation for simultaneous estimationAnalytical method development and validation for simultaneous estimation
Analytical method development and validation for simultaneous estimation
Professor Beubenz
 

What's hot (20)

Analytical method validation by manoj ingale(best ppts)
Analytical method validation by manoj ingale(best ppts)Analytical method validation by manoj ingale(best ppts)
Analytical method validation by manoj ingale(best ppts)
 
Basic skills training guide hplc method development and validation- an over...
Basic skills training guide   hplc method development and validation- an over...Basic skills training guide   hplc method development and validation- an over...
Basic skills training guide hplc method development and validation- an over...
 
Quality assurance part_2
Quality assurance part_2Quality assurance part_2
Quality assurance part_2
 
Quantitation techniques used in chromatography
Quantitation techniques used in chromatographyQuantitation techniques used in chromatography
Quantitation techniques used in chromatography
 
Assay-Method validation-PPT _slide
Assay-Method validation-PPT _slideAssay-Method validation-PPT _slide
Assay-Method validation-PPT _slide
 
FDA (invited) Presentation - Specifications and Analytical Method Lifecycle f...
FDA (invited) Presentation - Specifications and Analytical Method Lifecycle f...FDA (invited) Presentation - Specifications and Analytical Method Lifecycle f...
FDA (invited) Presentation - Specifications and Analytical Method Lifecycle f...
 
Risk-based Analytical Method Validation and Maintenance Strategies SK-Sep13
Risk-based Analytical Method Validation and Maintenance Strategies SK-Sep13Risk-based Analytical Method Validation and Maintenance Strategies SK-Sep13
Risk-based Analytical Method Validation and Maintenance Strategies SK-Sep13
 
Method Validation - ICH /USP Validation, Linearity and Repeatability
Method Validation - ICH /USP Validation, Linearity and Repeatability Method Validation - ICH /USP Validation, Linearity and Repeatability
Method Validation - ICH /USP Validation, Linearity and Repeatability
 
Item 2. Verification and Validation of Analytical Methods
Item 2. Verification and Validation of Analytical MethodsItem 2. Verification and Validation of Analytical Methods
Item 2. Verification and Validation of Analytical Methods
 
AMV final 20Jun17
AMV final 20Jun17AMV final 20Jun17
AMV final 20Jun17
 
Analytical method validation
Analytical method validation Analytical method validation
Analytical method validation
 
Analytical method validation
Analytical method validationAnalytical method validation
Analytical method validation
 
Analytical method development and validation
Analytical method development and validationAnalytical method development and validation
Analytical method development and validation
 
Method-Validation-HPLC-case-study
Method-Validation-HPLC-case-studyMethod-Validation-HPLC-case-study
Method-Validation-HPLC-case-study
 
Analytical purity method development and validation by gas chromatography of ...
Analytical purity method development and validation by gas chromatography of ...Analytical purity method development and validation by gas chromatography of ...
Analytical purity method development and validation by gas chromatography of ...
 
Theory of hplc_quantitative_and_qualitative_hplc
Theory of hplc_quantitative_and_qualitative_hplcTheory of hplc_quantitative_and_qualitative_hplc
Theory of hplc_quantitative_and_qualitative_hplc
 
Method validation for drug substances and drug product _remodified_2014
Method validation for drug substances and drug product _remodified_2014Method validation for drug substances and drug product _remodified_2014
Method validation for drug substances and drug product _remodified_2014
 
Analytical method development,validation by uv spectroscopy
Analytical method development,validation by uv spectroscopyAnalytical method development,validation by uv spectroscopy
Analytical method development,validation by uv spectroscopy
 
ICP QC protocol
ICP  QC  protocolICP  QC  protocol
ICP QC protocol
 
Analytical method development and validation for simultaneous estimation
Analytical method development and validation for simultaneous estimationAnalytical method development and validation for simultaneous estimation
Analytical method development and validation for simultaneous estimation
 

Similar to Analytical Method Development

Validation of Analytical Procedures.pdf
Validation of Analytical Procedures.pdfValidation of Analytical Procedures.pdf
Validation of Analytical Procedures.pdf
pharma344
 
VALIDATION OF ANALYTICAL PROCEDURES Q2(R2)
VALIDATION OF ANALYTICAL PROCEDURES Q2(R2)VALIDATION OF ANALYTICAL PROCEDURES Q2(R2)
VALIDATION OF ANALYTICAL PROCEDURES Q2(R2)
Chandra Prakash Singh
 
Analytical Method Validations & Detailed Method Validation Parameters
Analytical Method Validations & Detailed Method Validation ParametersAnalytical Method Validations & Detailed Method Validation Parameters
Analytical Method Validations & Detailed Method Validation Parameters
BussaSravanKumar
 
Analytical method validation
Analytical method validationAnalytical method validation
Analytical method validation
Sai Praveen Reddy
 
Analytical method validation
Analytical method validationAnalytical method validation
Analytical method validation
AJAYKUMAR4872
 
Analytical method validation
Analytical method validationAnalytical method validation
Analytical method validation
roshankhetade2
 
Analytical Method Validation
Analytical Method ValidationAnalytical Method Validation
Analytical Method Validation
Stefan Holt
 
Validation of Analytical Methods.pdf
Validation of Analytical Methods.pdfValidation of Analytical Methods.pdf
Validation of Analytical Methods.pdf
anjaneyulu49
 
Analytical control strategy 3
Analytical control strategy 3Analytical control strategy 3
Analytical control strategy 3
Chandra Prakash Singh
 
Method verification
Method verificationMethod verification
Method verification
Robert Farnham
 
Analytical method validation 2020
Analytical method validation 2020Analytical method validation 2020
Analytical method validation 2020
PRANJAY PATIL
 
validation and calibration of HPLC
validation and calibration of HPLCvalidation and calibration of HPLC
validation and calibration of HPLC
Sakshi Garg
 
Analytical Method Validation.pptx
Analytical Method Validation.pptxAnalytical Method Validation.pptx
Analytical Method Validation.pptx
Bholakant raut
 
Analytical Method Validation.pdf
Analytical Method Validation.pdfAnalytical Method Validation.pdf
Analytical Method Validation.pdf
HiteshGajjar7
 
Analytical method validation
Analytical method validationAnalytical method validation
Analytical method validation
SUBHASISH DAS
 
Analytical Method & Technology Transfer Ispe Guide
Analytical Method & Technology Transfer Ispe GuideAnalytical Method & Technology Transfer Ispe Guide
Analytical Method & Technology Transfer Ispe Guide
Crown Cork & Seal
 
Method validation for drug substances and drug product _remodified_2014
Method validation for drug substances and drug product _remodified_2014Method validation for drug substances and drug product _remodified_2014
Method validation for drug substances and drug product _remodified_2014
Ramalingam Badmanaban
 
analytical method validation.pptx
analytical method validation.pptxanalytical method validation.pptx
analytical method validation.pptx
LaxmidharSahoo11
 
Analytical procedures life cycle management
Analytical procedures life cycle managementAnalytical procedures life cycle management
Analytical procedures life cycle management
Chandra Prakash Singh
 
Life cycle of analytical method
Life cycle of analytical methodLife cycle of analytical method
Life cycle of analytical method
Dr. Nandan Dhir Ph.D.
 

Similar to Analytical Method Development (20)

Validation of Analytical Procedures.pdf
Validation of Analytical Procedures.pdfValidation of Analytical Procedures.pdf
Validation of Analytical Procedures.pdf
 
VALIDATION OF ANALYTICAL PROCEDURES Q2(R2)
VALIDATION OF ANALYTICAL PROCEDURES Q2(R2)VALIDATION OF ANALYTICAL PROCEDURES Q2(R2)
VALIDATION OF ANALYTICAL PROCEDURES Q2(R2)
 
Analytical Method Validations & Detailed Method Validation Parameters
Analytical Method Validations & Detailed Method Validation ParametersAnalytical Method Validations & Detailed Method Validation Parameters
Analytical Method Validations & Detailed Method Validation Parameters
 
Analytical method validation
Analytical method validationAnalytical method validation
Analytical method validation
 
Analytical method validation
Analytical method validationAnalytical method validation
Analytical method validation
 
Analytical method validation
Analytical method validationAnalytical method validation
Analytical method validation
 
Analytical Method Validation
Analytical Method ValidationAnalytical Method Validation
Analytical Method Validation
 
Validation of Analytical Methods.pdf
Validation of Analytical Methods.pdfValidation of Analytical Methods.pdf
Validation of Analytical Methods.pdf
 
Analytical control strategy 3
Analytical control strategy 3Analytical control strategy 3
Analytical control strategy 3
 
Method verification
Method verificationMethod verification
Method verification
 
Analytical method validation 2020
Analytical method validation 2020Analytical method validation 2020
Analytical method validation 2020
 
validation and calibration of HPLC
validation and calibration of HPLCvalidation and calibration of HPLC
validation and calibration of HPLC
 
Analytical Method Validation.pptx
Analytical Method Validation.pptxAnalytical Method Validation.pptx
Analytical Method Validation.pptx
 
Analytical Method Validation.pdf
Analytical Method Validation.pdfAnalytical Method Validation.pdf
Analytical Method Validation.pdf
 
Analytical method validation
Analytical method validationAnalytical method validation
Analytical method validation
 
Analytical Method & Technology Transfer Ispe Guide
Analytical Method & Technology Transfer Ispe GuideAnalytical Method & Technology Transfer Ispe Guide
Analytical Method & Technology Transfer Ispe Guide
 
Method validation for drug substances and drug product _remodified_2014
Method validation for drug substances and drug product _remodified_2014Method validation for drug substances and drug product _remodified_2014
Method validation for drug substances and drug product _remodified_2014
 
analytical method validation.pptx
analytical method validation.pptxanalytical method validation.pptx
analytical method validation.pptx
 
Analytical procedures life cycle management
Analytical procedures life cycle managementAnalytical procedures life cycle management
Analytical procedures life cycle management
 
Life cycle of analytical method
Life cycle of analytical methodLife cycle of analytical method
Life cycle of analytical method
 

Recently uploaded

Chapter 11 Nutrition and Chronic Diseases.pptx
Chapter 11 Nutrition and Chronic Diseases.pptxChapter 11 Nutrition and Chronic Diseases.pptx
Chapter 11 Nutrition and Chronic Diseases.pptx
Earlene McNair
 
Physical demands in sports - WCSPT Oslo 2024
Physical demands in sports - WCSPT Oslo 2024Physical demands in sports - WCSPT Oslo 2024
Physical demands in sports - WCSPT Oslo 2024
Torstein Dalen-Lorentsen
 
Aortic Association CBL Pilot April 19 – 20 Bern
Aortic Association CBL Pilot April 19 – 20 BernAortic Association CBL Pilot April 19 – 20 Bern
Aortic Association CBL Pilot April 19 – 20 Bern
suvadeepdas911
 
Hemodialysis: Chapter 4, Dialysate Circuit - Dr.Gawad
Hemodialysis: Chapter 4, Dialysate Circuit - Dr.GawadHemodialysis: Chapter 4, Dialysate Circuit - Dr.Gawad
Hemodialysis: Chapter 4, Dialysate Circuit - Dr.Gawad
NephroTube - Dr.Gawad
 
REGULATION FOR COMBINATION PRODUCTS AND MEDICAL DEVICES.pptx
REGULATION FOR COMBINATION PRODUCTS AND MEDICAL DEVICES.pptxREGULATION FOR COMBINATION PRODUCTS AND MEDICAL DEVICES.pptx
REGULATION FOR COMBINATION PRODUCTS AND MEDICAL DEVICES.pptx
LaniyaNasrink
 
CHEMOTHERAPY_RDP_CHAPTER 6_Anti Malarial Drugs.pdf
CHEMOTHERAPY_RDP_CHAPTER 6_Anti Malarial Drugs.pdfCHEMOTHERAPY_RDP_CHAPTER 6_Anti Malarial Drugs.pdf
CHEMOTHERAPY_RDP_CHAPTER 6_Anti Malarial Drugs.pdf
rishi2789
 
CHEMOTHERAPY_RDP_CHAPTER 4_ANTI VIRAL DRUGS.pdf
CHEMOTHERAPY_RDP_CHAPTER 4_ANTI VIRAL DRUGS.pdfCHEMOTHERAPY_RDP_CHAPTER 4_ANTI VIRAL DRUGS.pdf
CHEMOTHERAPY_RDP_CHAPTER 4_ANTI VIRAL DRUGS.pdf
rishi2789
 
OCT Training Course for clinical practice Part 1
OCT Training Course for clinical practice Part 1OCT Training Course for clinical practice Part 1
OCT Training Course for clinical practice Part 1
KafrELShiekh University
 
Hemodialysis: Chapter 5, Dialyzers Overview - Dr.Gawad
Hemodialysis: Chapter 5, Dialyzers Overview - Dr.GawadHemodialysis: Chapter 5, Dialyzers Overview - Dr.Gawad
Hemodialysis: Chapter 5, Dialyzers Overview - Dr.Gawad
NephroTube - Dr.Gawad
 
Hiranandani Hospital Powai News [Read Now].pdf
Hiranandani Hospital Powai News [Read Now].pdfHiranandani Hospital Powai News [Read Now].pdf
Hiranandani Hospital Powai News [Read Now].pdf
Dr. Sujit Chatterjee CEO Hiranandani Hospital
 
Outbreak management including quarantine, isolation, contact.pptx
Outbreak management including quarantine, isolation, contact.pptxOutbreak management including quarantine, isolation, contact.pptx
Outbreak management including quarantine, isolation, contact.pptx
Pratik328635
 
Ear and its clinical correlations By Dr. Rabia Inam Gandapore.pptx
Ear and its clinical correlations By Dr. Rabia Inam Gandapore.pptxEar and its clinical correlations By Dr. Rabia Inam Gandapore.pptx
Ear and its clinical correlations By Dr. Rabia Inam Gandapore.pptx
Dr. Rabia Inam Gandapore
 
Cell Therapy Expansion and Challenges in Autoimmune Disease
Cell Therapy Expansion and Challenges in Autoimmune DiseaseCell Therapy Expansion and Challenges in Autoimmune Disease
Cell Therapy Expansion and Challenges in Autoimmune Disease
Health Advances
 
The Electrocardiogram - Physiologic Principles
The Electrocardiogram - Physiologic PrinciplesThe Electrocardiogram - Physiologic Principles
The Electrocardiogram - Physiologic Principles
MedicoseAcademics
 
Osteoporosis - Definition , Evaluation and Management .pdf
Osteoporosis - Definition , Evaluation and Management .pdfOsteoporosis - Definition , Evaluation and Management .pdf
Osteoporosis - Definition , Evaluation and Management .pdf
Jim Jacob Roy
 
Local Advanced Lung Cancer: Artificial Intelligence, Synergetics, Complex Sys...
Local Advanced Lung Cancer: Artificial Intelligence, Synergetics, Complex Sys...Local Advanced Lung Cancer: Artificial Intelligence, Synergetics, Complex Sys...
Local Advanced Lung Cancer: Artificial Intelligence, Synergetics, Complex Sys...
Oleg Kshivets
 
CBL Seminar 2024_Preliminary Program.pdf
CBL Seminar 2024_Preliminary Program.pdfCBL Seminar 2024_Preliminary Program.pdf
CBL Seminar 2024_Preliminary Program.pdf
suvadeepdas911
 
Histololgy of Female Reproductive System.pptx
Histololgy of Female Reproductive System.pptxHistololgy of Female Reproductive System.pptx
Histololgy of Female Reproductive System.pptx
AyeshaZaid1
 
Adhd Medication Shortage Uk - trinexpharmacy.com
Adhd Medication Shortage Uk - trinexpharmacy.comAdhd Medication Shortage Uk - trinexpharmacy.com
Adhd Medication Shortage Uk - trinexpharmacy.com
reignlana06
 
Cardiac Assessment for B.sc Nursing Student.pdf
Cardiac Assessment for B.sc Nursing Student.pdfCardiac Assessment for B.sc Nursing Student.pdf
Cardiac Assessment for B.sc Nursing Student.pdf
shivalingatalekar1
 

Recently uploaded (20)

Chapter 11 Nutrition and Chronic Diseases.pptx
Chapter 11 Nutrition and Chronic Diseases.pptxChapter 11 Nutrition and Chronic Diseases.pptx
Chapter 11 Nutrition and Chronic Diseases.pptx
 
Physical demands in sports - WCSPT Oslo 2024
Physical demands in sports - WCSPT Oslo 2024Physical demands in sports - WCSPT Oslo 2024
Physical demands in sports - WCSPT Oslo 2024
 
Aortic Association CBL Pilot April 19 – 20 Bern
Aortic Association CBL Pilot April 19 – 20 BernAortic Association CBL Pilot April 19 – 20 Bern
Aortic Association CBL Pilot April 19 – 20 Bern
 
Hemodialysis: Chapter 4, Dialysate Circuit - Dr.Gawad
Hemodialysis: Chapter 4, Dialysate Circuit - Dr.GawadHemodialysis: Chapter 4, Dialysate Circuit - Dr.Gawad
Hemodialysis: Chapter 4, Dialysate Circuit - Dr.Gawad
 
REGULATION FOR COMBINATION PRODUCTS AND MEDICAL DEVICES.pptx
REGULATION FOR COMBINATION PRODUCTS AND MEDICAL DEVICES.pptxREGULATION FOR COMBINATION PRODUCTS AND MEDICAL DEVICES.pptx
REGULATION FOR COMBINATION PRODUCTS AND MEDICAL DEVICES.pptx
 
CHEMOTHERAPY_RDP_CHAPTER 6_Anti Malarial Drugs.pdf
CHEMOTHERAPY_RDP_CHAPTER 6_Anti Malarial Drugs.pdfCHEMOTHERAPY_RDP_CHAPTER 6_Anti Malarial Drugs.pdf
CHEMOTHERAPY_RDP_CHAPTER 6_Anti Malarial Drugs.pdf
 
CHEMOTHERAPY_RDP_CHAPTER 4_ANTI VIRAL DRUGS.pdf
CHEMOTHERAPY_RDP_CHAPTER 4_ANTI VIRAL DRUGS.pdfCHEMOTHERAPY_RDP_CHAPTER 4_ANTI VIRAL DRUGS.pdf
CHEMOTHERAPY_RDP_CHAPTER 4_ANTI VIRAL DRUGS.pdf
 
OCT Training Course for clinical practice Part 1
OCT Training Course for clinical practice Part 1OCT Training Course for clinical practice Part 1
OCT Training Course for clinical practice Part 1
 
Hemodialysis: Chapter 5, Dialyzers Overview - Dr.Gawad
Hemodialysis: Chapter 5, Dialyzers Overview - Dr.GawadHemodialysis: Chapter 5, Dialyzers Overview - Dr.Gawad
Hemodialysis: Chapter 5, Dialyzers Overview - Dr.Gawad
 
Hiranandani Hospital Powai News [Read Now].pdf
Hiranandani Hospital Powai News [Read Now].pdfHiranandani Hospital Powai News [Read Now].pdf
Hiranandani Hospital Powai News [Read Now].pdf
 
Outbreak management including quarantine, isolation, contact.pptx
Outbreak management including quarantine, isolation, contact.pptxOutbreak management including quarantine, isolation, contact.pptx
Outbreak management including quarantine, isolation, contact.pptx
 
Ear and its clinical correlations By Dr. Rabia Inam Gandapore.pptx
Ear and its clinical correlations By Dr. Rabia Inam Gandapore.pptxEar and its clinical correlations By Dr. Rabia Inam Gandapore.pptx
Ear and its clinical correlations By Dr. Rabia Inam Gandapore.pptx
 
Cell Therapy Expansion and Challenges in Autoimmune Disease
Cell Therapy Expansion and Challenges in Autoimmune DiseaseCell Therapy Expansion and Challenges in Autoimmune Disease
Cell Therapy Expansion and Challenges in Autoimmune Disease
 
The Electrocardiogram - Physiologic Principles
The Electrocardiogram - Physiologic PrinciplesThe Electrocardiogram - Physiologic Principles
The Electrocardiogram - Physiologic Principles
 
Osteoporosis - Definition , Evaluation and Management .pdf
Osteoporosis - Definition , Evaluation and Management .pdfOsteoporosis - Definition , Evaluation and Management .pdf
Osteoporosis - Definition , Evaluation and Management .pdf
 
Local Advanced Lung Cancer: Artificial Intelligence, Synergetics, Complex Sys...
Local Advanced Lung Cancer: Artificial Intelligence, Synergetics, Complex Sys...Local Advanced Lung Cancer: Artificial Intelligence, Synergetics, Complex Sys...
Local Advanced Lung Cancer: Artificial Intelligence, Synergetics, Complex Sys...
 
CBL Seminar 2024_Preliminary Program.pdf
CBL Seminar 2024_Preliminary Program.pdfCBL Seminar 2024_Preliminary Program.pdf
CBL Seminar 2024_Preliminary Program.pdf
 
Histololgy of Female Reproductive System.pptx
Histololgy of Female Reproductive System.pptxHistololgy of Female Reproductive System.pptx
Histololgy of Female Reproductive System.pptx
 
Adhd Medication Shortage Uk - trinexpharmacy.com
Adhd Medication Shortage Uk - trinexpharmacy.comAdhd Medication Shortage Uk - trinexpharmacy.com
Adhd Medication Shortage Uk - trinexpharmacy.com
 
Cardiac Assessment for B.sc Nursing Student.pdf
Cardiac Assessment for B.sc Nursing Student.pdfCardiac Assessment for B.sc Nursing Student.pdf
Cardiac Assessment for B.sc Nursing Student.pdf
 

Analytical Method Development

  • 1. SPECIFICITY LINEARITY AND RANGE INTRODUCTION “A Guide to Analytical Method Validation” is a special project supplement produced by LCGC North America and edited by LCGC “Validation Viewpoint” co-editor Michael Swartz (Waters Corp.). Editorial contents copyright © Advanstar Communications. Design by Jim DiNolfo, Advanstar Communications. ©2006 Waters Corporation. Waters, ACQUITY UPLC, Ultra Performance LC, UPLC, eCord, Empower, BEH Technology, XBridge, Atlantis and SunFire are trademarks of Waters Corporation. 720001826EN REFERENCES DATA ELEMENTS REQUIRED FOR ASSAY VALIDATION PRECISION SYSTEM SUITABILITY ROBUSTNESS QUANTITATION LIMIT (QL OR LOQ) A Guide to Analytical Method Validation A New Milestone in Chromatography New benchmark for LC method development Seamless method transfer to ACQUITY UPLC™ technology Over 1,000% greater pH stability Available as 1.7 µm ACQUITY UPLC ™ BEH columns www.waters.com/xbridge Columns Designed, Tested and Certified for Ultra Performance LC™ (UPLC™ ) The first and only columns intended for use in UPLC™ Guaranteed compatible with up to 15000 psi/1000 bar applications Industry-leading particle synthesis, bonding and endcapping technologies for superior peak shapes, efficiencies and pH ranges eCord™ Technology for paperless column usage history and manufacturing information www.waters.com/acquity ACQUITY UPLC™ BEH Columns ACQUITY UPLC™ HSS Columns UPLC™ Particle Type Bridged Ethyl Hybrid (BEH) High Strength Silica (HSS) Bonding Chemistries C18 , C8 , Shield RP18 , Phenyl, HILIC T3 (C18 ) pH Range 1 to 12 2 to 8 Maximum Rated Pressure 15,000 psi (~1000 bar) 15,000 psi (~1000 bar) Particle Size 1.7 µm 1.8 µm Pore Diameter / Volume 130 Å / 0.7 mL/g 100 Å / 0.7 mL/g Surface Area 185 m2 /g 230 m2 /g New! New Atlantis® T3 Columns New industry standard for polar compound retention Improved low pH stability and peak shape Ultra-low MS bleed and aqueous compatible www.waters.com/atlantis The Performance Standard in Silica-Based HPLC Column Technology State-of-the-art reversed-phase C18 and C8 bonded silica High mass-loading capacity First choice for impurity profile and purification www.waters.com/sunfire Method validation is the process by which it is established, through laboratory studies, that the performance characteristics of the method meet the requirements for its intended purpose (1–5). It is a part of the overall validation process that also includes software validation (6), instrument qualification (7,8), and system suitability (9). Typical analytical characteristics used in method validation are highlighted in Figure 1. Although all analytical procedures or methods used in a regulated lab- oratory must be validated, this chart focuses specifically on liquid chromatography. Figure 1: Typical analytical characteristics used in method validation, commonly referred to as the “Eight Steps of Method Validation.” Figure 2: Example Effects Plot. Factor effects can be either positive or negative. The bar indicates the magnitude and the bias of the effect. The effect is the change in response due to the change of a factor. It is the average response at the high level minus the average response at the low level. There are both main effects (due to the change of a single fac- tor) and interaction effects (due to the change of more than one factor). Robustness is the capacity of a method to remain unaffected by small, deliberate variations in method parameters; a meas- ure of the reliability of a method. Robustness should be evaluated in late development, or early in the method validation process. If the results of a method or other measurements are susceptible to variations in method parameters, these parameters should be adequately controlled and a precautionary statement included in the method documentation. Robustness can be used to establish system suitability parameters. Normally, after implementing a validated method, it can be adjusted within the confines of the robustness study without triggering a revalidation. However, method changes, outside the range of parameters validated, would require at least some revalidation to show equivalency of results. Methodology Purposely vary method parameters over a known range, and determining the effect (if any) on the method results. Multivariate statistical experimental design can be used to control method variables (for example, Factorial, Fractional Factorial, or Plackett-Burman designs). Theoretical modeling software can also be used to predict robustness and then verified experimentally. Documentation Robustness can be illustrated by many different means, using summary tables, bar, and control charts, effect and probability plots, and other means of result comparisons. Table I: Example robustness factor selection and limits for an isocratic LC method. These limits are examples only and should be chosen according to expected laboratory and instrument variations. Factor Limit Range (/) Organic Solvent Concentration 2–3% Buffer Concentration 1–2% Buffer pH (if adjusted) 0.1-0.2 pH units Temperature 3°C Flow rate 0.1-0.2 mL/min. Wavelength 2–3 nm for 5 nm bandwidth Injection Volume Injection type and size dependant Table III: Data elements required for validation. Analytical Category 1 Category 2 Category 2 Category 3 Category 4 Performance Quantitative Limit Tests Characteristics Accuracy Yes Yes * * No Precision Yes Yes No Yes No Specificity Yes Yes Yes * Yes Detection Limit No No Yes * No Quantitation Limit No Yes No * No Linearity Yes Yes No * No Range Yes Yes * * No * May be required depending on the nature of the test. Table II: Example robustness factor selection and limits for a gradient LC method. Factors and limits listed here are in addition to many of the factors considered in an isocratic method. *It is increasingly common for gradient methods to have an initial hold time to accommodate transfer to instruments with different dwell volumes. Factor Limit Range (/) Initial hold time* 10–20% of segment time Slope and length The slope is set by the initial %B and the final %B, as well as the gradient length. It is recommended to adjust the lengths by 10–20% and allow the slope to vary. Final hold time Adjusted according to the last eluting compound and varied accordingly Specificity is the ability to measure accurately and specifically the analyte of interest in the presence of other components that may be expected to be present in the sample matrix. Identification tests Specificity ensures the identity of the analyte of interest. Purity tests Specificity ensures that the method allows for an accurate statement of the impurity content (that is, in related substances tests, heavy metals and organic volatile impurity limits) Assays Specificity provides an exact result for a determination of the content or potency of the analyte. Methodology Identification (qualitative analyses) Specificity is demonstrated by the ability to discriminate between compounds of closely related structures, or by comparison to known reference materials. Assays Specificity is demonstrated using spiked samples to show that the method results are unaffected by the presence of impurities or excipients. Impurity tests Impurities available Specificity is demonstrated by spiking the drug substance or product with the appropriate levels of impurities and determining them with the appropriate accuracy and precision. Impurities not available Compare results to a second well-characterized procedure. Include samples stored under relevant stress conditions, (for example, light, heat, humidity, acid/base hydrolysis, and oxidation). For assay, the two results are compared. For impurity tests, the impurity profiles are compared head- to-head. Documentation For chromatographic procedures, representative chromatograms with peaks labeled should be included. Resolution, plate count (efficiency), and tailing factor should be measured and documented. Peak purity tests using advanced detection such as photodiode array or mass spectrometry should be used to show that the response is not due to more than one component. Linearity The ability of the method to elicit test results that are directly, or by a well-defined mathematical transformation, proportional to analyte concentration within a given range. Range The interval between the upper and lower levels of analyte (inclusive) that have been demonstrated to be determined with a suitable level of precision, accuracy, and linearity using the method as written. Methodology Linearity Demonstrate across the entire range of the analytical procedure. A minimum of five concentrations is recommended. Range Verify that the method provides acceptable precision, accuracy, and linearity when applied to samples at the extreme as well as within the range. Recommended minimum Ranges: Assay of Drug Substance or Finished Product From 80–120% of the test concentration. Determination of an Impurity From 50–120% of the specification. Content Uniformity A minimum of 70–130% of the test con centration unless a wider or more appropriate range is justified based upon the dosage form. Dissolution Testing / 20% over the specified range of the dissolution test. Documentation The report should include: The slope of the regression line. The correlation coefficient. y-intercept. The residual sum of squares. Figure 3: Chromatography data system linearity plot, showing y-intercept, slope, and coefficient of determina- tion, and residual plot. Each residual is an estimate of the error in the data and displays how far the data points fall from the regression line. Each residual is the difference between the observed (or actual) response and the response of the regression line. Characteristic of limit tests, the LOD is defined as the lowest concentration of an analyte in a sample that can be detected, not quantitated. It is a limit test that specifies whether or not an analyte is above or below a certain value. Methodology Noninstrumental methods Determine LOD by analyzing samples at known concentrations and establishing the minimum level at which the analyte can be reliably detected. Instrumental methods LOD can be determined as a signal to noise ratio, usually 2:1 or 3:1, Or, LOD can be calculated at levels approximating the LOD according to the formula: LOD 3.3(SD/S) (SD) standard deviation of the response based on either the standard deviation of the blank, the residual standard deviation of the regression line, or the standard deviation of y-intercepts of regression lines. (S) slope of the calibration curve Documentation Express the LOD as the concentration of the analyte. Document and support the method used to determine LOD. An appropriate number of samples should be analyzed at the limit to validate the level. In practice, it is almost never necessary to determine the actual LOD. Instead, the detection limit is shown to be sufficiently low (for example, 0.1%) to be able to reliably detect at the level specified. LOQ is the lowest concentration of an analyte in a sam- ple that can be determined (quantitated) with acceptable precision and accuracy under the stated operational con- ditions of the method. Methodology Noninstrumental methods Determine LOQ by analyzing samples at known concentrations and establishing the minimum level at which the analyte can be reliably detected. Instrumental methods LOQ can be determined as a signal to noise ratio, usually 10:1, Or, LOD can be calculated at levels approximating the LOD according to the formula: LOD 10(SD/S). (SD) standard deviation of the response based on either the standard deviation of the blank, the residual standard deviation of the regression line, or the standard deviation of y-intercepts of regression lines. (S) slope of the calibration curve Documentation Express LOQ as a concentration, with the precision and accuracy of the measurement. Documented and support the method used to determine LOD. An appropriate number of samples should be analyzed at the limit to validate the level. In practice, it is almost never necessary to determine the actual LOQ. Instead, LOQ is shown to be sufficiently low (e.g. 0.1%) to be able to reliable quantitate at the level specified. Figure 4: Column efficiency and peak shape can affect the signal to noise ratio significantly. These chro- matograms were obtained under identical conditions on two different manufacturers’ C18 columns and shows nearly a two-fold difference, something that must be taken into account if the validation protocol calls for an LOD or LOQ determination. DETECTION LIMIT (DL OR LOD) ACCURACY Accuracy is the closeness of test results to the true value. Methodology Drug substance Comparison of the results with the analy- sis of a standard reference material. Comparison to a second, well-character- ized method. Drug product Evaluate by analyzing synthetic mixtures of known amounts or samples spiked with known quantities of components. Comparison to a second, well-character- ized method. Quantitation of impurities Analyze samples (drug substance or drug product) spiked with known amounts of impurities. (If impurities are not available, see specificity.) Data from a minimum of nine determinations over a minimum of three concentration levels covering the specified range (for example, three concentrations, three replicates of each concentration). Documentation Reported as the percent recovery of the known, added amount, or as the difference between the mean and true value with confidence intervals. Precision is the degree of agreement among individual test results when an analytical method is used repeatedly to multiple samplings of a homogeneous sample. Repeatability Results of the method operating over a short time interval under the same conditions (interassay precision). Generally the criteria of concern in USP procedures. Intermediate precision (formerly ruggedness) Results from within-laboratory variations due to random events such as different days, analysts, equipment, etc. Experimental design should be employed so that the effects (if any) of the individual variables can be monitored. Reproducibility Results of collaborative studies between laboratories. Methodology The precision of a method is determined by assaying aliquots of a homogeneous sample to be able to calculate statisti cally significant estimates of standard deviation or relative standard deviation (coefficient of variation). Assays should be of samples that have all gone through the entire analytical procedure from sample preparation through final analysis. A minimum of nine determinations covering the specified range of the procedure (for example, three levels, three repetitions each) or a minimum of six determinations at 100% of the test or target concentration is recommended. Documentation Precision is expressed as the standard deviation or the relative standard deviation (coefficient of variation) for a statisti cally significant number of measurements and confidence interval. Statistical tables, bar charts, and other types of graphs are commonly used to document precision. Figure 5: An example of a chromatography data system Whisker Plot, a common way of documenting precision and accuracy. The box represents the upper and lower confidence intervals, the whiskers with up-tics and down-tics represent the user-defined upper and lower acceptance criteria. The small points are the individual data points of % Recovery (at each concentration level); the large points are the mean % recovery at each concentration level. System suitability is the checking of a system to ensure system performance before or during the analysis of unknowns. System suitability tests are an integral part of chromatographic methods, and are used to verify that the resolution and reproducibility of the system are adequate for the analysis to be performed. System suitability tests are based on the concept that the equipment, electronics, analytical operations, and samples constitute an integral system that can be evaluated as a whole. System suitability parameters are established as a direct result of robustness studies. Methodology Plate count (N), tailing factor (T), resolution (Rs) and reproducibility (%RSD) are determined from replicate injections of a standard (an analyte peak and an internal standard, related compound, excipient, and/or impurity, etc.) compared against method specifications. If the %RSD specification is below 2.0%, five replicates are used. If the %RSD specification above 2.0%, six replicates are used. System suitability must be demonstrated at appropriate intervals before, during, and after the analysis of unknown samples, or whenever there is a significant change in instrumentation, or in a critical reagent. Documentation Documentation of system suitability is accomplished by summarizing data on reproducibility, efficiency, tailing and resolution for the replicate injections. Results can also be used to troubleshoot the method. Results stored in a relational database can be compared and summarized on a peak-by-peak or system-by-system basis to provide additional feedback necessary to determine system performance. No sample analysis is acceptable unless system suitability specifications have been met. Analytical methods are used for many different purposes, and different test meth- ods require different validation schemes. Analytical Test Methods can be divided into four categories, and for each assay category, different information is needed (Table III). Category 1: Analytical methods for the quantitation of major components of bulk drug substances or active ingredients in finished pharmaceutical products. Category 2: Analytical methods for the determination of impurities in bulk drug substances or degradation compounds in finished pharmaceutical products, including quantitative assays and limit tests. Category 3: Analytical methods for the determination of performance characteris- tics (for example, dissolution, drug release). Category 4: Identification tests. (1) The United States Pharmacopeia 29 / National Formulary 24 (The United States Pharmacopeia Convention, Inc., Rockville, MD, 2006), Chapter 1225, including Supplement 1, Official April 2006. (2) International Conference on Harmonization, Harmonized Tripartite Guideline, Validation of Analytical Procedures, Text and Methodology, Q2(R1), November 2005, See www.ICH.org. (3) Draft Guidance for Industry: Analytical Procedures and Methods Validation. U.S. Department of Health and Human Services, Food and Drug Administration, Center for Drug Evaluation and Research, Center for Biologics Division of Research, Rockville, MD, August 2000). (4) Analytical Procedures and Method Validation: Highlights of the FDA’s Draft Guidance. LCGC 19(1), 74–79 (2001). (5) Swartz, M.E. and Krull, I.S., Handbook of Analytical Method Validation, Taylor and Francis, 2006, in press. (6) General principles of software validation; final guidance for industry and FDA staff. U.S. Department of Health and Human Services, Food and Drug Administration, Center for Drug Evaluation and Research, Center for Biologics Division of Research, Rockville, MD, January 2002. (7) AAPS PharmSciTech 2004, 5(1) Article 22 (http://www.aapspharmscitech.org). (8) Pharmacopeial Forum, 31(5), Sept-Oct 2005, p. 1453-1463. (9) The United States Pharmacopeia 26 / National Formulary 21 (The United States Pharmacopoeia Convention, Inc., Rockville, MD, 2002), Chapter 621.