Download to read offline


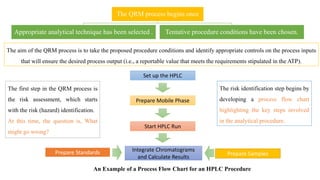
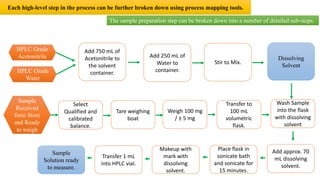
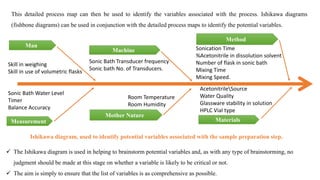
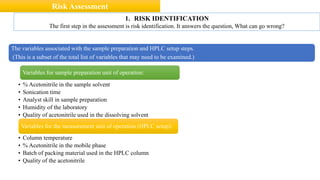
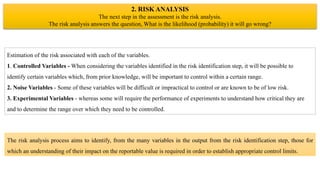
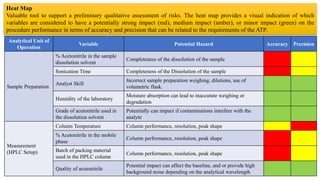
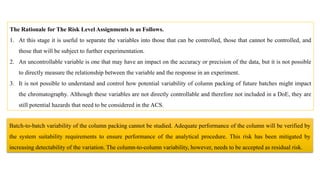
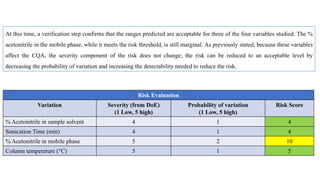
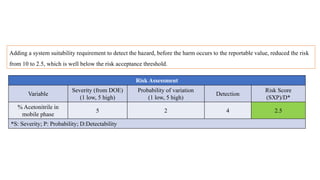
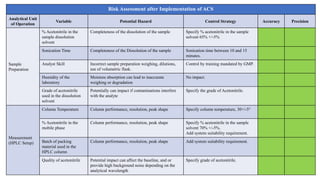
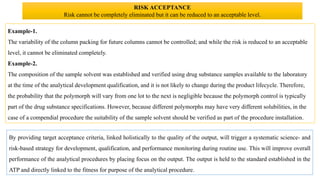


This document outlines the application of a lifecycle model to analytical procedures, emphasizing the importance of a Quality Risk Management (QRM) process that starts with risk identification and analysis. It details the steps involved in sample preparation, risk evaluation of variables impacting analytical outcomes, and the implementation of controls to mitigate identified risks. The goal is to establish acceptable risk thresholds and ensure the reliability and accuracy of analytical results in compliance with defined performance standards.