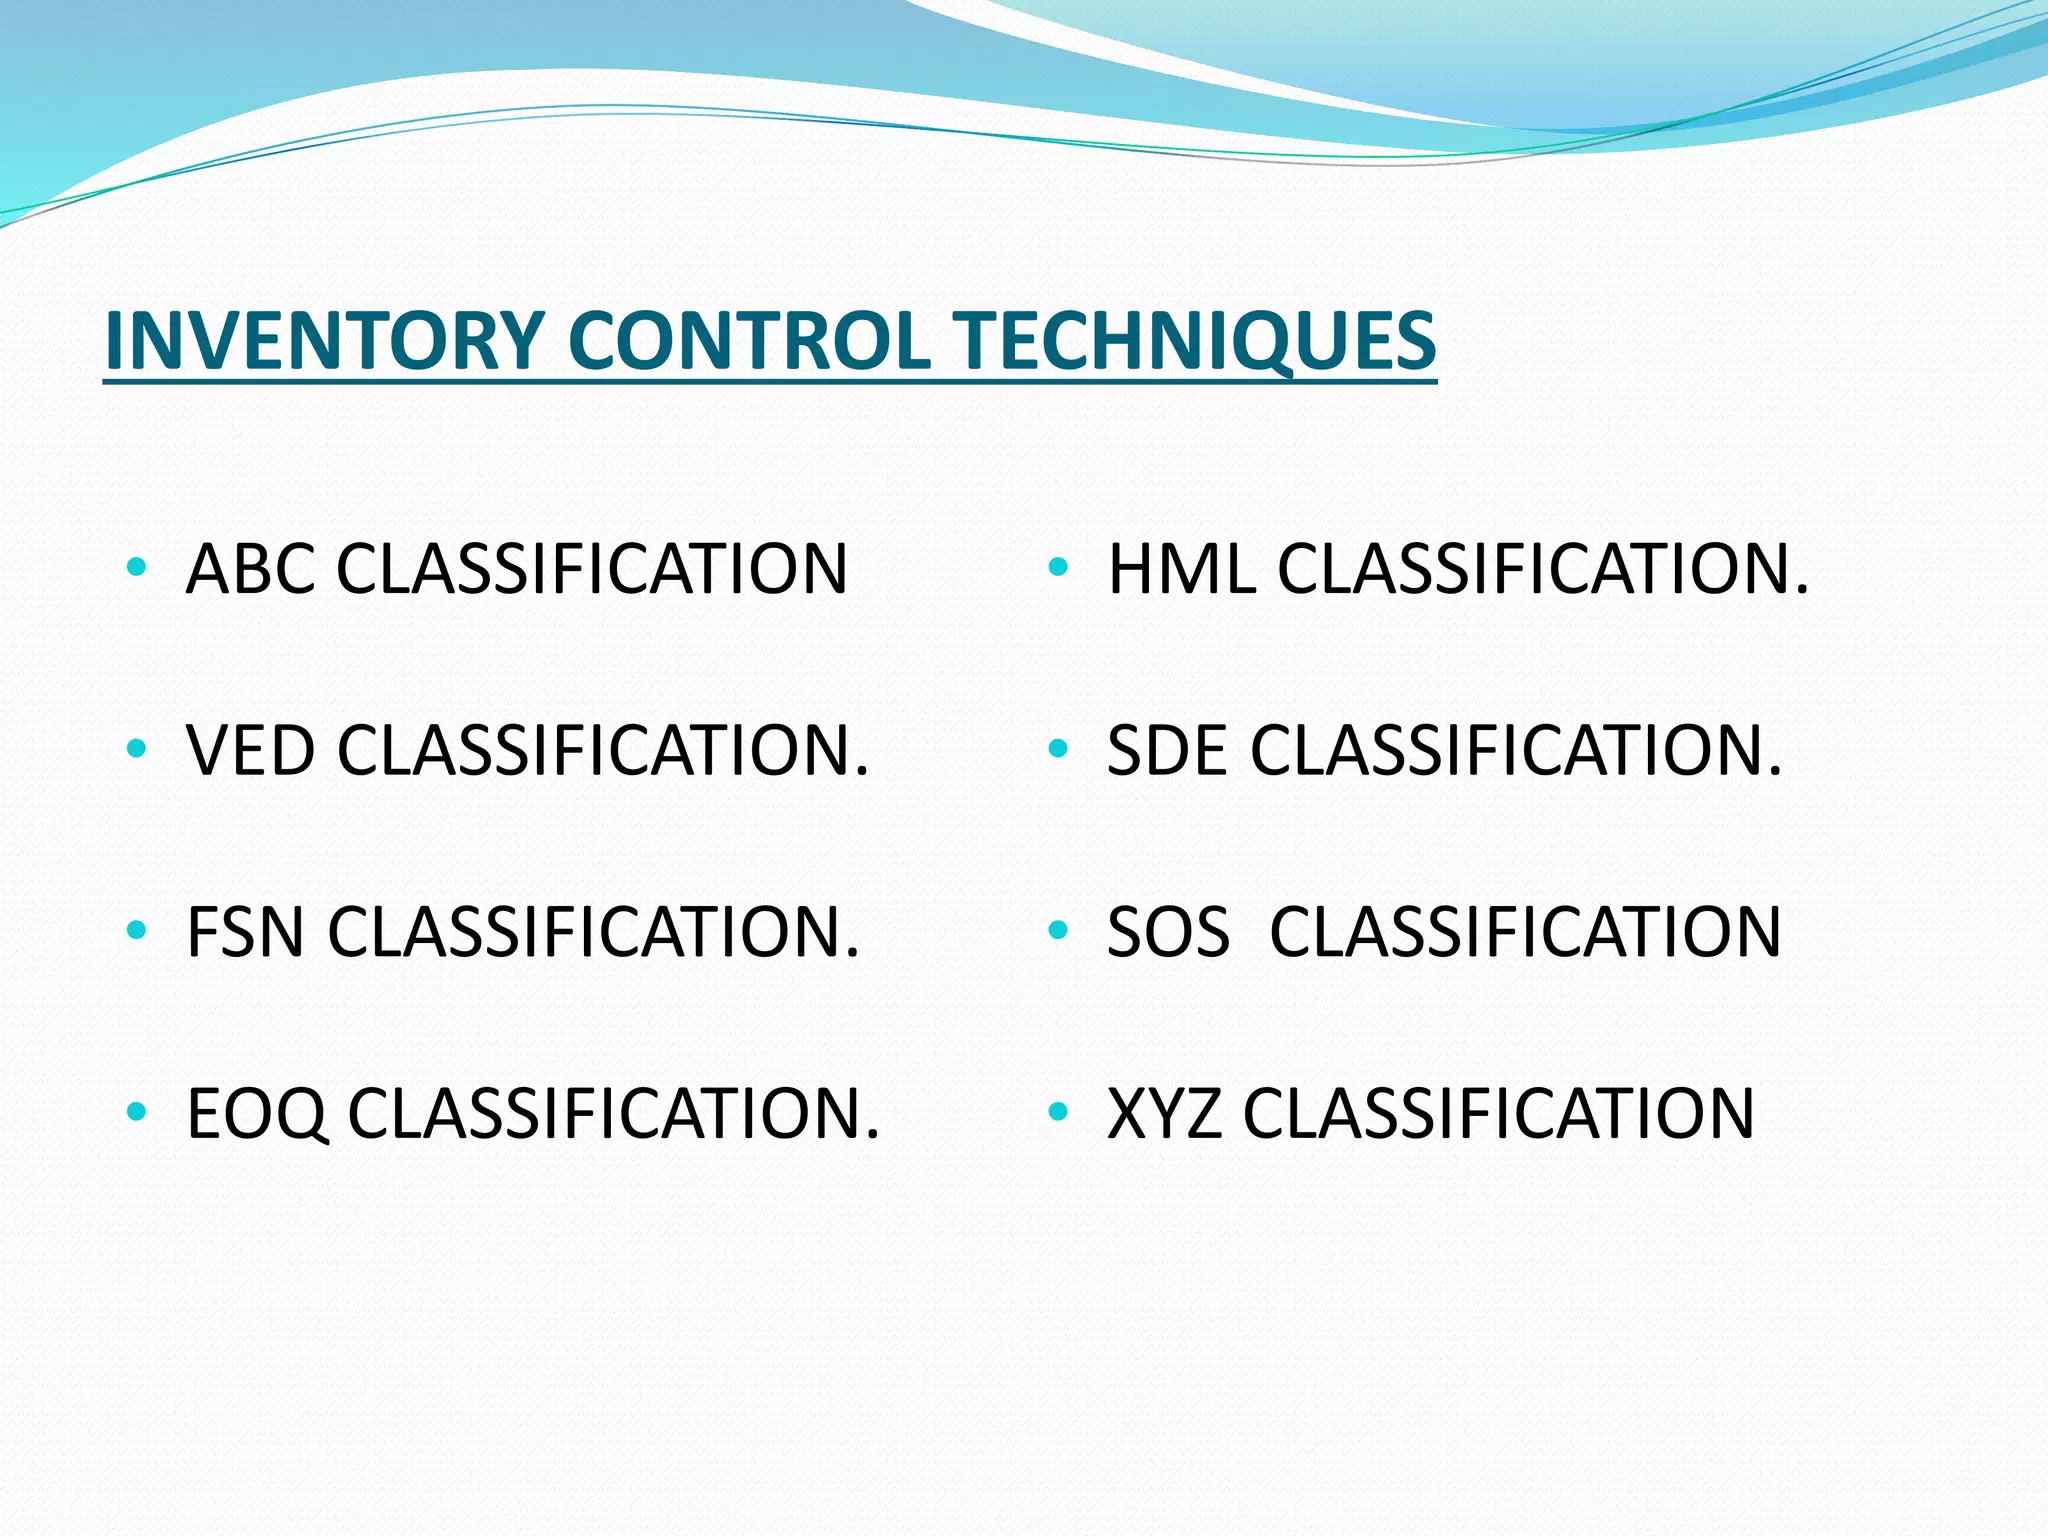
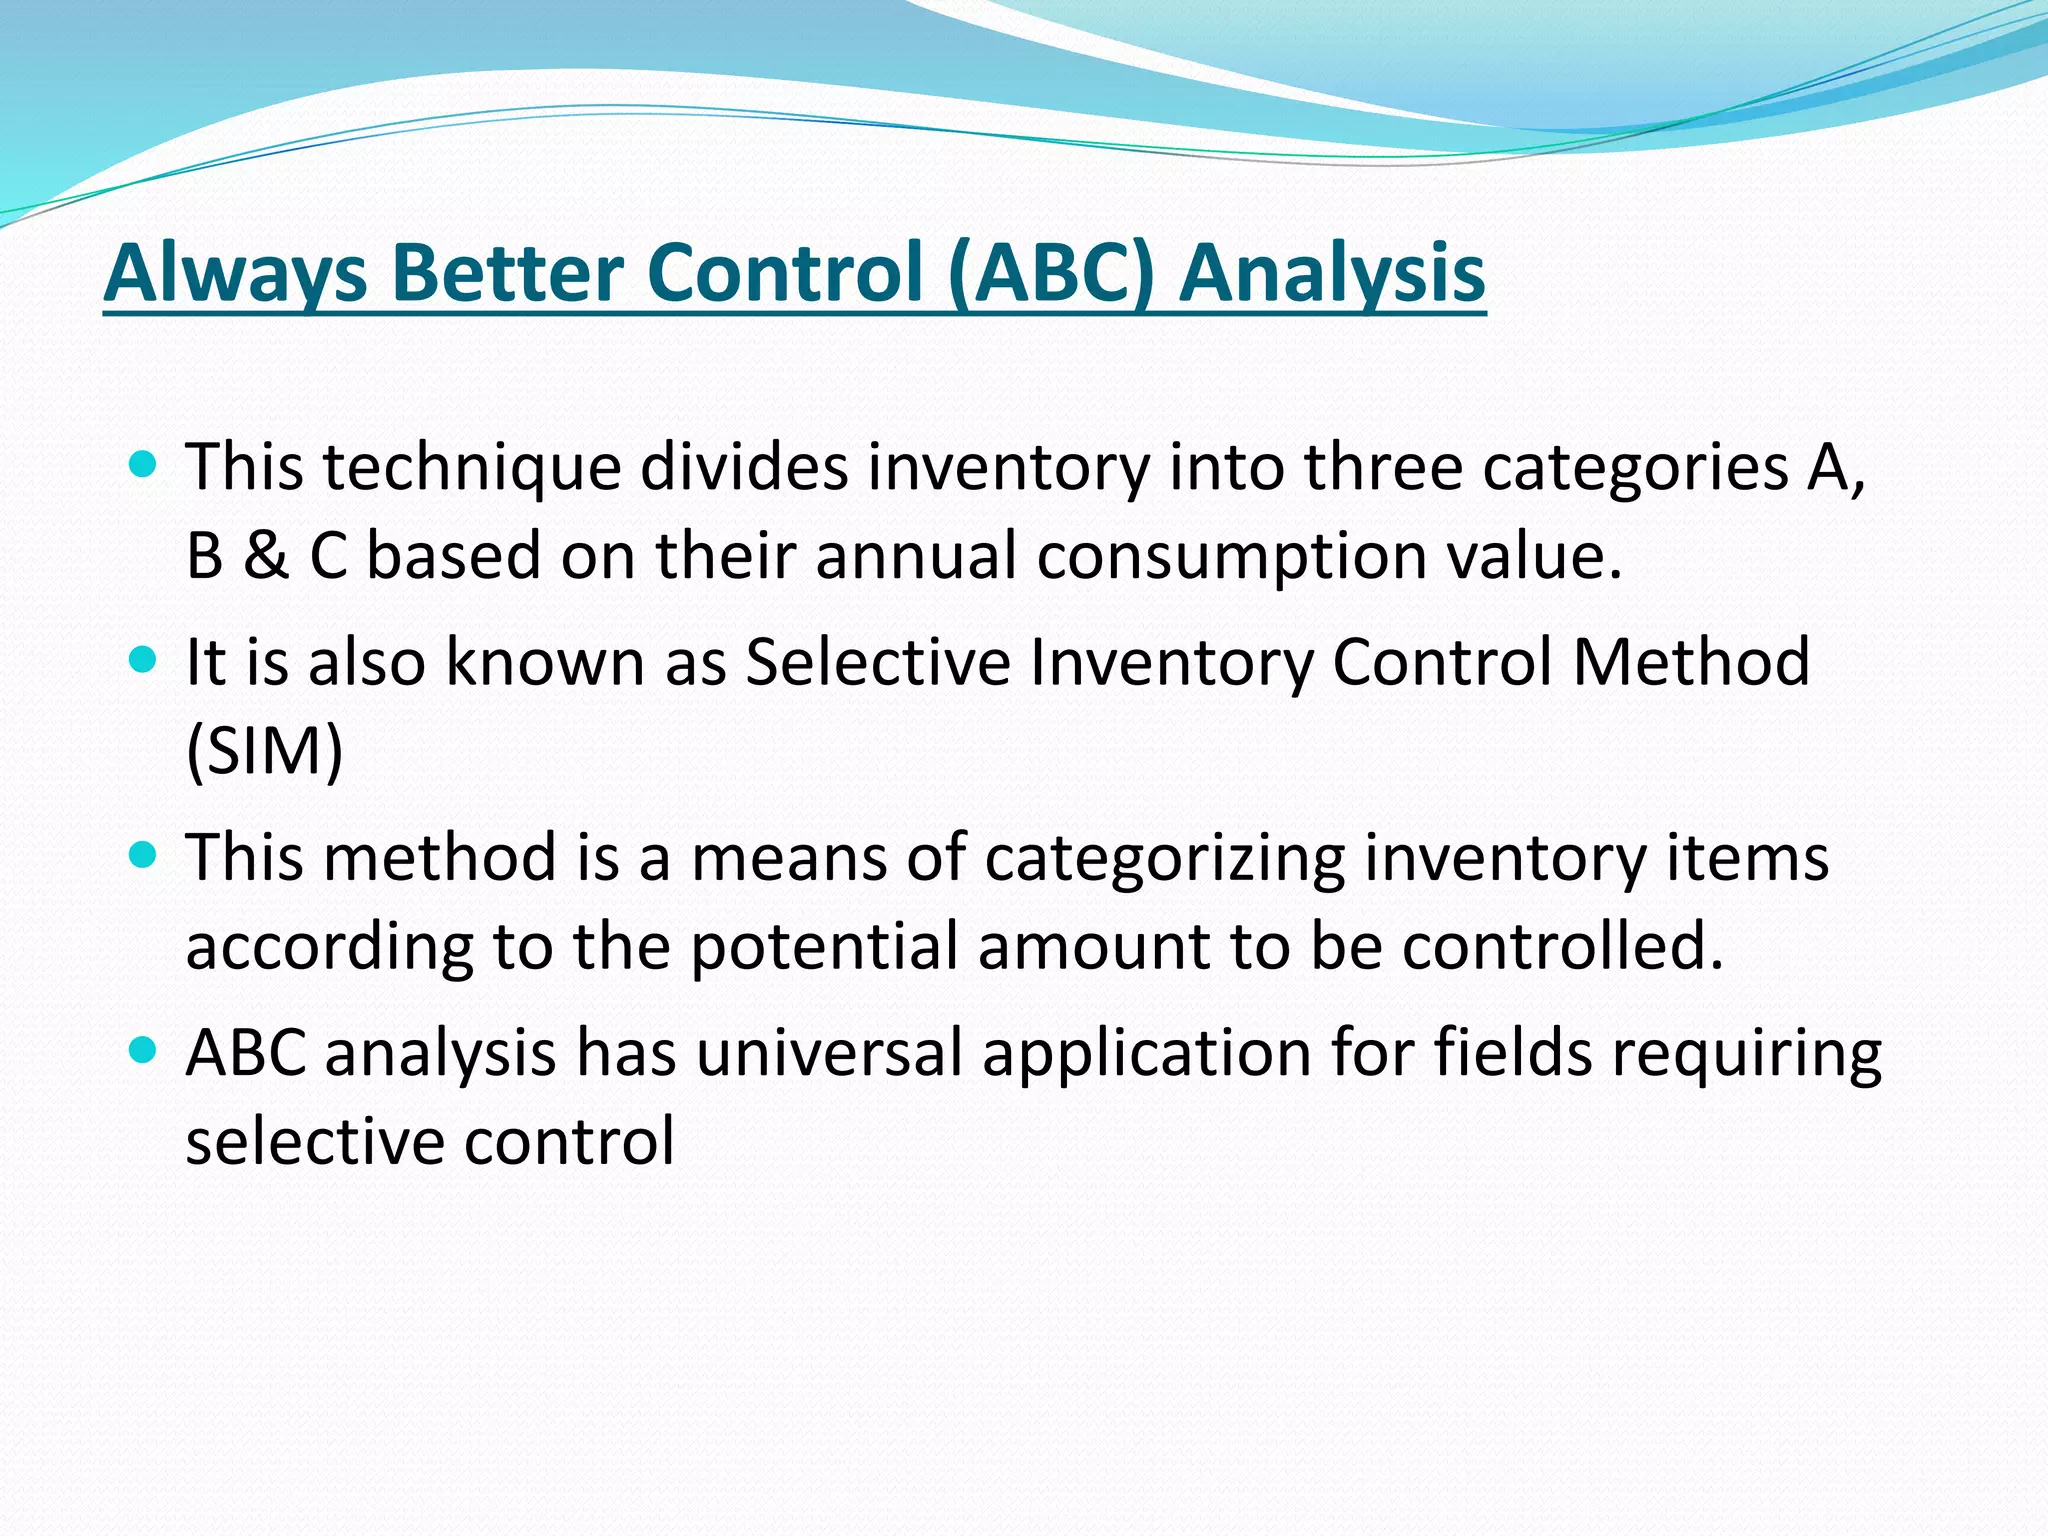
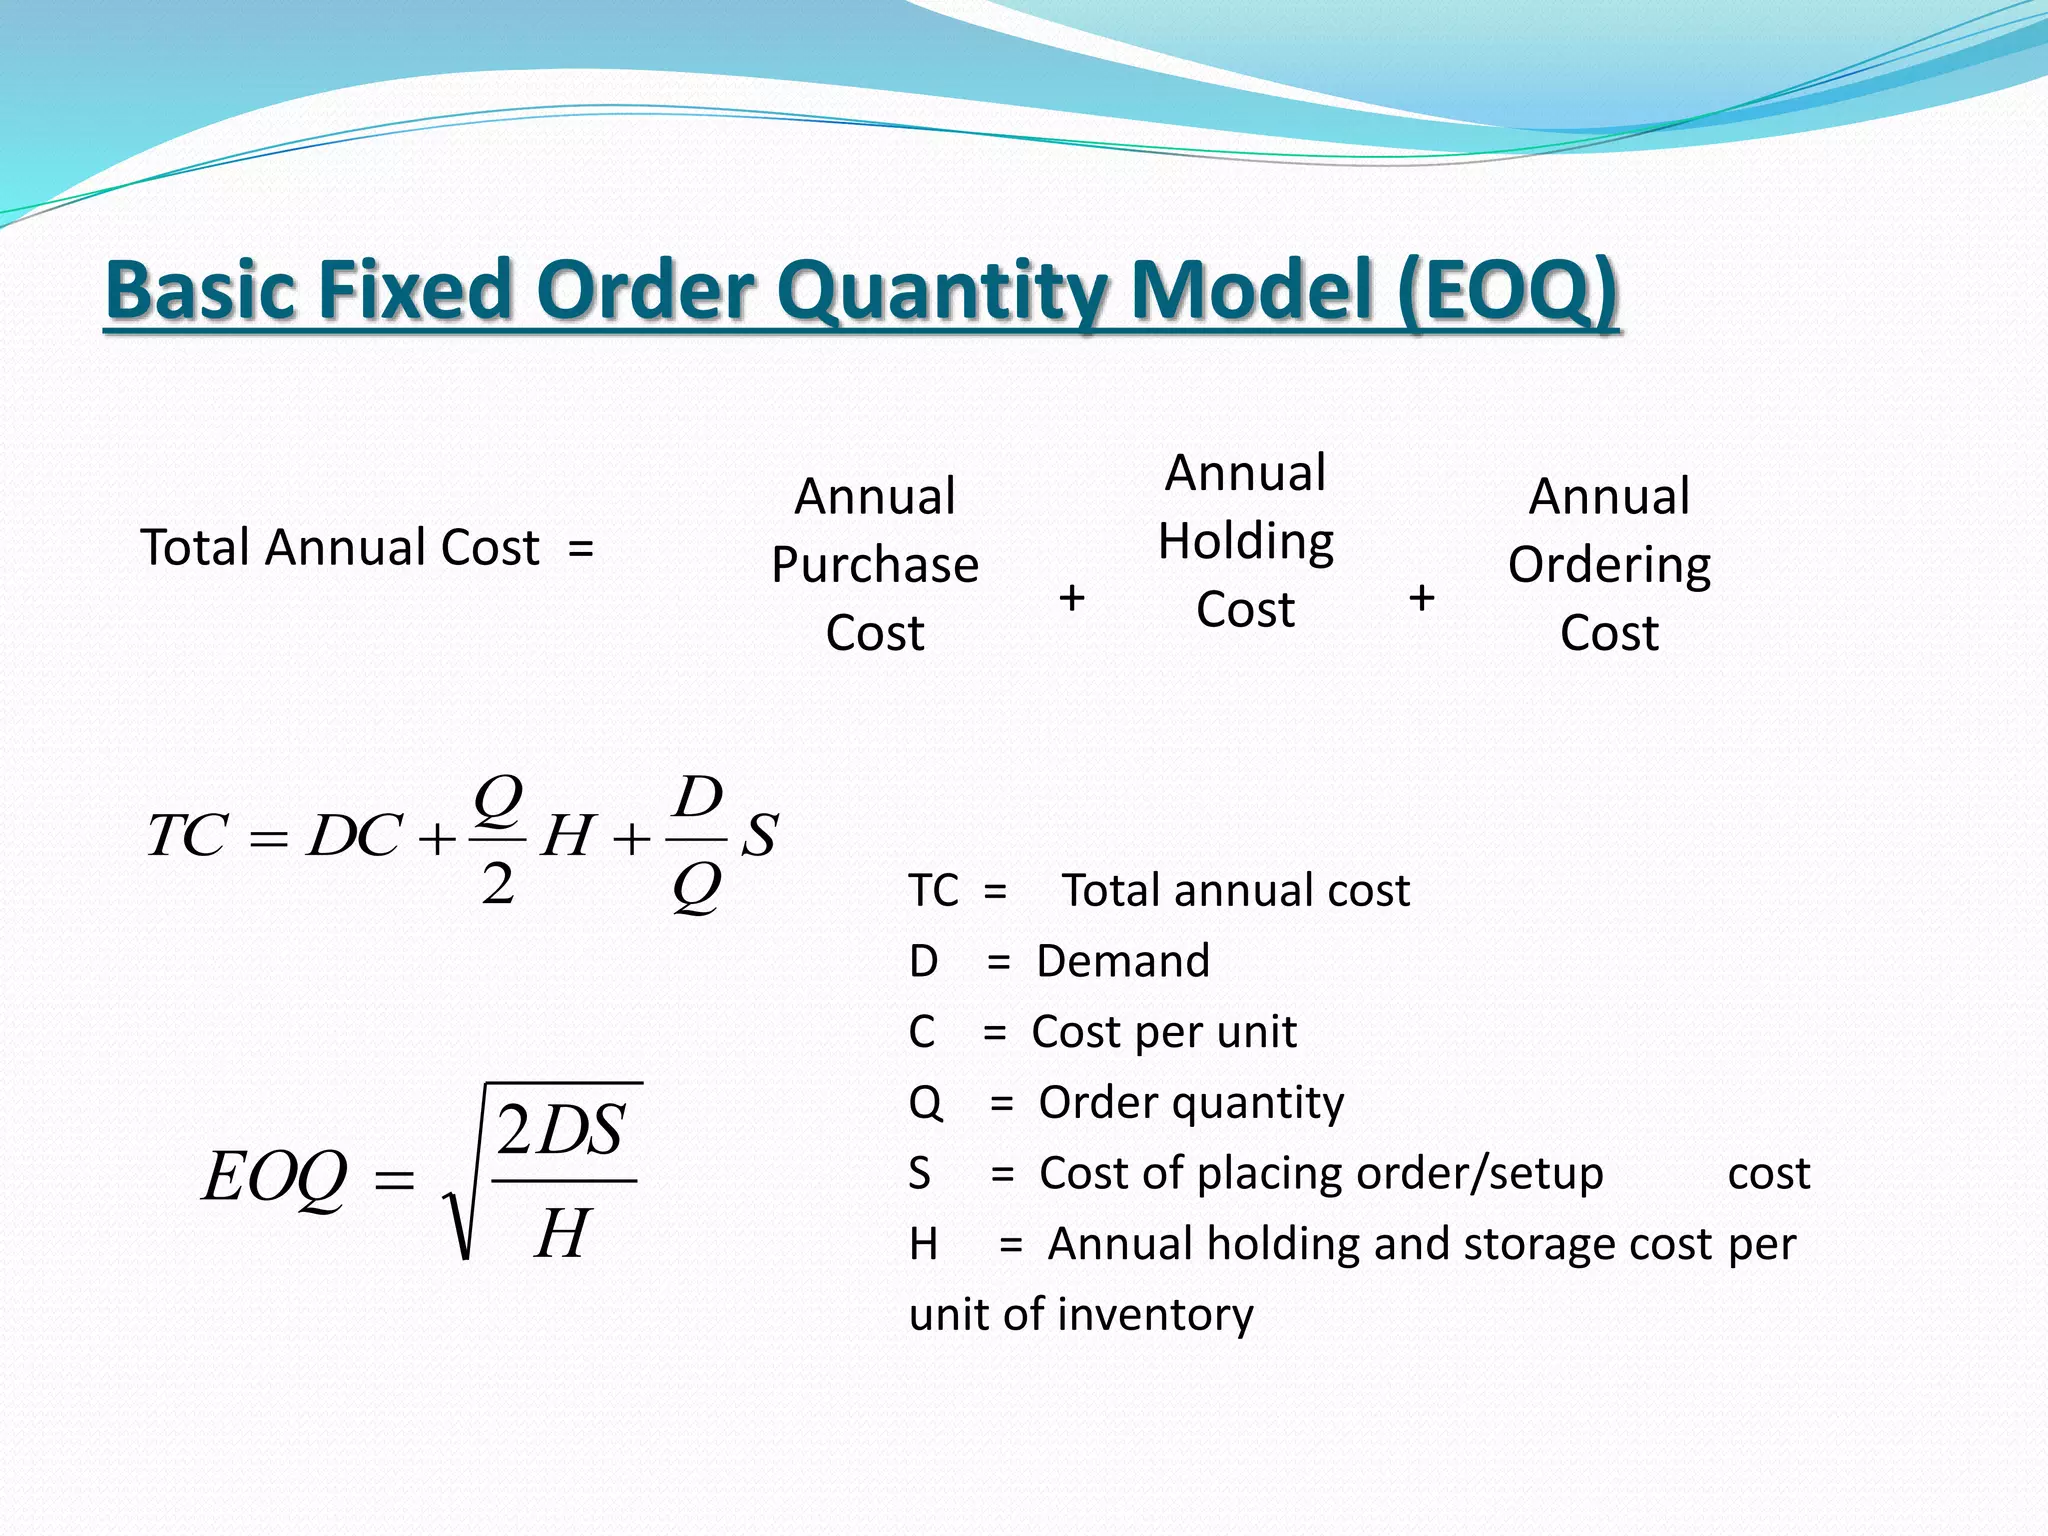
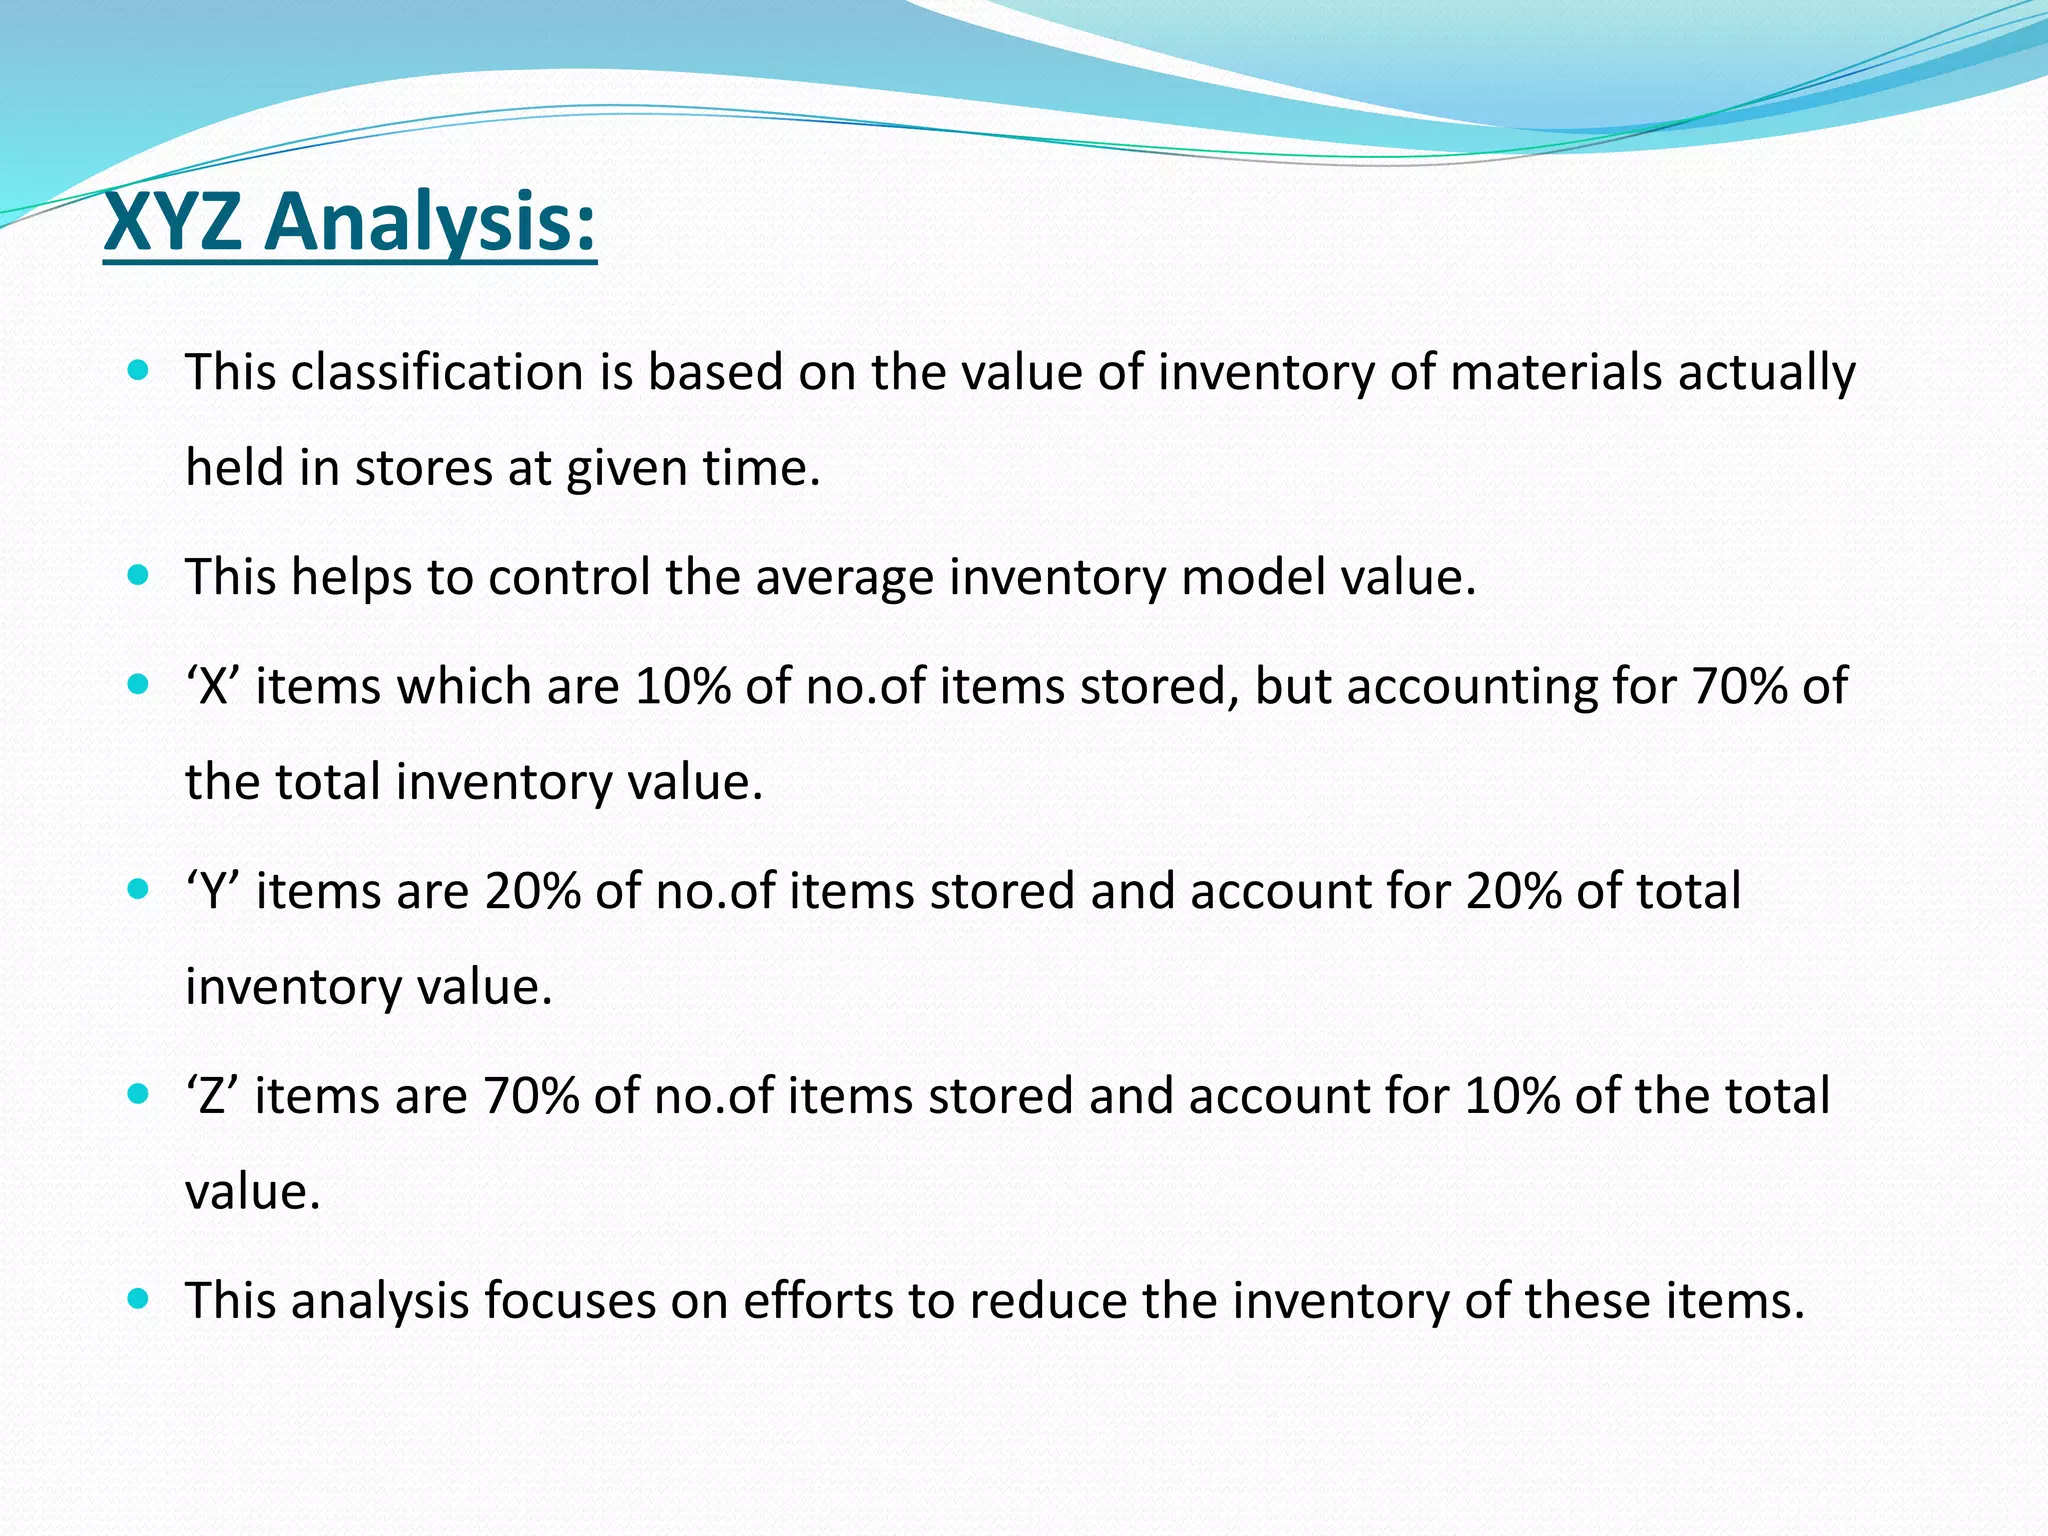
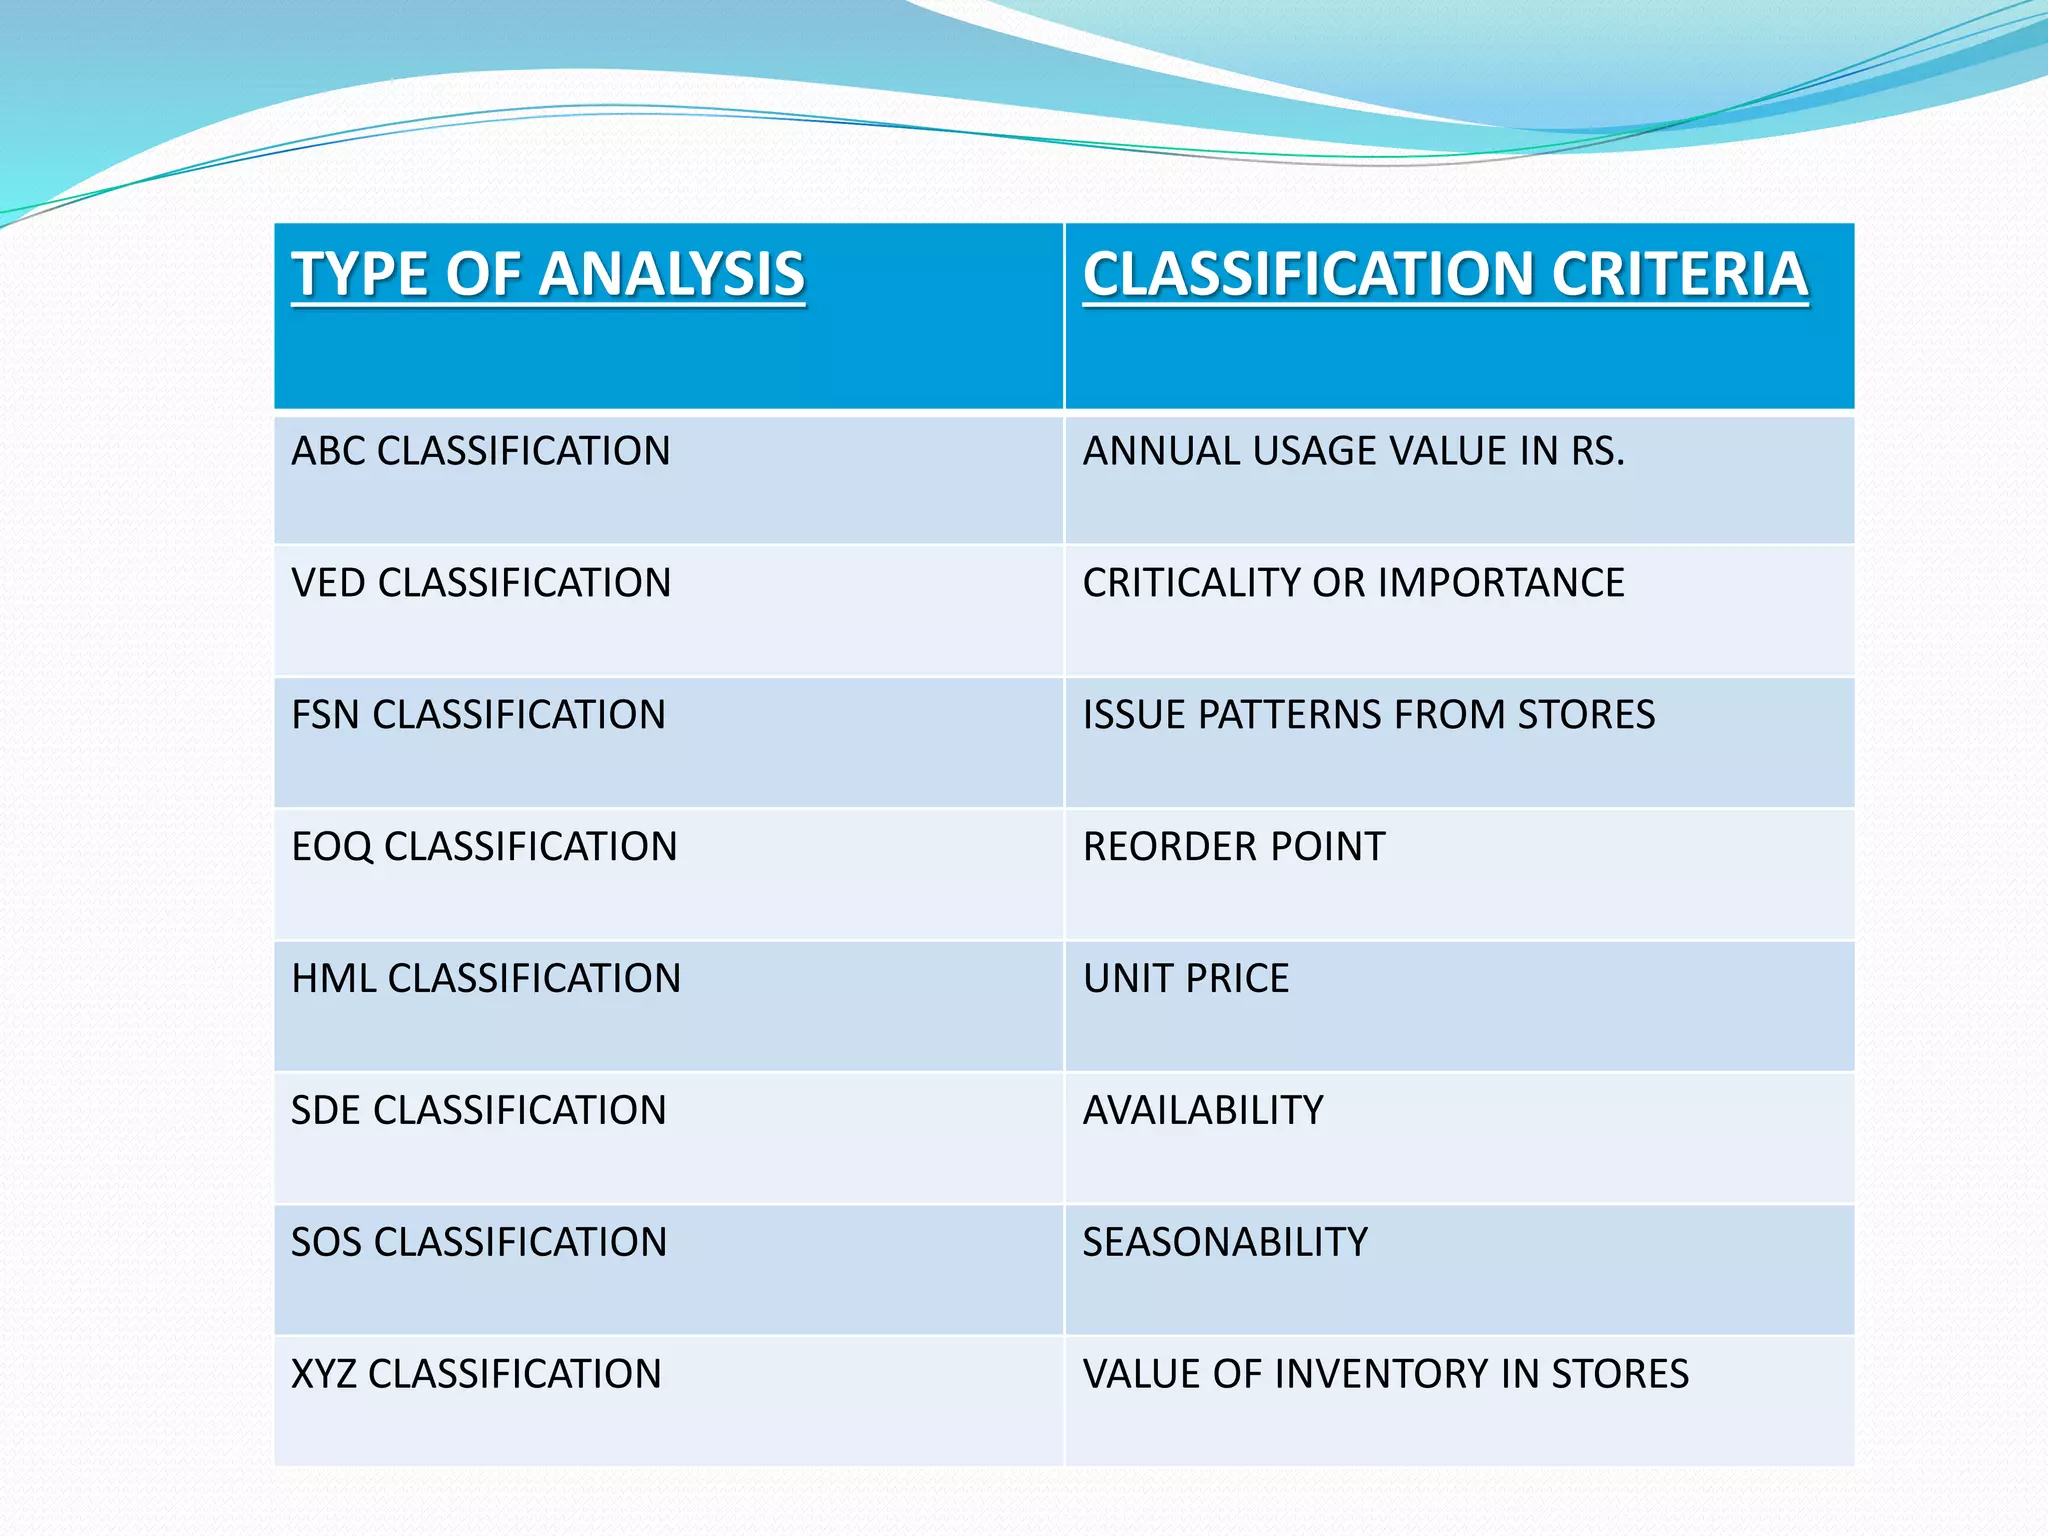
Presented By:
Sameer Chaudhari
Roll No: M3166014
INTRODUCTION
 The term inventory means the value or amount of
materials or resource on hand. It includes raw material,
work-in-process, finished goods & stores & spares.
 Inventory control is the technique of maintaining the size
of the inventory at some desired level keeping in view the
best economic interest of an organization.
 Inventory is measured and regulated according to
predetermined norms such as economic lot size for order
or production, safety stock, minimum level, maximum
level, order level etc.
OBJECTIVES
 Protection against fluctuations in output;
 Better use of men, machines and material;
 Protection against fluctuations in supply;
 Control of stock volume;
 Control of stock distribution
INVENTORY CONTROL TECHNIQUES
• ABC CLASSIFICATION
• VED CLASSIFICATION.
• FSN CLASSIFICATION.
• EOQ CLASSIFICATION.
• HML CLASSIFICATION.
• SDE CLASSIFICATION.
• SOS CLASSIFICATION
• XYZ CLASSIFICATION
Always Better Control (ABC) Analysis
 This technique divides inventory into three categories A,
B & C based on their annual consumption value.
 It is also known as Selective Inventory Control Method
(SIM)
 This method is a means of categorizing inventory items
according to the potential amount to be controlled.
 ABC analysis has universal application for fields requiring
selective control
Procedure for ABC Analysis
 Make the list of all items of inventory.
 Determine the annual volume of usage & money value of
each item.
 Multiply each item’s annual volume by its rupee value.
 Compute each item’s percentage of the total inventory in
terms of annual usage in rupees.
 Select the top 10% of all items which have the highest
rupee percentages & classify them as “A” items.
 Select the next 20% of all items with the next highest
rupee percentages & designate them “B” items.
 The next 70% of all items with the lowest rupee
percentages are “C” items.
VED Classification
 VED: Vital, Essential & Desirable classification
 VED classification is based on the criticality of the inventories.
 Vital items – Its shortage may cause havoc & stop the work in
organization. They are stocked adequately to ensure smooth
operation.
 Essential items - Here, reasonable risk can be taken. If not
available, the plant does not stop; but the efficiency of
operations is adversely affected due to expediting expenses.
They should be sufficiently stocked to ensure regular flow of
work.
 Desirable items – Its non availability does not stop the work
because they can be easily purchased from the market as &
when needed. They may be stocked very low or not stocked.
Category “V” items “E” items “D” items
“A” items Constant control &
regular follow up
Moderate stocks Nil stocks
“B” items Moderate stocks Moderate stocks Low stocks
“C” items High stocks Moderate stocks Very low stocks
 It is useful in capital intensive industries, transport industries,
etc.
VED analysis can be better used with ABC analysis in the
following pattern:
FSN Analysis
 FSN: Fast moving, slow moving & non moving
 Classification is based on the pattern of issues from stores
& is useful in controlling obsolescence.
 Date of receipt or last date of issue, whichever is later, is
taken to determine the no. of months which have lapsed
since the last transaction.
 The items are usually grouped in periods of 12 months.
 It helps to avoid investments in non moving or slow
items. It is also useful in facilitating timely control.
 For analysis, the issues of items in past two or three years
are considered.
 If there are no issues of an item during the period, it is
“N” item.
 Then up to certain limit, say 10-15 issues in the period,
the item is “S” item
 The items exceeding such limit of no. of issues during the
period are “F” items.
 The period of consideration & the limiting number of
issues vary from organization to organization.
Economic Order Quantity (EOQ)
 EOQ or Fixed Order Quantity system is the technique of
ordering materials whenever stock reaches the reorder
point.
 Economic order quality deals when the cost of
procurement(ordering) and handling of inventory are at
optimum level and total cost is minimum.
 In this technique, the order quantity is larger than a
single period’s requirement so that ordering costs &
holding costs balance out.
Tc (Total Cost)
Cost(Rs.)
Order Quantity Size (Q)
EOQ
Carrying Cost
(Q/2)H
DS/Q (Ordering Cost)
Assumptions of EOQ
 Demand for the product is constant
 Lead time is constant
 Price per unit is constant
 Inventory carrying cost is based on average inventory
 Ordering costs are constant per order
Basic Fixed Order Quantity Model (EOQ)
Total Annual Cost =
Annual
Purchase
Cost
Annual
Ordering
Cost
+ +
Annual
Holding
Cost
S
Q
D
H
Q
DCTC 
2
H
DS
EOQ
2

TC = Total annual cost
D = Demand
C = Cost per unit
Q = Order quantity
S = Cost of placing order/setup cost
H = Annual holding and storage cost per
unit of inventory
High Medium Low(HML):
 The HML classification is same procedure as adopted in ABC.
 The core difference is, for HML classification; unit value is the
criterion and not the annual consumption value.
 The inventories should be place in descending order and it is up
to mgmt to fix limits of these three categories.
 Example: the mgmt may decide all units of items with unit value
of Rs 2,000 and above will be H items; between Rs. 2000-1000
will be M items & those below Rs. 1000 will be L items.
SDE Classification:
 The SDE is based upon the availability of items.
 Here ‘S’ refers to ‘Scarce’ items
 ‘D’ refers to ‘Difficult’ items
 ‘E’ refers to ‘Easy to acquire’
 This is based on problems faced in procurement, where
some strategies are made on purchasing.
SOS Analysis:
 ‘S’ stands for Seasonal items and ‘OS’- Off Seasonal items.
 In general it is merit to seller to buy seasonal items at lower
price and keep inventory and sell them at high price during Off
seasons.
 If not the seller has to buy the goods at higher prices during
Off seasons.
 Decisions are taken based on the fluctuations and availability.
XYZ Analysis:
 This classification is based on the value of inventory of materials actually
held in stores at given time.
 This helps to control the average inventory model value.
 ‘X’ items which are 10% of no.of items stored, but accounting for 70% of
the total inventory value.
 ‘Y’ items are 20% of no.of items stored and account for 20% of total
inventory value.
 ‘Z’ items are 70% of no.of items stored and account for 10% of the total
value.
 This analysis focuses on efforts to reduce the inventory of these items.
TYPE OF ANALYSIS CLASSIFICATION CRITERIA
ABC CLASSIFICATION ANNUAL USAGE VALUE IN RS.
VED CLASSIFICATION CRITICALITY OR IMPORTANCE
FSN CLASSIFICATION ISSUE PATTERNS FROM STORES
EOQ CLASSIFICATION REORDER POINT
HML CLASSIFICATION UNIT PRICE
SDE CLASSIFICATION AVAILABILITY
SOS CLASSIFICATION SEASONABILITY
XYZ CLASSIFICATION VALUE OF INVENTORY IN STORES
REFERENCES
 International Journal of Scientific and Research
Publications, Volume 3, “ANALYSIS OF INVETORY
CONTROL TECHNIQUES”, by:-Tom Jose V, Akhilesh
Jayakumar, Sijo M T
 Textbook of “METROLOGY & QUALITY CONTROL”;
Author: Er. N. K. Patil
THANK YOU

Analysis of invetory control techniques

  • 1.
  • 2.
    INTRODUCTION  The terminventory means the value or amount of materials or resource on hand. It includes raw material, work-in-process, finished goods & stores & spares.  Inventory control is the technique of maintaining the size of the inventory at some desired level keeping in view the best economic interest of an organization.  Inventory is measured and regulated according to predetermined norms such as economic lot size for order or production, safety stock, minimum level, maximum level, order level etc.
  • 3.
    OBJECTIVES  Protection againstfluctuations in output;  Better use of men, machines and material;  Protection against fluctuations in supply;  Control of stock volume;  Control of stock distribution
  • 4.
    INVENTORY CONTROL TECHNIQUES •ABC CLASSIFICATION • VED CLASSIFICATION. • FSN CLASSIFICATION. • EOQ CLASSIFICATION. • HML CLASSIFICATION. • SDE CLASSIFICATION. • SOS CLASSIFICATION • XYZ CLASSIFICATION
  • 5.
    Always Better Control(ABC) Analysis  This technique divides inventory into three categories A, B & C based on their annual consumption value.  It is also known as Selective Inventory Control Method (SIM)  This method is a means of categorizing inventory items according to the potential amount to be controlled.  ABC analysis has universal application for fields requiring selective control
  • 6.
    Procedure for ABCAnalysis  Make the list of all items of inventory.  Determine the annual volume of usage & money value of each item.  Multiply each item’s annual volume by its rupee value.  Compute each item’s percentage of the total inventory in terms of annual usage in rupees.  Select the top 10% of all items which have the highest rupee percentages & classify them as “A” items.  Select the next 20% of all items with the next highest rupee percentages & designate them “B” items.  The next 70% of all items with the lowest rupee percentages are “C” items.
  • 7.
    VED Classification  VED:Vital, Essential & Desirable classification  VED classification is based on the criticality of the inventories.  Vital items – Its shortage may cause havoc & stop the work in organization. They are stocked adequately to ensure smooth operation.  Essential items - Here, reasonable risk can be taken. If not available, the plant does not stop; but the efficiency of operations is adversely affected due to expediting expenses. They should be sufficiently stocked to ensure regular flow of work.  Desirable items – Its non availability does not stop the work because they can be easily purchased from the market as & when needed. They may be stocked very low or not stocked.
  • 8.
    Category “V” items“E” items “D” items “A” items Constant control & regular follow up Moderate stocks Nil stocks “B” items Moderate stocks Moderate stocks Low stocks “C” items High stocks Moderate stocks Very low stocks  It is useful in capital intensive industries, transport industries, etc. VED analysis can be better used with ABC analysis in the following pattern:
  • 9.
    FSN Analysis  FSN:Fast moving, slow moving & non moving  Classification is based on the pattern of issues from stores & is useful in controlling obsolescence.  Date of receipt or last date of issue, whichever is later, is taken to determine the no. of months which have lapsed since the last transaction.  The items are usually grouped in periods of 12 months.  It helps to avoid investments in non moving or slow items. It is also useful in facilitating timely control.
  • 10.
     For analysis,the issues of items in past two or three years are considered.  If there are no issues of an item during the period, it is “N” item.  Then up to certain limit, say 10-15 issues in the period, the item is “S” item  The items exceeding such limit of no. of issues during the period are “F” items.  The period of consideration & the limiting number of issues vary from organization to organization.
  • 11.
    Economic Order Quantity(EOQ)  EOQ or Fixed Order Quantity system is the technique of ordering materials whenever stock reaches the reorder point.  Economic order quality deals when the cost of procurement(ordering) and handling of inventory are at optimum level and total cost is minimum.  In this technique, the order quantity is larger than a single period’s requirement so that ordering costs & holding costs balance out.
  • 12.
    Tc (Total Cost) Cost(Rs.) OrderQuantity Size (Q) EOQ Carrying Cost (Q/2)H DS/Q (Ordering Cost)
  • 13.
    Assumptions of EOQ Demand for the product is constant  Lead time is constant  Price per unit is constant  Inventory carrying cost is based on average inventory  Ordering costs are constant per order
  • 14.
    Basic Fixed OrderQuantity Model (EOQ) Total Annual Cost = Annual Purchase Cost Annual Ordering Cost + + Annual Holding Cost S Q D H Q DCTC  2 H DS EOQ 2  TC = Total annual cost D = Demand C = Cost per unit Q = Order quantity S = Cost of placing order/setup cost H = Annual holding and storage cost per unit of inventory
  • 15.
    High Medium Low(HML): The HML classification is same procedure as adopted in ABC.  The core difference is, for HML classification; unit value is the criterion and not the annual consumption value.  The inventories should be place in descending order and it is up to mgmt to fix limits of these three categories.  Example: the mgmt may decide all units of items with unit value of Rs 2,000 and above will be H items; between Rs. 2000-1000 will be M items & those below Rs. 1000 will be L items.
  • 16.
    SDE Classification:  TheSDE is based upon the availability of items.  Here ‘S’ refers to ‘Scarce’ items  ‘D’ refers to ‘Difficult’ items  ‘E’ refers to ‘Easy to acquire’  This is based on problems faced in procurement, where some strategies are made on purchasing.
  • 17.
    SOS Analysis:  ‘S’stands for Seasonal items and ‘OS’- Off Seasonal items.  In general it is merit to seller to buy seasonal items at lower price and keep inventory and sell them at high price during Off seasons.  If not the seller has to buy the goods at higher prices during Off seasons.  Decisions are taken based on the fluctuations and availability.
  • 18.
    XYZ Analysis:  Thisclassification is based on the value of inventory of materials actually held in stores at given time.  This helps to control the average inventory model value.  ‘X’ items which are 10% of no.of items stored, but accounting for 70% of the total inventory value.  ‘Y’ items are 20% of no.of items stored and account for 20% of total inventory value.  ‘Z’ items are 70% of no.of items stored and account for 10% of the total value.  This analysis focuses on efforts to reduce the inventory of these items.
  • 20.
    TYPE OF ANALYSISCLASSIFICATION CRITERIA ABC CLASSIFICATION ANNUAL USAGE VALUE IN RS. VED CLASSIFICATION CRITICALITY OR IMPORTANCE FSN CLASSIFICATION ISSUE PATTERNS FROM STORES EOQ CLASSIFICATION REORDER POINT HML CLASSIFICATION UNIT PRICE SDE CLASSIFICATION AVAILABILITY SOS CLASSIFICATION SEASONABILITY XYZ CLASSIFICATION VALUE OF INVENTORY IN STORES
  • 21.
    REFERENCES  International Journalof Scientific and Research Publications, Volume 3, “ANALYSIS OF INVETORY CONTROL TECHNIQUES”, by:-Tom Jose V, Akhilesh Jayakumar, Sijo M T  Textbook of “METROLOGY & QUALITY CONTROL”; Author: Er. N. K. Patil
  • 22.