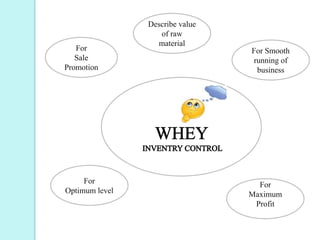
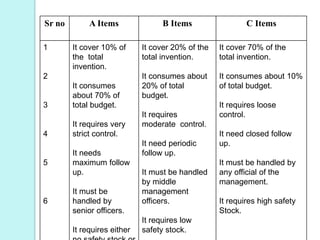
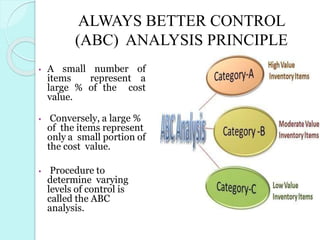
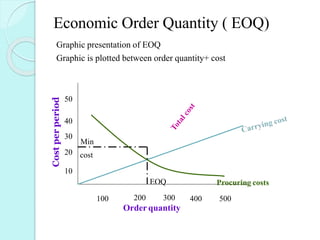
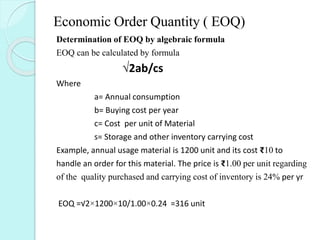
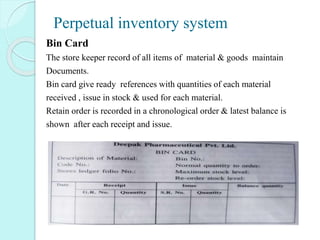
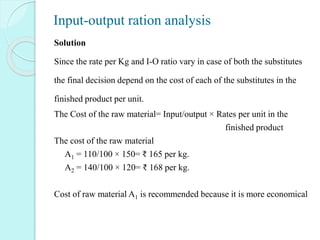
This document discusses various inventory control techniques used in pharmaceutical companies. It describes ABC analysis which divides inventory items into three categories based on their value and consumption. High-value items that consume most of the budget are category A and require strict control. Economic order quantity technique is used to determine optimal order quantities to minimize total costs. Perpetual inventory system continuously records receipts and issues to facilitate regular checking. Slow-moving and obsolete items are periodically reviewed. Input-output ratio analysis relates raw materials used to final outputs. Maintaining proper inventory control is important for smooth operations and maximum profitability.


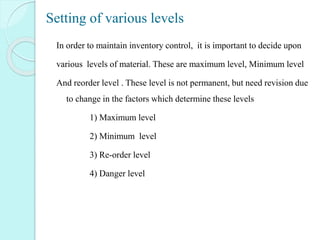
![Setting of various levels
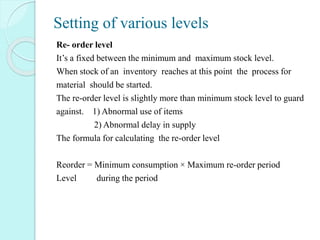
Minimum Stock level or safety stock
This is the lower limit below which the stock of any item should not
normally be allowed to fall. This is also known as buffer stock.
Main purpose is protect against out of stock and there is future danger
of stoppage of its production and supplies.
This level factors
1) Average rate of consumption
2) lead time
Lead time is total items consumed between the recognition of the need
of an item, till the time it is received for use
The minimum stock level is expressed as follows
Minimum = Re-order – [ normal consumption × average delivery time ]
level level per week](https://image.slidesharecdn.com/inventrycontrol-210130094417/85/Inventrycontrol-32-320.jpg)