1. Inventory constitutes a significant portion of current assets for most companies, averaging around 60% for public limited companies in India. Effective inventory management is important to avoid unnecessary investment and improve long-term profitability.
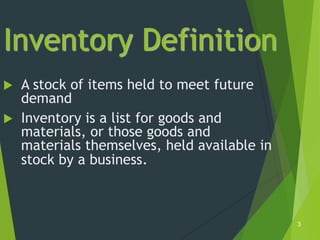
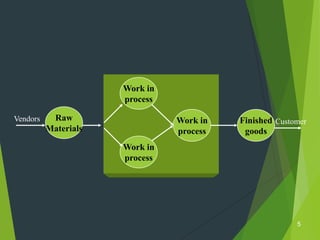
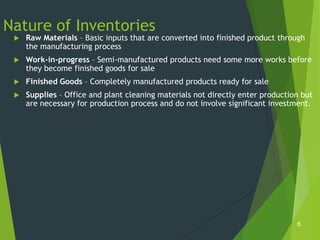
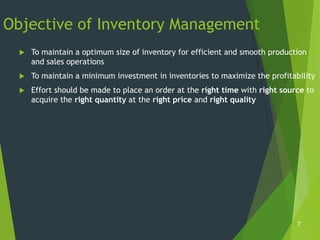
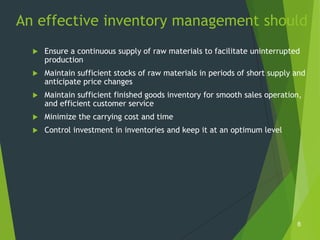
2. There are different types of inventories - raw materials, work-in-progress, and finished goods. The objectives of inventory management are to maintain optimal inventory levels for smooth operations while minimizing investment and costs.
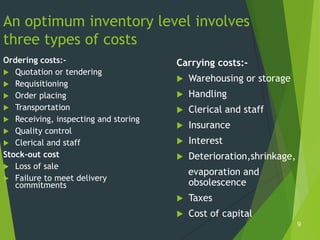
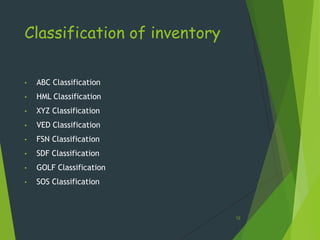
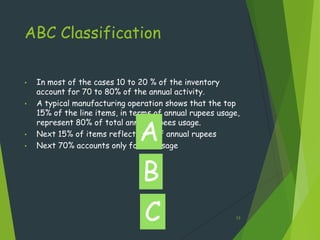
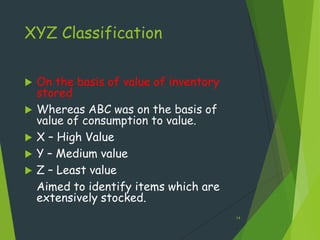
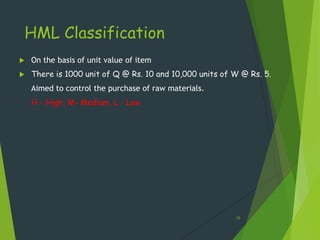
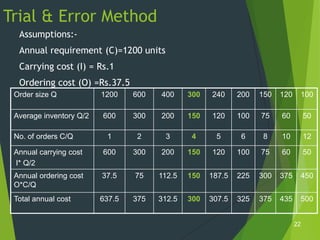
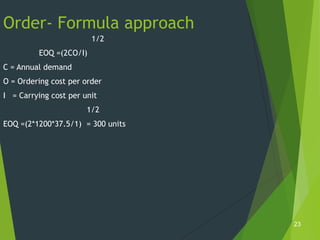
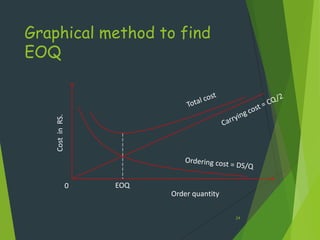
3. Different inventory classification systems are used like ABC, HML, XYZ etc. to prioritize inventory items for control purposes. The economic order quantity (EOQ) model aims to determine the optimal order size by balancing ordering and carrying costs.