Downloaded 275 times

![Why Denormalizing?
• Looking at Time Dimension table:
– We’re storing fields that can be calculated (such as day of week)
• For example if you are Safeway you want to see what day of week you
have the most customers to staff up. The question we ask the DW would
be “show me the average number of transactions we process on different
days of the week”)
– If we weren’t storing the day of week our DW would have to go
through millions of transactions, calculate the day of week based on
datestamp to match and return the results.
– This calculation is very time consuming and the response time would
be unacceptable.
– We denormalize to reduce the response time by storing more
information than [one could argue is] needed.
17](https://image.slidesharecdn.com/anintroductiontodatawarehousing-110531134050-phpapp01/85/An-introduction-to-data-warehousing-17-320.jpg)
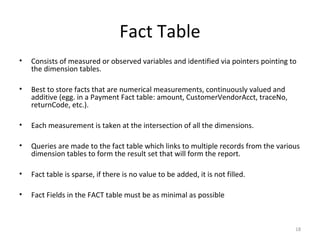
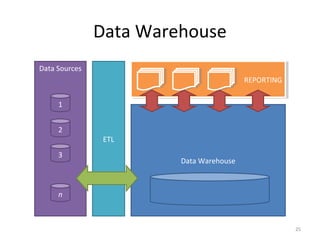


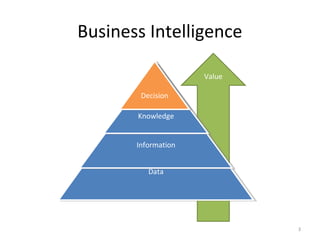
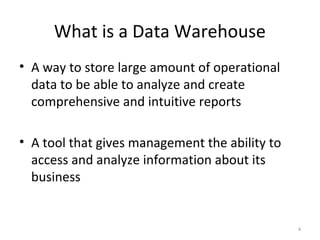
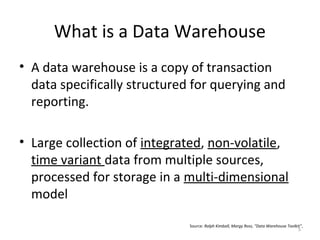
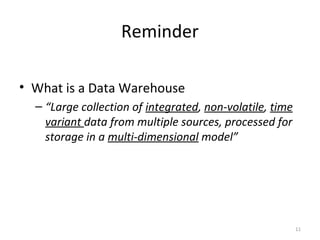
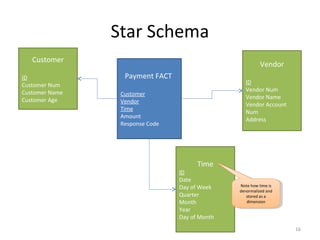
A data warehouse is a large collection of integrated data from multiple sources that is structured for analysis and reporting. It allows users to gain insights from historical data to support business decisions and identify trends. Data is extracted from operational systems, transformed for consistency and quality, and loaded into the data warehouse where it is stored in a multidimensional structure to enable analysis. This involves fact and dimension tables along with techniques like denormalization to optimize query performance.