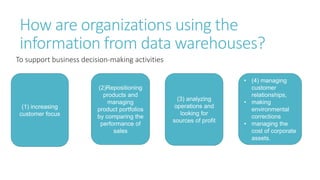
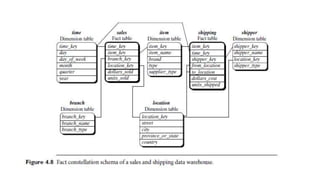
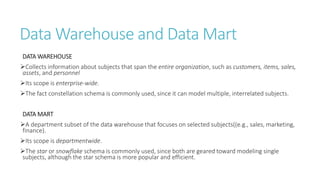
Module 1
Outline of Module 1
Introduction
Data Warehousing
Multidimensional Data Model
OLAP Operations
Introduction to KDD process
Data mining
Data mining -On What kinds of Data
Data mining Functionalities
Classification of Data Mining Systems.
What is Data Warehouse?
Defined in many different ways
 The process of centralizing an organization's historical data from various sources into a
single, comprehensive database.
 allows for advanced analytics, reporting, and informed decision-making across the
enterprise.
 Provides architectures and tools for business executives to systematically organize,
understand, and use their data to make strategic decisions.
 A data repository that is maintained separately from an organization’s operational
database.
Outline of Module 1
Data Pre-processing
Data Cleaning
Data Integration and Transformation
Data Reduction
Data discretization
Concept hierarchy generation
What is Data Warehouse?
“A data warehouse is a subject-oriented, integrated, time-variant,
and nonvolatile collection of data in support of management’s
decision-making process.” - William H. Inmon
Data warehousing: The process of constructing and using data warehouses
Requires data cleaning, data integration, and data consolidation
Data Warehouse—Subject-Oriented
Organized around major subjects, such as customer, product, sales
Focusing on the modeling and analysis of data for decision makers, not
on daily operations or transaction processing
Provide a simple and concise view around particular subject issues by
excluding data that are not useful in the decision support process
Data Warehouse—Integrated
Constructed by integrating multiple, heterogeneous data
sources
relational databases, flat files, on-line transaction records
Data cleaning and data integration techniques are applied
Ensure consistency in naming conventions, encoding
structures, attribute measures, etc. among different data
sources
E.g., Hotel price: currency, tax, breakfast covered, etc.
When data is moved to the warehouse, it is converted.
Data Warehouse—Time Variant
The time horizon for the data warehouse is significantly longer than that
of operational systems
 Operational database: current value data
 Data warehouse data: provide information from a historical perspective
(e.g., past 5-10 years)
Every key structure in the data warehouse
 Contains an element of time, explicitly or implicitly
 But the key of operational data may or may not contain “time element”
Data Warehouse—Nonvolatile
A physically separate store of data transformed from the application data
found in the operational environment.
Operational update of data does not occur in the data warehouse
environment
 Does not require transaction processing, recovery, and concurrency
control mechanisms
 Requires only two operations in data accessing:
 initial loading of data and access of data
How are organizations using the
information from data warehouses?
To support business decision-making activities
(1) increasing
customer focus
(2)Repositioning
products and
managing
product portfolios
by comparing the
performance of
sales
(3) analyzing
operations and
looking for
sources of profit
• (4) managing
customer
relationships,
• making
environmental
corrections
• managing the
cost of corporate
assets.
DataWarehouse vs. Heterogeneous DBMS
Traditional heterogeneous DB integration: A query driven
approach
 Build wrappers/mediators on top of heterogeneous databases
 When a query is posed to a client site, a meta-dictionary is used
to translate the query into queries appropriate for individual
heterogeneous sites involved, and the results are integrated into
a global answer set
 Complex information filtering, compete for resources
 It is inefficient and potentially expensive for frequent queries.
DataWarehouse vs. Heterogeneous DBMS
Data warehouse: update-driven, high performance
 Information from heterogeneous sources is integrated in advance and stored in
warehouses for direct query and analysis.
 DW does not contain current information.
 Reason for high performance of DW –
 data are copied, preprocessed, integrated, annotated, summarized, and
restructured into one semantic data store.
 does not interfere with the processing at local sources.
 can store and integrate historic information and support complex multidimensional
queries.
DataWarehouse vs. Operational DBMS
OLTP (on-line transaction processing)
 Major task of traditional relational DBMS
 Day-to-day operations: purchasing, inventory, banking, manufacturing, payroll, registration,
accounting, etc.
OLAP (on-line analytical processing)
 Major task of data warehouse system
 Data analysis and decision making
Distinct features (OLTP vs. OLAP):
User and system orientation: customer oriented vs. market-oriented
Data contents: current, detailed vs. historical, consolidated
Database design: ER + application oriented DB Design vs. star or snowflake + subject oriented DB
Design
View: current, local vs. evolutionary nature of organization, data from various sources, various orgzns,
huge volume , stored on multiple media
Access patterns: up-to-date data, short, atomic transactions vs. read-only but complex queries
Module 1
Multidimensional Data Model
Data warehouses and OLAP tools are based on a multidimensional data model.
This model views data in the form of a data cube.
“What is a data cube?”
A data cube allows data to be modeled and viewed in multiple dimensions.
It is defined by dimensions and facts.
In DW, the data cube is n-dimensional.
From Tables and SpreadsheetstoDataCubes
Dimensions are perspectives or entities with respect to which an organization
wants to keep records. Eg. Sales with respect to time, item, branch, location.
Each dimension may have a table associated with it, called a dimension
table, which further describes the dimension.
For example, a dimension table for item (may contain the attributes item
name, brand, and type) or time (day, week, month, quarter, year)
Dimension tables can be specified by users or experts, or automatically
generated and adjusted based on data distributions
Facts are numerical measures.
 Fact table contains measures (such as dollars_sold, units_sold,
amount_budgeted) and keys to each of the related dimension tables
From Tables and SpreadsheetstoDataCubes
A multidimensional data model is organized around a central theme, eg: sales.
Theme is represented by a fact table.
Facts are numeric measures.
Facts are quantities by which we analyze relationships between dimensions.
Examples: facts for a sales data warehouse include dollars_sold (sales amount in
dollars),units_sold (number of units sold), and amount_budgeted.
The fact table contains the names of the facts, or measures, as well as keys to
each of the related dimension tables.
In data warehousing literature, a data cube is often referred to as a
cuboid.
Given a set of dimensions, we can generate a cuboid for each of the
possible subsets of the given dimensions.
The result would form a lattice of cuboids, each showing the data at a
different level of summarization, or group-by.
The lattice of cuboids is then referred to as a data cube.
A base cuboid -The cuboid that holds the lowest level of
summarization.
The 0-D cuboid, which holds the highest level of summarization, is
called the apex cuboid.
Lattice of Cuboids
Schemas for Multidimensional
Databases
The ER model is used for relational database design. For data warehouse design
we need a concise, subject-oriented schema that facilitates data analysis.
Multidimensional model exist in the form of :
Star schema: A fact table in the middle connected to a set of dimension tables
Snowflake schema: A refinement of star schema where some dimensional hierarchy
is normalized into a set of smaller dimension tables, forming a shape similar to
snowflake
Fact constellations: Multiple fact tables share dimension tables, viewed as a
collection of stars, therefore called galaxy schema or fact constellation
Star schema
The most common modeling paradigm is the star schema.
The data warehouse contains
(1) a large central table (fact table) containing the bulk of the data, with no
redundancy
(2) a set of smaller attendant tables (dimension tables), one for each dimension.
The schema graph resembles a starburst, with the dimension tables displayed in a
radial pattern around the central fact table.
Limitation:
Each dimension is represented by only one table, and each table contains a set of
attributes.
This constraint may introduce some redundancy.
For example, the location dimension table contains the attribute set {location key,
street, city, province or state, country}. (Eg:Urbana, Chicago are cities in Illinois, USA).
Snowflake schema
The snowflake schema is a variant of the star schema model.
Some dimension tables are normalized, thereby further splitting the data into
additional tables.
The resulting schema graph forms a shape similar to a snowflake.
The dimension tables of the snowflake model may be kept in normalized form to
reduce redundancies.
Tables - Easy to maintain and saves storage space.
However, this space savings is negligible.
Snowflake structure can reduce the effectiveness of browsing, since more joins will
be needed to execute a query.
Consequently, the system performance may be adversely impacted.
Fact constellation
Sophisticated applications.
Multiple fact tables to share dimension tables.
This kind of schema can be viewed as a collection of stars, and hence is called a
galaxy schema or a fact constellation.
A fact constellation schema allows dimension tables to be shared between fact tables.
Data Warehouse and Data Mart
DATA WAREHOUSE
Collects information about subjects that span the entire organization, such as customers, items, sales,
assets, and personnel
Its scope is enterprise-wide.
The fact constellation schema is commonly used, since it can model multiple, interrelated subjects.
DATA MART
A department subset of the data warehouse that focuses on selected subjects((e.g., sales, marketing,
finance).
Its scope is departmentwide.
The star or snowflake schema is commonly used, since both are geared toward modeling single
subjects, although the star schema is more popular and efficient.

1-Data Warehousing-Multi Dim Data Model.pptx

  • 1.
  • 2.
    Outline of Module1 Introduction Data Warehousing Multidimensional Data Model OLAP Operations Introduction to KDD process Data mining Data mining -On What kinds of Data Data mining Functionalities Classification of Data Mining Systems.
  • 3.
    What is DataWarehouse? Defined in many different ways  The process of centralizing an organization's historical data from various sources into a single, comprehensive database.  allows for advanced analytics, reporting, and informed decision-making across the enterprise.  Provides architectures and tools for business executives to systematically organize, understand, and use their data to make strategic decisions.  A data repository that is maintained separately from an organization’s operational database.
  • 4.
    Outline of Module1 Data Pre-processing Data Cleaning Data Integration and Transformation Data Reduction Data discretization Concept hierarchy generation
  • 5.
    What is DataWarehouse? “A data warehouse is a subject-oriented, integrated, time-variant, and nonvolatile collection of data in support of management’s decision-making process.” - William H. Inmon Data warehousing: The process of constructing and using data warehouses Requires data cleaning, data integration, and data consolidation
  • 6.
    Data Warehouse—Subject-Oriented Organized aroundmajor subjects, such as customer, product, sales Focusing on the modeling and analysis of data for decision makers, not on daily operations or transaction processing Provide a simple and concise view around particular subject issues by excluding data that are not useful in the decision support process
  • 7.
    Data Warehouse—Integrated Constructed byintegrating multiple, heterogeneous data sources relational databases, flat files, on-line transaction records Data cleaning and data integration techniques are applied Ensure consistency in naming conventions, encoding structures, attribute measures, etc. among different data sources E.g., Hotel price: currency, tax, breakfast covered, etc. When data is moved to the warehouse, it is converted.
  • 8.
    Data Warehouse—Time Variant Thetime horizon for the data warehouse is significantly longer than that of operational systems  Operational database: current value data  Data warehouse data: provide information from a historical perspective (e.g., past 5-10 years) Every key structure in the data warehouse  Contains an element of time, explicitly or implicitly  But the key of operational data may or may not contain “time element”
  • 9.
    Data Warehouse—Nonvolatile A physicallyseparate store of data transformed from the application data found in the operational environment. Operational update of data does not occur in the data warehouse environment  Does not require transaction processing, recovery, and concurrency control mechanisms  Requires only two operations in data accessing:  initial loading of data and access of data
  • 10.
    How are organizationsusing the information from data warehouses? To support business decision-making activities (1) increasing customer focus (2)Repositioning products and managing product portfolios by comparing the performance of sales (3) analyzing operations and looking for sources of profit • (4) managing customer relationships, • making environmental corrections • managing the cost of corporate assets.
  • 11.
    DataWarehouse vs. HeterogeneousDBMS Traditional heterogeneous DB integration: A query driven approach  Build wrappers/mediators on top of heterogeneous databases  When a query is posed to a client site, a meta-dictionary is used to translate the query into queries appropriate for individual heterogeneous sites involved, and the results are integrated into a global answer set  Complex information filtering, compete for resources  It is inefficient and potentially expensive for frequent queries.
  • 12.
    DataWarehouse vs. HeterogeneousDBMS Data warehouse: update-driven, high performance  Information from heterogeneous sources is integrated in advance and stored in warehouses for direct query and analysis.  DW does not contain current information.  Reason for high performance of DW –  data are copied, preprocessed, integrated, annotated, summarized, and restructured into one semantic data store.  does not interfere with the processing at local sources.  can store and integrate historic information and support complex multidimensional queries.
  • 13.
    DataWarehouse vs. OperationalDBMS OLTP (on-line transaction processing)  Major task of traditional relational DBMS  Day-to-day operations: purchasing, inventory, banking, manufacturing, payroll, registration, accounting, etc. OLAP (on-line analytical processing)  Major task of data warehouse system  Data analysis and decision making Distinct features (OLTP vs. OLAP): User and system orientation: customer oriented vs. market-oriented Data contents: current, detailed vs. historical, consolidated Database design: ER + application oriented DB Design vs. star or snowflake + subject oriented DB Design View: current, local vs. evolutionary nature of organization, data from various sources, various orgzns, huge volume , stored on multiple media Access patterns: up-to-date data, short, atomic transactions vs. read-only but complex queries
  • 14.
  • 15.
    Multidimensional Data Model Datawarehouses and OLAP tools are based on a multidimensional data model. This model views data in the form of a data cube. “What is a data cube?” A data cube allows data to be modeled and viewed in multiple dimensions. It is defined by dimensions and facts. In DW, the data cube is n-dimensional.
  • 16.
    From Tables andSpreadsheetstoDataCubes Dimensions are perspectives or entities with respect to which an organization wants to keep records. Eg. Sales with respect to time, item, branch, location. Each dimension may have a table associated with it, called a dimension table, which further describes the dimension. For example, a dimension table for item (may contain the attributes item name, brand, and type) or time (day, week, month, quarter, year) Dimension tables can be specified by users or experts, or automatically generated and adjusted based on data distributions Facts are numerical measures.  Fact table contains measures (such as dollars_sold, units_sold, amount_budgeted) and keys to each of the related dimension tables
  • 17.
    From Tables andSpreadsheetstoDataCubes A multidimensional data model is organized around a central theme, eg: sales. Theme is represented by a fact table. Facts are numeric measures. Facts are quantities by which we analyze relationships between dimensions. Examples: facts for a sales data warehouse include dollars_sold (sales amount in dollars),units_sold (number of units sold), and amount_budgeted. The fact table contains the names of the facts, or measures, as well as keys to each of the related dimension tables.
  • 22.
    In data warehousingliterature, a data cube is often referred to as a cuboid. Given a set of dimensions, we can generate a cuboid for each of the possible subsets of the given dimensions. The result would form a lattice of cuboids, each showing the data at a different level of summarization, or group-by. The lattice of cuboids is then referred to as a data cube. A base cuboid -The cuboid that holds the lowest level of summarization. The 0-D cuboid, which holds the highest level of summarization, is called the apex cuboid.
  • 23.
  • 24.
    Schemas for Multidimensional Databases TheER model is used for relational database design. For data warehouse design we need a concise, subject-oriented schema that facilitates data analysis. Multidimensional model exist in the form of : Star schema: A fact table in the middle connected to a set of dimension tables Snowflake schema: A refinement of star schema where some dimensional hierarchy is normalized into a set of smaller dimension tables, forming a shape similar to snowflake Fact constellations: Multiple fact tables share dimension tables, viewed as a collection of stars, therefore called galaxy schema or fact constellation
  • 25.
    Star schema The mostcommon modeling paradigm is the star schema. The data warehouse contains (1) a large central table (fact table) containing the bulk of the data, with no redundancy (2) a set of smaller attendant tables (dimension tables), one for each dimension. The schema graph resembles a starburst, with the dimension tables displayed in a radial pattern around the central fact table. Limitation: Each dimension is represented by only one table, and each table contains a set of attributes. This constraint may introduce some redundancy. For example, the location dimension table contains the attribute set {location key, street, city, province or state, country}. (Eg:Urbana, Chicago are cities in Illinois, USA).
  • 27.
    Snowflake schema The snowflakeschema is a variant of the star schema model. Some dimension tables are normalized, thereby further splitting the data into additional tables. The resulting schema graph forms a shape similar to a snowflake. The dimension tables of the snowflake model may be kept in normalized form to reduce redundancies. Tables - Easy to maintain and saves storage space. However, this space savings is negligible. Snowflake structure can reduce the effectiveness of browsing, since more joins will be needed to execute a query. Consequently, the system performance may be adversely impacted.
  • 29.
    Fact constellation Sophisticated applications. Multiplefact tables to share dimension tables. This kind of schema can be viewed as a collection of stars, and hence is called a galaxy schema or a fact constellation. A fact constellation schema allows dimension tables to be shared between fact tables.
  • 31.
    Data Warehouse andData Mart DATA WAREHOUSE Collects information about subjects that span the entire organization, such as customers, items, sales, assets, and personnel Its scope is enterprise-wide. The fact constellation schema is commonly used, since it can model multiple, interrelated subjects. DATA MART A department subset of the data warehouse that focuses on selected subjects((e.g., sales, marketing, finance). Its scope is departmentwide. The star or snowflake schema is commonly used, since both are geared toward modeling single subjects, although the star schema is more popular and efficient.