Downloaded 48 times


![A DATA MINING QUERY LANGUAGE,
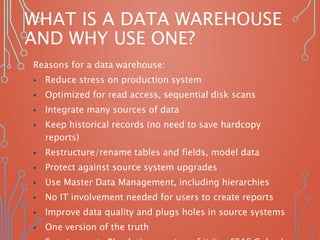
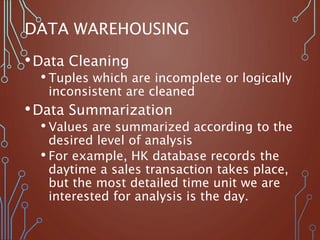
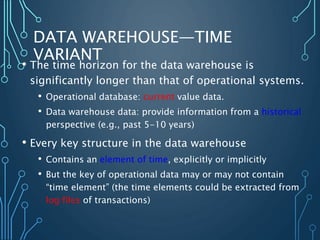
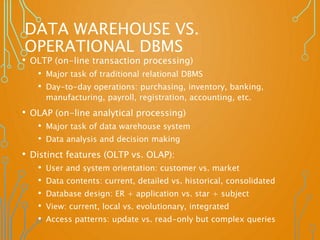
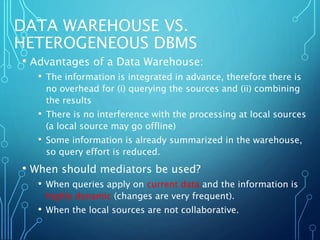
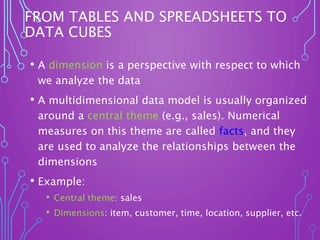
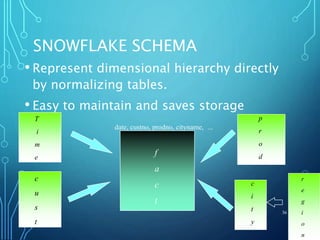
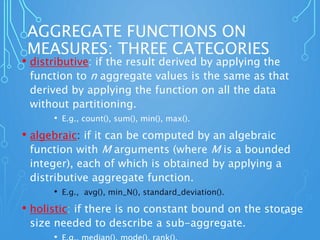
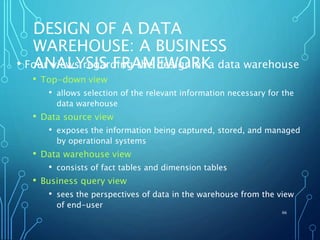
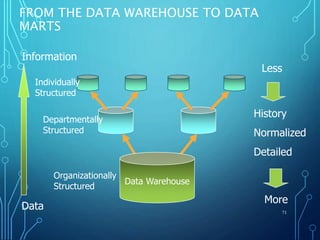
DMQL: LANGUAGE PRIMITIVES
• Cube Definition (Fact Table)
define cube <cube_name> [<dimension_list>]:
<measure_list>
• Dimension Definition ( Dimension Table )
define dimension <dimension_name> as
(<attribute_or_subdimension_list>)
• Special Case (Shared Dimension Tables)
• First time as “cube definition”
• define dimension <dimension_name> as
<dimension_name_first_time> in cube
<cube_name_first_time>
40](https://image.slidesharecdn.com/datawarehouse-170126164922/85/Data-warehouse-40-320.jpg)
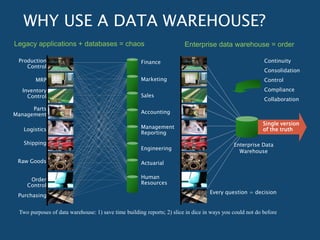
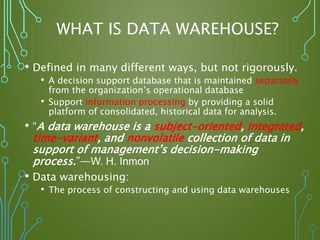
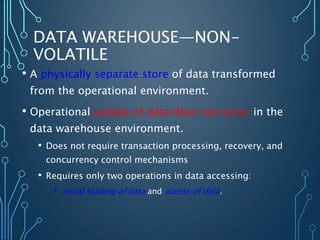
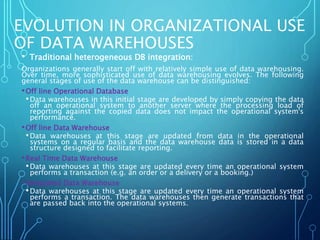
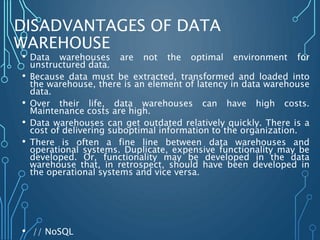
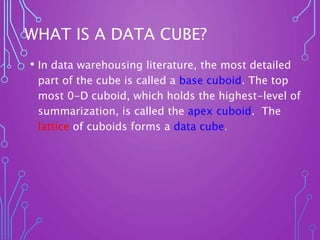
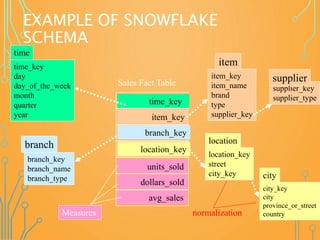
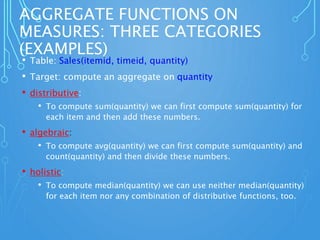
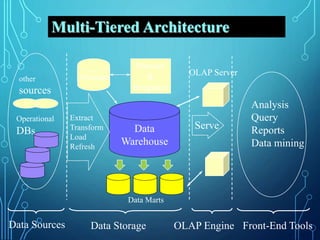
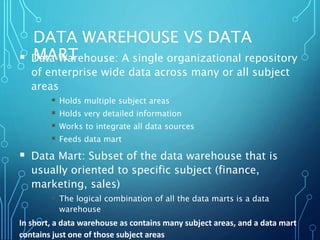
![DEFINING A STAR SCHEMA IN
DMQL
define cube sales_star [time, item, branch, location]:
dollars_sold = sum(sales_in_dollars), avg_sales =
avg(sales_in_dollars), units_sold = count(*)
define dimension time as (time_key, day, day_of_week,
month, quarter, year)
define dimension item as (item_key, item_name, brand,
type, supplier_type)
define dimension branch as (branch_key, branch_name,
branch_type)
define dimension location as (location_key, street, city,
province_or_state, country)
41](https://image.slidesharecdn.com/datawarehouse-170126164922/85/Data-warehouse-41-320.jpg)
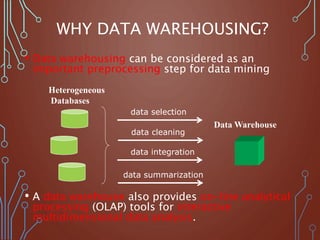
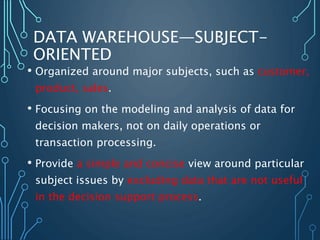
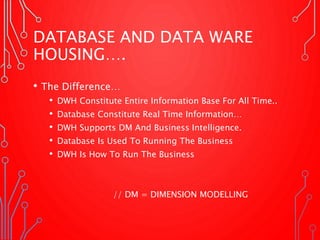
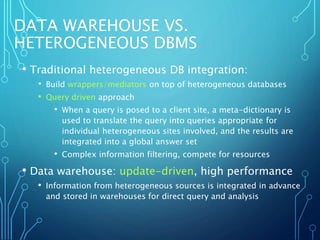
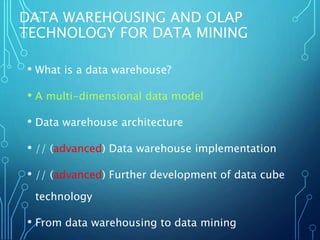
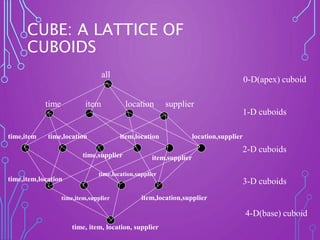
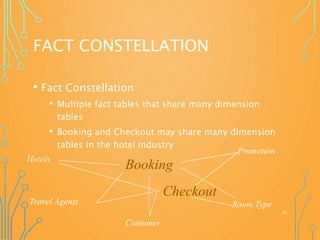
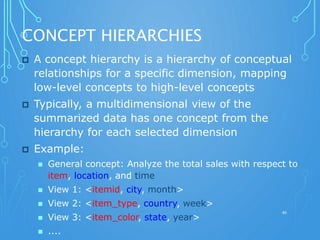
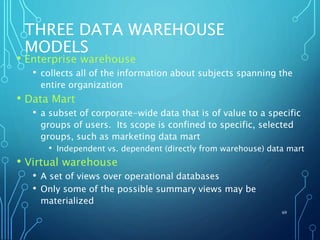
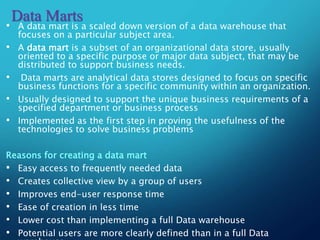
![DEFINING A SNOWFLAKE SCHEMA IN
DMQL
define cube sales_snowflake [time, item, branch,
location]:
dollars_sold = sum(sales_in_dollars), avg_sales =
avg(sales_in_dollars), units_sold = count(*)
define dimension time as (time_key, day, day_of_week,
month, quarter, year)
define dimension item as (item_key, item_name, brand,
type, supplier(supplier_key, supplier_type))
define dimension branch as (branch_key, branch_name,
branch_type)
define dimension location as (location_key, street,
city(city_key, province_or_state, country))
42](https://image.slidesharecdn.com/datawarehouse-170126164922/85/Data-warehouse-42-320.jpg)
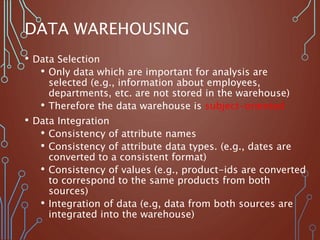
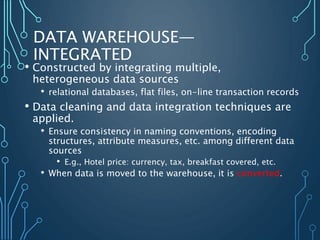
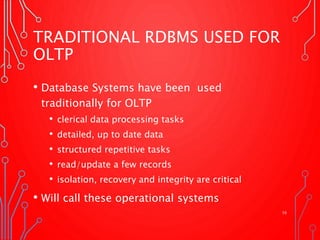
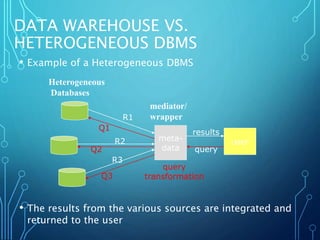
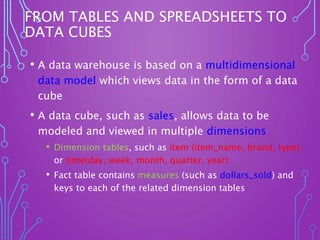
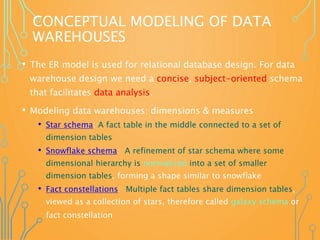
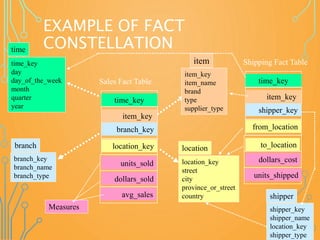
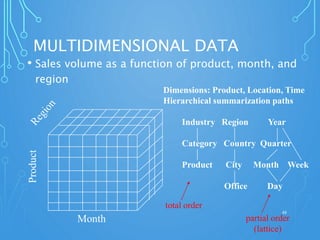
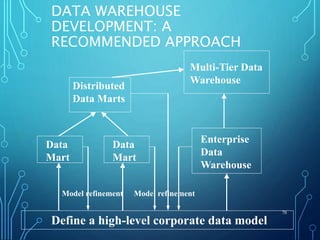
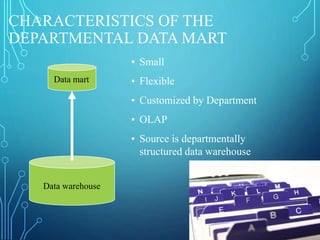
![DEFINING A FACT CONSTELLATION
IN DMQL
define cube sales [time, item, branch, location]:
dollars_sold = sum(sales_in_dollars), avg_sales = avg(sales_in_dollars), units_sold
= count(*)
define dimension time as (time_key, day, day_of_week, month, quarter, year)
define dimension item as (item_key, item_name, brand, type, supplier_type)
define dimension branch as (branch_key, branch_name, branch_type)
define dimension location as (location_key, street, city, province_or_state,
country)
define cube shipping [time, item, shipper, from_location, to_location]:
dollar_cost = sum(cost_in_dollars), unit_shipped = count(*)
define dimension time as time in cube sales
define dimension item as item in cube sales
define dimension shipper as (shipper_key, shipper_name, location as location in
cube sales, shipper_type)
define dimension from_location as location in cube sales
define dimension to_location as location in cube sales](https://image.slidesharecdn.com/datawarehouse-170126164922/85/Data-warehouse-43-320.jpg)

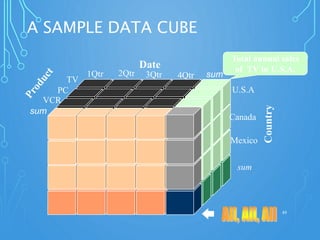
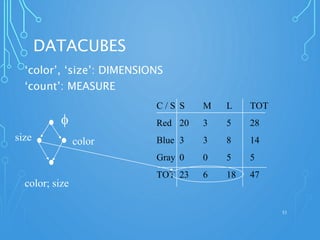
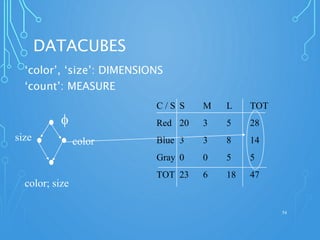
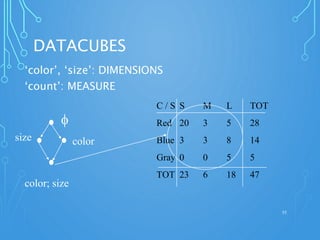
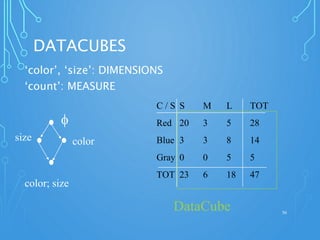
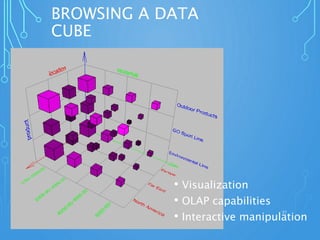

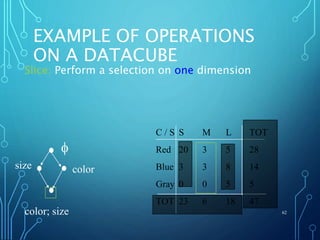
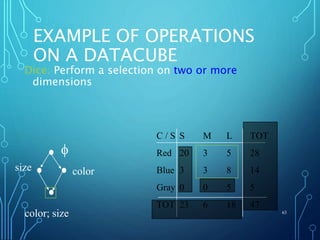


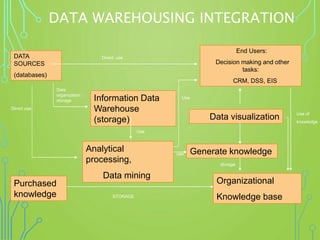


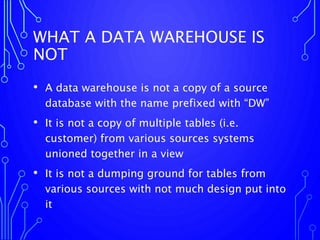
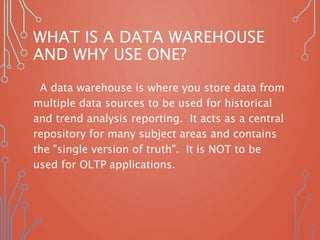
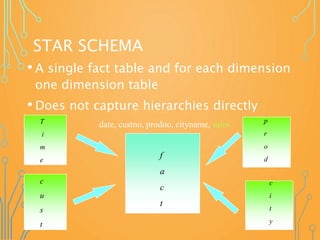
A data warehouse is a central repository for storing historical and integrated data from multiple sources to be used for analysis and reporting. It contains a single version of the truth and is optimized for read access. In contrast, operational databases are optimized for transaction processing and contain current detailed data. A key aspect of data warehousing is using a dimensional model with fact and dimension tables. This allows for analyzing relationships between measures and dimensions in a multi-dimensional structure known as a data cube.