Download as PDF, PPTX

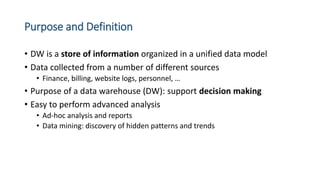
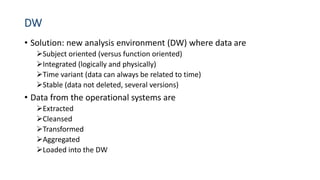
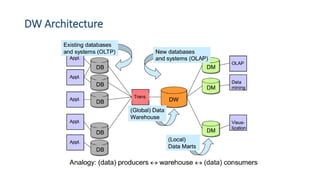
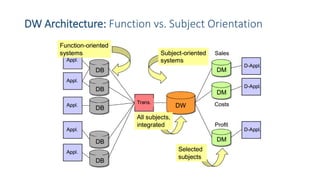
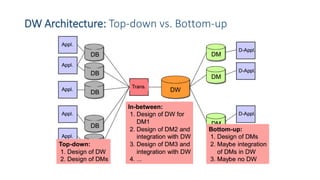
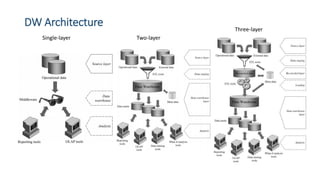
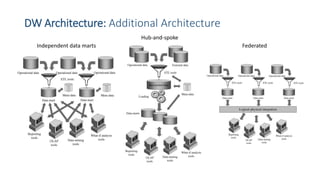
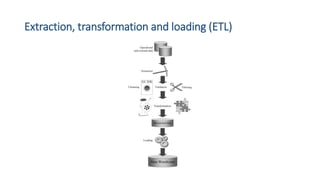

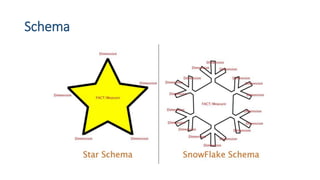
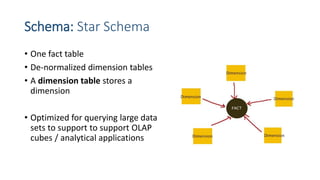
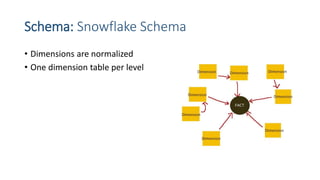


This document provides an introduction to data warehouses. It defines a data warehouse as a collection of methods and tools used to support decision making through data analysis. The key points are: A data warehouse stores information from multiple sources in a unified data model to support analysis and decision making. It extracts, cleans, transforms and aggregates data from operational systems. A multidimensional model with facts, dimensions, measures and hierarchies provides an easy to analyze structure. Common architectures include single-layer, two-layer, three-layer, independent datamarts and hub-and-spoke. The document discusses schemas, extraction/transformation/loading, and dimensional modeling concepts.