Download as PDF, PPTX
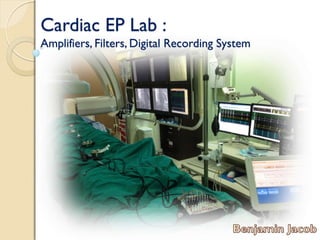
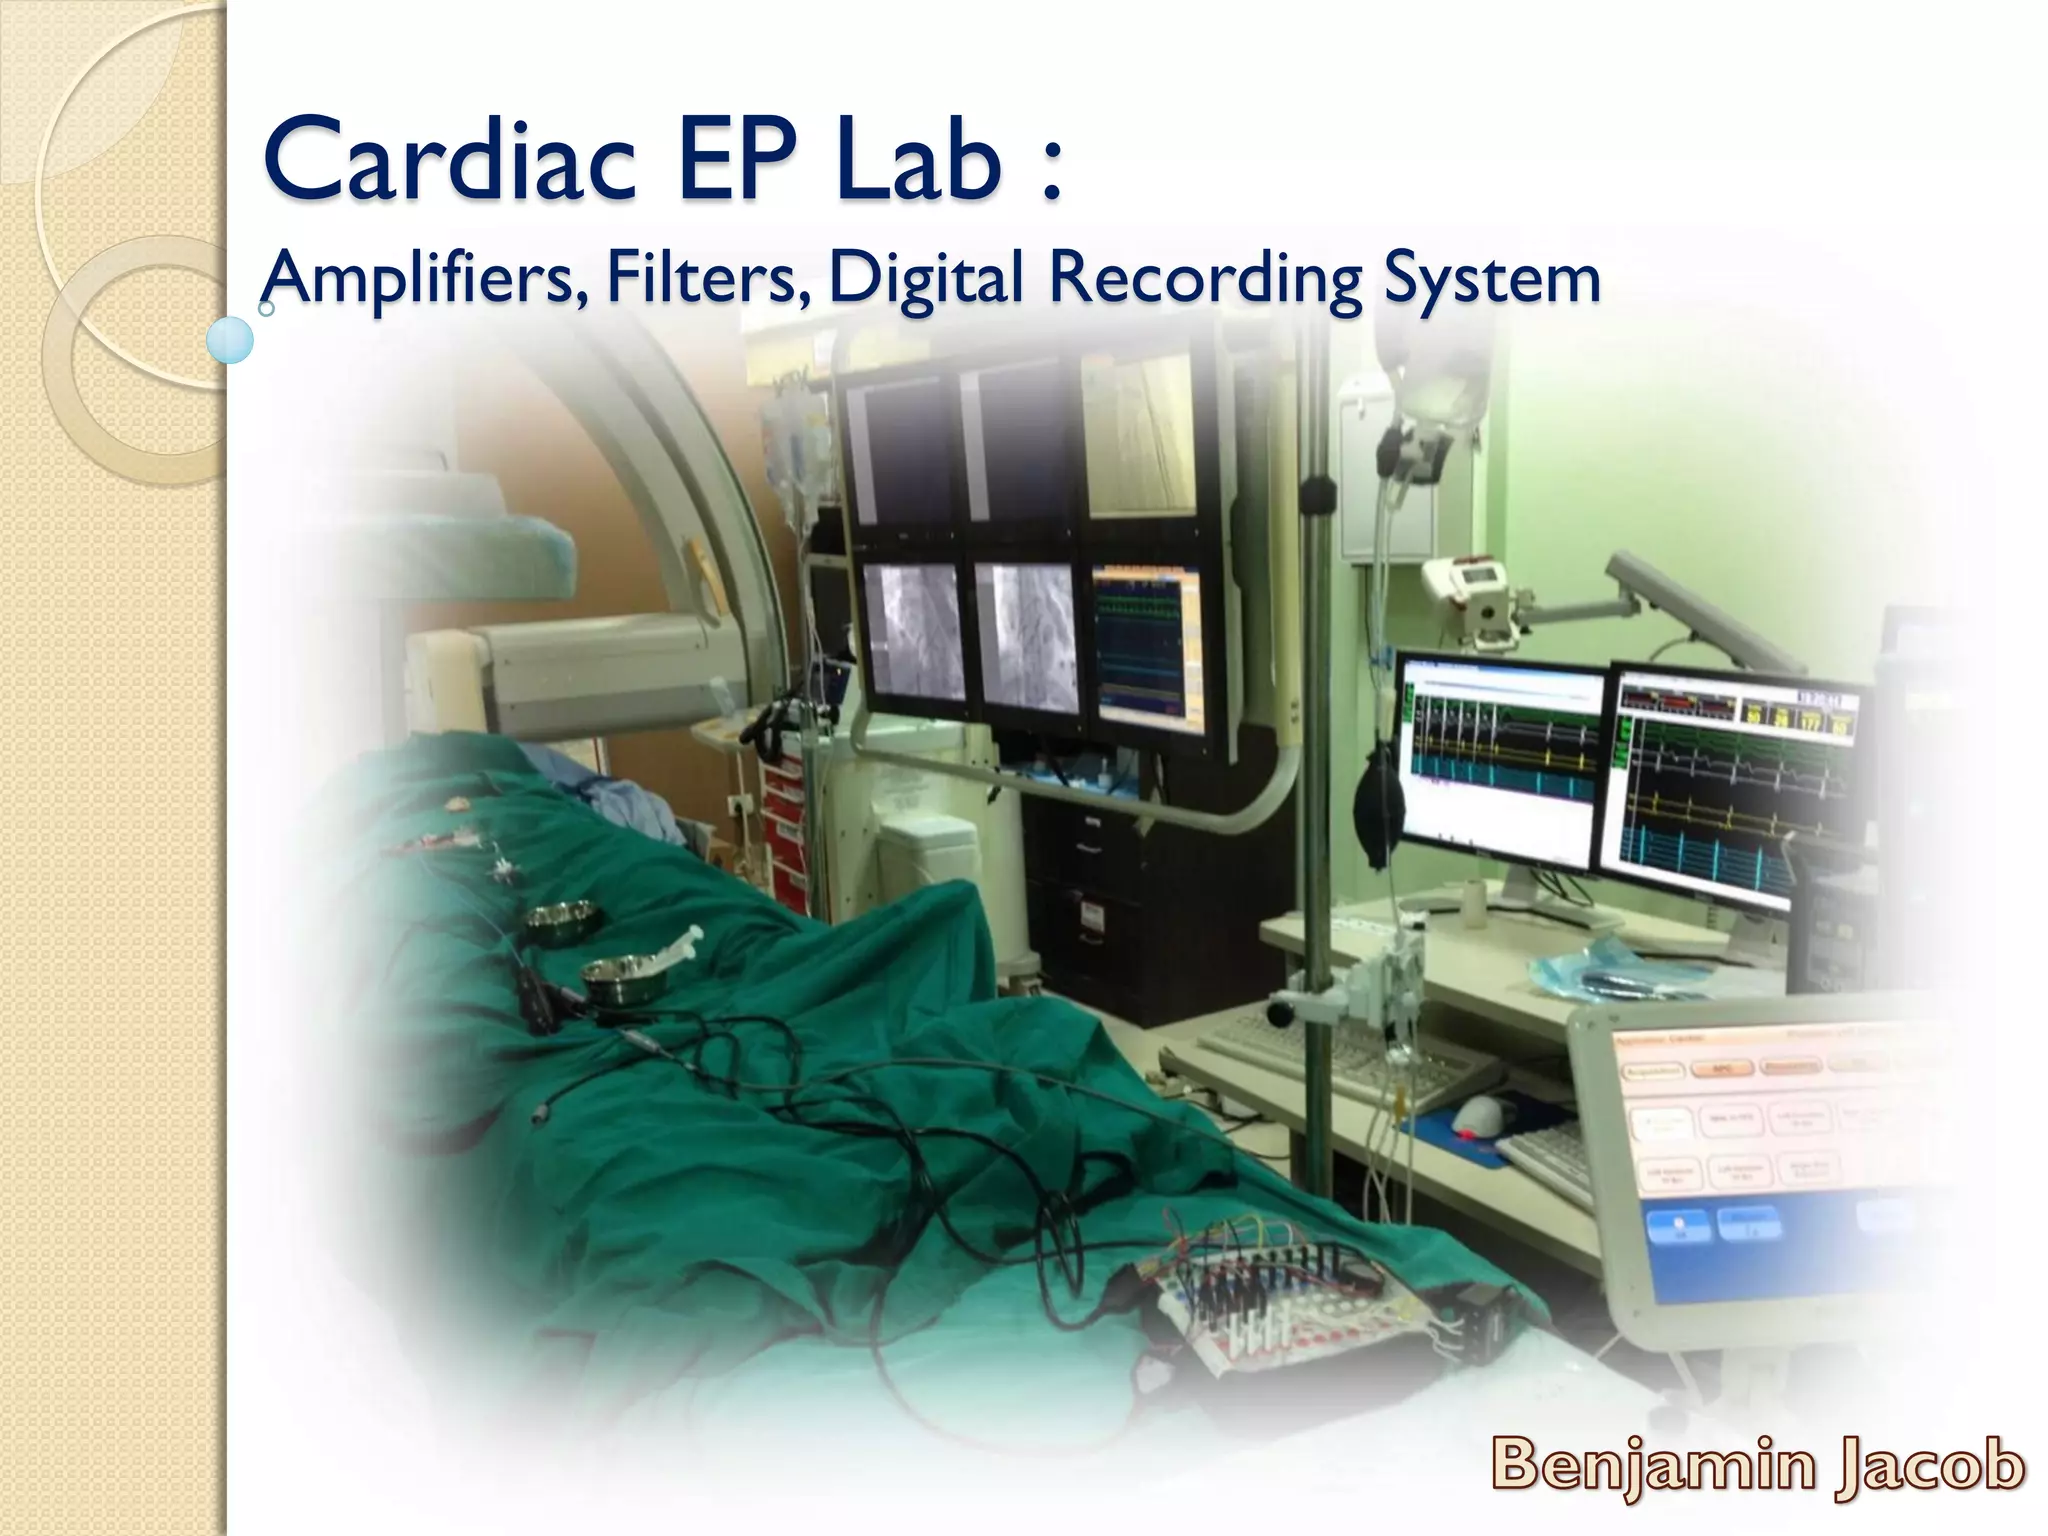
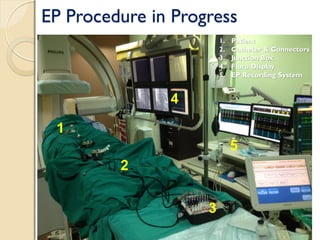
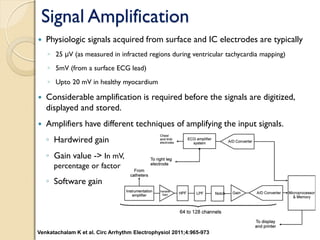
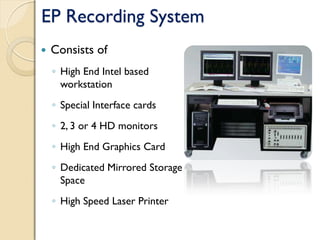
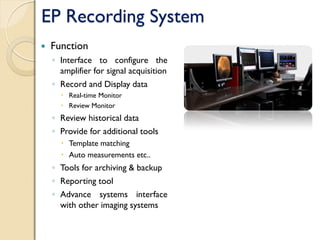
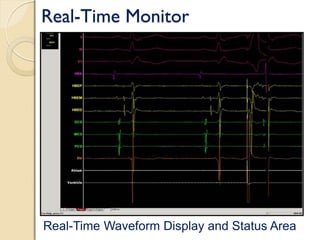
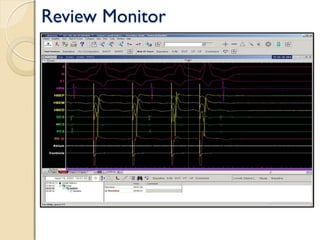
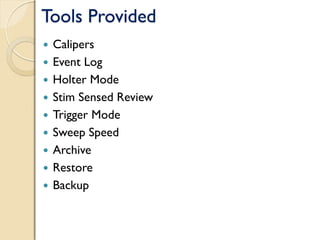
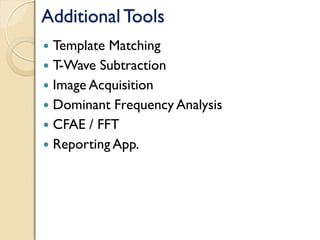


The document describes the key components of a cardiac electrophysiology (EP) lab, including recording systems, amplifiers, filters, catheters, and other equipment. It discusses the purpose and function of diagnostic and ablation catheters, signal processing components like amplifiers, filters, and A/D conversion. It also covers topics like appropriate gain and filter settings, sources of noise, and the functions of an EP recording system including real-time monitoring, review capabilities, and additional analysis tools.