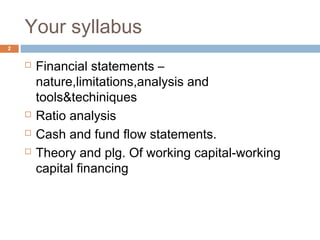
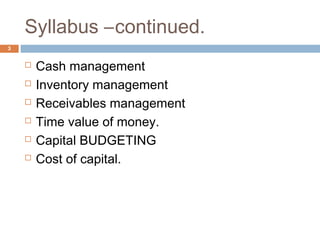
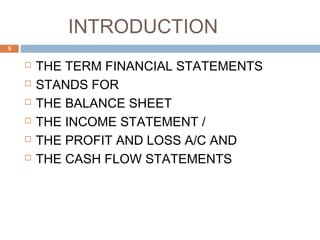
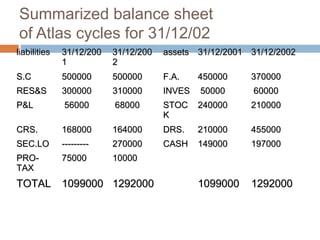
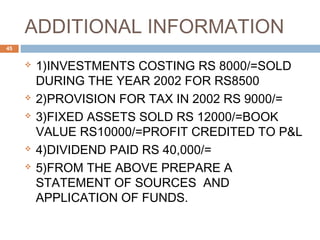
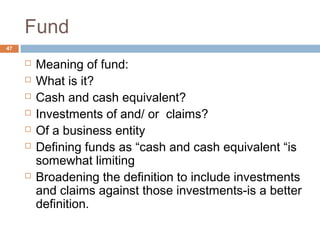
WELCOME
TO
THE COURSE ON FINANCIAL
MANAGEMENT
BY
T.VENKATARAMANAN.FICWA.FCS.
1
Your syllabus
 Financial statements –
nature,limitations,analysis and
tools&techiniques
 Ratio analysis
 Cash and fund flow statements.
 Theory and plg. Of working capital-working
capital financing
2
Syllabus –continued.
 Cash management
 Inventory management
 Receivables management
 Time value of money.
 Capital BUDGETING
 Cost of capital.
3
Rules of the game
 There is no gain with out pain.
 Use it or lose it
 Many heads are better than one.Relie on group
discussions.
 The lecturer is only facilitator of the groups and
not a teacher, only a guide and a coordinator
,aid and not an assistant ,rendering a service
and not selling a product.
4
INTRODUCTION
 THE TERM FINANCIAL STATEMENTS
 STANDS FOR
 THE BALANCE SHEET
 THE INCOME STATEMENT /
 THE PROFIT AND LOSS A/C AND
 THE CASH FLOW STATEMENTS
5
THE BALANCE SHEET
 WHAT IT IS?
 BRIEFLY STATED IT IS A STATEMENT OF
ASSETS AND LIABILITIES OF A
 BUSINESS ORGANISATION ON A GIVEN
POINT OF TIME
 IT IS A SNAP SHOT OF THE FINANCIAL
POSITION OF AN ORGANISATION
6
ASSETS
 WHAT ARE THEY ?
 THEY ARE THE RIGHTS AND PROPERTIES
OWNED BY THE BUSINESS.
 IT REFERS TO THE RESOURCES ACQUIRED
BY THE BUSINESS THROUGH THE FUNDS
PROVIDED BY THE SHARE HOLDERS AND
THE CREDITORS
 IT APPEARS ON THE RIGHT HAND SIDE OF
THE BALANCESHEET.
7
LIABILITIES
 LIABILITIES REFER TO THE CLAIMS
AGAINST THE COMPANY INCLUDING THAT
OF THE SHARE HOLDERS AND
OUTSIDERS.
 IT IS WHAT THE COMPANY OWES TO
SHARE HOLDERS AND CREDITORS.
 IT APPEARS ON THE LEFTHAND SIDE OF
THE BALANCE SHEET.
8
Classification of assets
 Assets are classified into
 Fixed assets-like land, building ,plant &machinery
etc.These are not meant for resale and intended for long
term use.
 Current assets are those which are acquired for resale –
finished goods
 Or for conversion and resale-raw materials
 And others like sundry debtors,bills,cash and bank
balances
 In short current asset means cash and other resources
easily convertible into cash consumed in the normal
operating cycle of business.
9
Classification of liabilities
 Long term liabilities-Also known as fixed
liabilities; which do not become due for payment
in one year and which do not involve current
assets for their payment, includes share capital
and long term debts.
 Current liabilities are what the company owes to
outsiders and which may become payable with
in one year out of the sale of current assets,
example: accounts payable, sundry creditors,
etc.

10
Income statement
or
profit&loss account
 Depending upon the type of the organisation ,
inorder to ascertain the financial out
come,periodically or as and when required , a
statement of income and expenditure , or
receipt and payment a/c or manufacturing,
trading , and profit and loss a/c is prepared.
11
Funds & Fund flow
statement
 The international accounting std. no.7
recognises the absence of a single, generally
accepted definition of fund. According to the
standard , the term fund generally refers to cash
cash equivalents or working capital.
 There are two concepts of working capital –the
gross concept and the net concept. The term
funds are generally used in the latter sense.
12
Fund flow stt.continued
 Fund flow statements can be prepared from
balance sheet as total resource basis and may
be prepared on amplified basis.
 Fund flow statement on working capital basis
presents1)sources of working capital 2)uses of
working capital and 3) the net changes in
working capital or “as a statement showing the
changes in working capital”
13
Cash flow statement
 Cash flow statement which is also known as
“wgwgs”-where got where gone statement
depicts the flow of cash in an organisation from
different activities and used for various
purposes.
 In India the cash flow statement of listed
companies will have to be prepared as per the
indirect method prescribed in AS-3.

14
FINANCIAL
MANAGEMENT
MODULE-II
Ratio analysis
15
MEANING OF FINANCIAL
ANALYSIS
 FINANCIAL ANALYSIS LITERALLY MEANS
BREAKING THE VARIOUS STATEMENTS
INTO SMALLER MANAGEABLE
INDEPENDENT PARTS FOR THE PURPOSE
OF EXAMINING THE DATA WITH A VIEW
TO ASSESS THE PROFITABILITY,
SOLVENCY, LIQUIDITY,VIABILITY AND
STABILITY OF A BUSINESS ENTITY.
16
Ratios :Definition
 What is a ratio?
 Ratio is an indicated quotient of two
mathematical expressions.
 It is a number which expresses the relationship
between two or more things.
 A financial ratio is a number which expresses
the relationship between two financial figures
 It can be a % or a decimal or a fraction also.
17
Who uses?
 Share holders.
 Creditors.
 Investors.
 Financial institutions.
 Bankers.
 Investigators and researchers.
18
What are the five major categories of
ratios?
What questions do they answer?
 Liquidity: Are we in a position to make required
payments in time in the current period?
 Asset management: Right amount of assets vs sales.
 Debt management: Right mix of debt and equity.
 Profitability:do sales price exceed cost of sales and
sales high enough as reflected in PM, ROE, and ROA ?
 MARKET VALUES: Do investors like what they see as
reflected in P/E, and M/B ratios ?
19
Classification of ratios
 1)Traditional classification :
 A) Profit & Loss a/c Ratios
 B ) Balance Sheet Ratios
 C) Composite ratios
20
Groups of ratios.Functional point of
view
 Liquidity ratios
 Solvency ratios
 Profitability ratios
 Turn over ratios
 Capital structure or stability ratios
 Coverage ratios
21
Liquidity Ratios/profitability
ratios
 Current ratio = current assets / current
liabilities
 Acid test ratio = Liquid assets / current
liabilities
 Gross profit to sales
 Net profit to sales
 Return on assets = net profit after tax/ total
assets
 Return on capital employed= NPAIT/ Total
capital employed
22
Solvency & turn over ratios
 solvency ratio = debt equity ratios
 = long term debt/ shareholders equity
 Capital gearing ratio = fixed interest bearing
capital/ shareholders funds
 Turn over ratios
 Inventory turn over ratio= cost of goods sold
/average inventory
 Debtors turn over ratio = net credit sales /
average debtors
23
Coverage ratios
 Interest cover = E BI&T/ INTEREST
 DIVIDEND COVER = E AT/dividend on
preference shares.
 Total coverage = EBI& T/TOTAL FIXED
CHARGES
24
Yard sticks:
 Ratios express only positions , to assess
whether it is good, bad , or in between require
some yardsticks or benchmarks.
 Some bench marks which are commonly used
are i) absolute standards –common to all
entities ii) historical standards-past-best
applicable to that unit iii) horizontal standards-
best of comparable entities. iv) budgetary
standards based on ideal working
conditions,based on budgets
25
ILLUSTRATION -I
 FOLLOWING IS THE BALANCE SHEET AND
PROFIT AND LOSS ACCOUNT OF
ABC.LTD.COMPUTE ABOVE RATIOS .
26
BALANCE SHEET AS AT 31/03/2007
OF ABC.LTD
 LIABILITIES.RS LAKHS
 SHARE CAP
1350
 RESERVES&
 SURPLUS 1000
 SEC-LOAN
500
 S.CRS. 300
 PRO.DIVIDEND 150
 Total 3300
 ASSETS
 LAND 100
 BUILDINGS 650
 PLANT&M/C 1100
 OTHERS 200
 CURRENT ASSETS
 INVENTORY 510
 S.DRS. 540
 CASH 200
 TOTAL 3300
27
TRADING ACCOUNT
 TO,OP.STOCK
360
 TO, PUR 1750
 TO,GROSS P/L
900
 TOTAL 3010
 BY,SALES
2700
 CLOSING STK
310
 TOTAL 3010
28
PROFIT AND LOSS ACCOUNT
 TO,ESTT.EXP 90
 TO,ADMN EXP 270
 TO,SELLING EXP 100
 TO,INT –DEB 70
 TO,INCOME TAX 90
 TO,NET PROFIT 280
 TOTAL 900
 BY,GP 900
 TOTAL 900
29
Profit &LOSS APPROPRIATION
ACCOUNT
 PRO.DVD 150
 BALANCEC/D 350
 TOTAL 500
 BY,N.P.B/D 280
 PROFIT.P.Y 220
 TOTAL 500
30
Illustration -ii
 From the following data pertaining to xyz ltd.,
draw up the companies balance sheet:
 1)current ratio: 2.5 2)liquid ratio 1.5
 3) net working capital Rs 3,00,000
 4)cost of sales /closing stock=6
 5) G.P.ratio= 20 %
 6)FA/TO=2 based on cost of sales.
 7)average debt collection period 2 months
8)FA/SHAREHOLDERS FUNDS=0.80
 9)Reserves and Surpluses/eq=0.50
 10)B.R & B.P. Rs 100,000. EACH
31
THE TOOLS AND
TECHNIQUES
 THE TOOLS AND TECHNIQUES OF
ANALYSIS FALL UNDER THE FOLLOWING
CATEGORIES:
 A)VERTICAL ANALYSIS
 B)HORIZONTAL ANALYSIS
 C)BALANCE SHEET ANALYSIS
 D)P&L ANALYSIS
 E)COMPOSITE DATA ANALYSIS
32
TOOLS CONTINUED
 F)COMPARATIVE BALANCE SHEETS
 G)COMMON SIZE BALANCE SHEETS
 H)RATIOS
33
THE PROCEDURE
 NORMALLY STARTS WITH A STUDY OF
RELATIONSHIP AMONG VARIOUS
FINANCIAL FACTORS IN A SINGLE SET OF
STATEMENTS AND A STUDY OF THE TREND
OF THESE FACTORSAS SHOWN IN A
SERIES OF STATEMENTS.
 IT INVOLVES A PROCESS OF SELECTION OF
FIGURES ,STUDY OF THEIR RELATIONSHIP
AND EVALUATION
34
COMPARATIVE BALANCE
SHEET
 BHEL 2006
 SHARE CAP
24476
 RES&SUR
705662
 SEC LOAN 50000
 UNSEC-L
5824
 TOTAL 785962
 BHEL 2005
 SHARE CAP
24476
 RESER 578213
 SEC LOAN
50000
 UNSEC-L
3698
 TOTAL
656387
35
APPLICATION OF FUNDS
 2006
 NET F.A.
98228
 CAPITAL WORKS
18457
 INVESTMENTS
829
 DEFER.TAX
67372
 C.A. 1633078
 -C.L. -1032002
 NET.C.A. 601076

 2005
 104424
 9532
 895
 51827
 1334298
 -C.L.
-844589
 489709
 656387
36
COMMONSIZE BALANCE
SHEETS
 INSTEAD OF ABSOLUTE
FIGURES,REDUCE THE CONSTITUENTS
INTO %S TAKING THE TOTAL AS 100
 THE PREVIOUS SLIDE FIGURES WILL
APPEAR AS UNDER:
 YEAR 2005 2006
 SHARE+RES 88.5% 93%
 LOANFUNDS 11.5% 7%
37
CONCLUSION
 WE HAVE TAKEN A SIMPLIFIED VERSION
INBOTH CASES .
 THE COMPARISON FACILITATES
UNDERSTANDING THE GROWTH OF THE
CURRENT YEAR OVER THE PREVIOUS
YEAR
 THE COMMON SIZE BALANCE SHEETS
QUANTIFY THE RATE OF GROWTH
 OTHER TOOLS –NEXT MODULE. BYE.
38
MODULE 3:
COMPARITIVE P & L
QUESTIONS
39
PROFIT & LOSS A/C
 2001 RS
 SALES 15,25,000
 INT&DIV 7,500
 PROFIT ON
 SALE–LAND 6000
 TOTAL 15,38,500
 COST OF
 GOODS 9,00,000
 2002 RS
 17,00,000
 6,200
 8,000
 TOTAL17,14,200
 9,50,000
40
P & L CONTINUED
 2001 RS
 ADMN EXP 93250
 S&DN EXP 190000
 INT 8000
 LOSS ON
 SALE-M/C 2500
 TAX 85000
N.P 259750
 TOTAL 1538500
 2002 RS
 95980
 209000
 7000
 800
 168000
 283420
 1714200
41
COMPARE &
COMMENT
ON THE P & L ACCOUNTS
42
MODULE 5
FUND FLOW
STATEMENTS
problems
43
Summarized balance sheet
of Atlas cycles for 31/12/02
liabilities 31/12/20031/12/200
11
31/12/20031/12/200
22
assetsassets 31/12/200131/12/2001 31/12/200231/12/2002
S.CS.C 500000500000 500000500000 F.A.F.A. 450000450000 370000370000
RES&SRES&S 300000300000 310000310000 INVESINVES 5000050000 6000060000
P&LP&L 5600056000 6800068000 STOCSTOC
KK
240000240000 210000210000
CRS.CRS. 168000168000 164000164000 DRS.DRS. 210000210000 455000455000
SEC.LOSEC.LO ------------------ 270000270000 CASHCASH 149000149000 197000197000
PRO-PRO-
TAXTAX
7500075000 1000010000
TOTALTOTAL 10990001099000 12920001292000 10990001099000 12920001292000
44
ADDITIONAL INFORMATION
 1)INVESTMENTS COSTING RS 8000/=SOLD
DURING THE YEAR 2002 FOR RS8500
 2)PROVISION FOR TAX IN 2002 RS 9000/=
 3)FIXED ASSETS SOLD RS 12000/=BOOK
VALUE RS10000/=PROFIT CREDITED TO P&L
 4)DIVIDEND PAID RS 40,000/=
 5)FROM THE ABOVE PREPARE A
STATEMENT OF SOURCES AND
APPLICATION OF FUNDS.
45
FINANCIAL
MANAGEMENT
MODULE-VI
Fund Flow statements
46
Fund
 Meaning of fund:
 What is it?
 Cash and cash equivalent?
 Investments of and/ or claims?
 Of a business entity
 Defining funds as “cash and cash equivalent “is
somewhat limiting
 Broadening the definition to include investments
and claims against those investments-is a better
definition.
47
Fund Flow statement
 Is it sources and application of funds?
 Does balance sheet satisfy the definition?
 No.balance sheet shows the financial position
as on a given date .It is a snapshot, static
statement.
 Flow is a dynamic concept, it traces the path
,the source and its flow , where it gets
invested.It is a wgwgs –where got where gone
statement
 Balance sheet is stock of funds.changes in
balance sheets –two-is the net flow.
48
Fund flow –from balance sheets
 Source of funds
 Any decrease in
asset item
 Any increase in
claims(liability)
 Uses of funds
 Any increase in
asset item.
 Any decrease in
claims
49
Tips- tips -tips
AssetAsset liabilityliability
sourcesource __ ++
usesuses ++ __
50
Some questions?
 Is increase in cash a source or an application?
 Bonus issue of shares ?
 Retained earnings?
51
Classification of ratios
 Structural point of view :
 Balance sheet ratios: debt equity ratio, current
ratio, quick ratio
 Profit and Loss ratios: G.P. Ratio, N.P.
Ratio ,turn over ratios
 Composite ratios :ROE, RONW, ROCE,
ROTA, TOTA, TOFA, TOWC, TODR,
TOSTOCK,
52

All inone financial mgt

  • 1.
    WELCOME TO THE COURSE ONFINANCIAL MANAGEMENT BY T.VENKATARAMANAN.FICWA.FCS. 1
  • 2.
    Your syllabus  Financialstatements – nature,limitations,analysis and tools&techiniques  Ratio analysis  Cash and fund flow statements.  Theory and plg. Of working capital-working capital financing 2
  • 3.
    Syllabus –continued.  Cashmanagement  Inventory management  Receivables management  Time value of money.  Capital BUDGETING  Cost of capital. 3
  • 4.
    Rules of thegame  There is no gain with out pain.  Use it or lose it  Many heads are better than one.Relie on group discussions.  The lecturer is only facilitator of the groups and not a teacher, only a guide and a coordinator ,aid and not an assistant ,rendering a service and not selling a product. 4
  • 5.
    INTRODUCTION  THE TERMFINANCIAL STATEMENTS  STANDS FOR  THE BALANCE SHEET  THE INCOME STATEMENT /  THE PROFIT AND LOSS A/C AND  THE CASH FLOW STATEMENTS 5
  • 6.
    THE BALANCE SHEET WHAT IT IS?  BRIEFLY STATED IT IS A STATEMENT OF ASSETS AND LIABILITIES OF A  BUSINESS ORGANISATION ON A GIVEN POINT OF TIME  IT IS A SNAP SHOT OF THE FINANCIAL POSITION OF AN ORGANISATION 6
  • 7.
    ASSETS  WHAT ARETHEY ?  THEY ARE THE RIGHTS AND PROPERTIES OWNED BY THE BUSINESS.  IT REFERS TO THE RESOURCES ACQUIRED BY THE BUSINESS THROUGH THE FUNDS PROVIDED BY THE SHARE HOLDERS AND THE CREDITORS  IT APPEARS ON THE RIGHT HAND SIDE OF THE BALANCESHEET. 7
  • 8.
    LIABILITIES  LIABILITIES REFERTO THE CLAIMS AGAINST THE COMPANY INCLUDING THAT OF THE SHARE HOLDERS AND OUTSIDERS.  IT IS WHAT THE COMPANY OWES TO SHARE HOLDERS AND CREDITORS.  IT APPEARS ON THE LEFTHAND SIDE OF THE BALANCE SHEET. 8
  • 9.
    Classification of assets Assets are classified into  Fixed assets-like land, building ,plant &machinery etc.These are not meant for resale and intended for long term use.  Current assets are those which are acquired for resale – finished goods  Or for conversion and resale-raw materials  And others like sundry debtors,bills,cash and bank balances  In short current asset means cash and other resources easily convertible into cash consumed in the normal operating cycle of business. 9
  • 10.
    Classification of liabilities Long term liabilities-Also known as fixed liabilities; which do not become due for payment in one year and which do not involve current assets for their payment, includes share capital and long term debts.  Current liabilities are what the company owes to outsiders and which may become payable with in one year out of the sale of current assets, example: accounts payable, sundry creditors, etc.  10
  • 11.
    Income statement or profit&loss account Depending upon the type of the organisation , inorder to ascertain the financial out come,periodically or as and when required , a statement of income and expenditure , or receipt and payment a/c or manufacturing, trading , and profit and loss a/c is prepared. 11
  • 12.
    Funds & Fundflow statement  The international accounting std. no.7 recognises the absence of a single, generally accepted definition of fund. According to the standard , the term fund generally refers to cash cash equivalents or working capital.  There are two concepts of working capital –the gross concept and the net concept. The term funds are generally used in the latter sense. 12
  • 13.
    Fund flow stt.continued Fund flow statements can be prepared from balance sheet as total resource basis and may be prepared on amplified basis.  Fund flow statement on working capital basis presents1)sources of working capital 2)uses of working capital and 3) the net changes in working capital or “as a statement showing the changes in working capital” 13
  • 14.
    Cash flow statement Cash flow statement which is also known as “wgwgs”-where got where gone statement depicts the flow of cash in an organisation from different activities and used for various purposes.  In India the cash flow statement of listed companies will have to be prepared as per the indirect method prescribed in AS-3.  14
  • 15.
  • 16.
    MEANING OF FINANCIAL ANALYSIS FINANCIAL ANALYSIS LITERALLY MEANS BREAKING THE VARIOUS STATEMENTS INTO SMALLER MANAGEABLE INDEPENDENT PARTS FOR THE PURPOSE OF EXAMINING THE DATA WITH A VIEW TO ASSESS THE PROFITABILITY, SOLVENCY, LIQUIDITY,VIABILITY AND STABILITY OF A BUSINESS ENTITY. 16
  • 17.
    Ratios :Definition  Whatis a ratio?  Ratio is an indicated quotient of two mathematical expressions.  It is a number which expresses the relationship between two or more things.  A financial ratio is a number which expresses the relationship between two financial figures  It can be a % or a decimal or a fraction also. 17
  • 18.
    Who uses?  Shareholders.  Creditors.  Investors.  Financial institutions.  Bankers.  Investigators and researchers. 18
  • 19.
    What are thefive major categories of ratios? What questions do they answer?  Liquidity: Are we in a position to make required payments in time in the current period?  Asset management: Right amount of assets vs sales.  Debt management: Right mix of debt and equity.  Profitability:do sales price exceed cost of sales and sales high enough as reflected in PM, ROE, and ROA ?  MARKET VALUES: Do investors like what they see as reflected in P/E, and M/B ratios ? 19
  • 20.
    Classification of ratios 1)Traditional classification :  A) Profit & Loss a/c Ratios  B ) Balance Sheet Ratios  C) Composite ratios 20
  • 21.
    Groups of ratios.Functionalpoint of view  Liquidity ratios  Solvency ratios  Profitability ratios  Turn over ratios  Capital structure or stability ratios  Coverage ratios 21
  • 22.
    Liquidity Ratios/profitability ratios  Currentratio = current assets / current liabilities  Acid test ratio = Liquid assets / current liabilities  Gross profit to sales  Net profit to sales  Return on assets = net profit after tax/ total assets  Return on capital employed= NPAIT/ Total capital employed 22
  • 23.
    Solvency & turnover ratios  solvency ratio = debt equity ratios  = long term debt/ shareholders equity  Capital gearing ratio = fixed interest bearing capital/ shareholders funds  Turn over ratios  Inventory turn over ratio= cost of goods sold /average inventory  Debtors turn over ratio = net credit sales / average debtors 23
  • 24.
    Coverage ratios  Interestcover = E BI&T/ INTEREST  DIVIDEND COVER = E AT/dividend on preference shares.  Total coverage = EBI& T/TOTAL FIXED CHARGES 24
  • 25.
    Yard sticks:  Ratiosexpress only positions , to assess whether it is good, bad , or in between require some yardsticks or benchmarks.  Some bench marks which are commonly used are i) absolute standards –common to all entities ii) historical standards-past-best applicable to that unit iii) horizontal standards- best of comparable entities. iv) budgetary standards based on ideal working conditions,based on budgets 25
  • 26.
    ILLUSTRATION -I  FOLLOWINGIS THE BALANCE SHEET AND PROFIT AND LOSS ACCOUNT OF ABC.LTD.COMPUTE ABOVE RATIOS . 26
  • 27.
    BALANCE SHEET ASAT 31/03/2007 OF ABC.LTD  LIABILITIES.RS LAKHS  SHARE CAP 1350  RESERVES&  SURPLUS 1000  SEC-LOAN 500  S.CRS. 300  PRO.DIVIDEND 150  Total 3300  ASSETS  LAND 100  BUILDINGS 650  PLANT&M/C 1100  OTHERS 200  CURRENT ASSETS  INVENTORY 510  S.DRS. 540  CASH 200  TOTAL 3300 27
  • 28.
    TRADING ACCOUNT  TO,OP.STOCK 360 TO, PUR 1750  TO,GROSS P/L 900  TOTAL 3010  BY,SALES 2700  CLOSING STK 310  TOTAL 3010 28
  • 29.
    PROFIT AND LOSSACCOUNT  TO,ESTT.EXP 90  TO,ADMN EXP 270  TO,SELLING EXP 100  TO,INT –DEB 70  TO,INCOME TAX 90  TO,NET PROFIT 280  TOTAL 900  BY,GP 900  TOTAL 900 29
  • 30.
    Profit &LOSS APPROPRIATION ACCOUNT PRO.DVD 150  BALANCEC/D 350  TOTAL 500  BY,N.P.B/D 280  PROFIT.P.Y 220  TOTAL 500 30
  • 31.
    Illustration -ii  Fromthe following data pertaining to xyz ltd., draw up the companies balance sheet:  1)current ratio: 2.5 2)liquid ratio 1.5  3) net working capital Rs 3,00,000  4)cost of sales /closing stock=6  5) G.P.ratio= 20 %  6)FA/TO=2 based on cost of sales.  7)average debt collection period 2 months 8)FA/SHAREHOLDERS FUNDS=0.80  9)Reserves and Surpluses/eq=0.50  10)B.R & B.P. Rs 100,000. EACH 31
  • 32.
    THE TOOLS AND TECHNIQUES THE TOOLS AND TECHNIQUES OF ANALYSIS FALL UNDER THE FOLLOWING CATEGORIES:  A)VERTICAL ANALYSIS  B)HORIZONTAL ANALYSIS  C)BALANCE SHEET ANALYSIS  D)P&L ANALYSIS  E)COMPOSITE DATA ANALYSIS 32
  • 33.
    TOOLS CONTINUED  F)COMPARATIVEBALANCE SHEETS  G)COMMON SIZE BALANCE SHEETS  H)RATIOS 33
  • 34.
    THE PROCEDURE  NORMALLYSTARTS WITH A STUDY OF RELATIONSHIP AMONG VARIOUS FINANCIAL FACTORS IN A SINGLE SET OF STATEMENTS AND A STUDY OF THE TREND OF THESE FACTORSAS SHOWN IN A SERIES OF STATEMENTS.  IT INVOLVES A PROCESS OF SELECTION OF FIGURES ,STUDY OF THEIR RELATIONSHIP AND EVALUATION 34
  • 35.
    COMPARATIVE BALANCE SHEET  BHEL2006  SHARE CAP 24476  RES&SUR 705662  SEC LOAN 50000  UNSEC-L 5824  TOTAL 785962  BHEL 2005  SHARE CAP 24476  RESER 578213  SEC LOAN 50000  UNSEC-L 3698  TOTAL 656387 35
  • 36.
    APPLICATION OF FUNDS 2006  NET F.A. 98228  CAPITAL WORKS 18457  INVESTMENTS 829  DEFER.TAX 67372  C.A. 1633078  -C.L. -1032002  NET.C.A. 601076   2005  104424  9532  895  51827  1334298  -C.L. -844589  489709  656387 36
  • 37.
    COMMONSIZE BALANCE SHEETS  INSTEADOF ABSOLUTE FIGURES,REDUCE THE CONSTITUENTS INTO %S TAKING THE TOTAL AS 100  THE PREVIOUS SLIDE FIGURES WILL APPEAR AS UNDER:  YEAR 2005 2006  SHARE+RES 88.5% 93%  LOANFUNDS 11.5% 7% 37
  • 38.
    CONCLUSION  WE HAVETAKEN A SIMPLIFIED VERSION INBOTH CASES .  THE COMPARISON FACILITATES UNDERSTANDING THE GROWTH OF THE CURRENT YEAR OVER THE PREVIOUS YEAR  THE COMMON SIZE BALANCE SHEETS QUANTIFY THE RATE OF GROWTH  OTHER TOOLS –NEXT MODULE. BYE. 38
  • 39.
    MODULE 3: COMPARITIVE P& L QUESTIONS 39
  • 40.
    PROFIT & LOSSA/C  2001 RS  SALES 15,25,000  INT&DIV 7,500  PROFIT ON  SALE–LAND 6000  TOTAL 15,38,500  COST OF  GOODS 9,00,000  2002 RS  17,00,000  6,200  8,000  TOTAL17,14,200  9,50,000 40
  • 41.
    P & LCONTINUED  2001 RS  ADMN EXP 93250  S&DN EXP 190000  INT 8000  LOSS ON  SALE-M/C 2500  TAX 85000 N.P 259750  TOTAL 1538500  2002 RS  95980  209000  7000  800  168000  283420  1714200 41
  • 42.
    COMPARE & COMMENT ON THEP & L ACCOUNTS 42
  • 43.
  • 44.
    Summarized balance sheet ofAtlas cycles for 31/12/02 liabilities 31/12/20031/12/200 11 31/12/20031/12/200 22 assetsassets 31/12/200131/12/2001 31/12/200231/12/2002 S.CS.C 500000500000 500000500000 F.A.F.A. 450000450000 370000370000 RES&SRES&S 300000300000 310000310000 INVESINVES 5000050000 6000060000 P&LP&L 5600056000 6800068000 STOCSTOC KK 240000240000 210000210000 CRS.CRS. 168000168000 164000164000 DRS.DRS. 210000210000 455000455000 SEC.LOSEC.LO ------------------ 270000270000 CASHCASH 149000149000 197000197000 PRO-PRO- TAXTAX 7500075000 1000010000 TOTALTOTAL 10990001099000 12920001292000 10990001099000 12920001292000 44
  • 45.
    ADDITIONAL INFORMATION  1)INVESTMENTSCOSTING RS 8000/=SOLD DURING THE YEAR 2002 FOR RS8500  2)PROVISION FOR TAX IN 2002 RS 9000/=  3)FIXED ASSETS SOLD RS 12000/=BOOK VALUE RS10000/=PROFIT CREDITED TO P&L  4)DIVIDEND PAID RS 40,000/=  5)FROM THE ABOVE PREPARE A STATEMENT OF SOURCES AND APPLICATION OF FUNDS. 45
  • 46.
  • 47.
    Fund  Meaning offund:  What is it?  Cash and cash equivalent?  Investments of and/ or claims?  Of a business entity  Defining funds as “cash and cash equivalent “is somewhat limiting  Broadening the definition to include investments and claims against those investments-is a better definition. 47
  • 48.
    Fund Flow statement Is it sources and application of funds?  Does balance sheet satisfy the definition?  No.balance sheet shows the financial position as on a given date .It is a snapshot, static statement.  Flow is a dynamic concept, it traces the path ,the source and its flow , where it gets invested.It is a wgwgs –where got where gone statement  Balance sheet is stock of funds.changes in balance sheets –two-is the net flow. 48
  • 49.
    Fund flow –frombalance sheets  Source of funds  Any decrease in asset item  Any increase in claims(liability)  Uses of funds  Any increase in asset item.  Any decrease in claims 49
  • 50.
    Tips- tips -tips AssetAssetliabilityliability sourcesource __ ++ usesuses ++ __ 50
  • 51.
    Some questions?  Isincrease in cash a source or an application?  Bonus issue of shares ?  Retained earnings? 51
  • 52.
    Classification of ratios Structural point of view :  Balance sheet ratios: debt equity ratio, current ratio, quick ratio  Profit and Loss ratios: G.P. Ratio, N.P. Ratio ,turn over ratios  Composite ratios :ROE, RONW, ROCE, ROTA, TOTA, TOFA, TOWC, TODR, TOSTOCK, 52