Downloaded 128 times

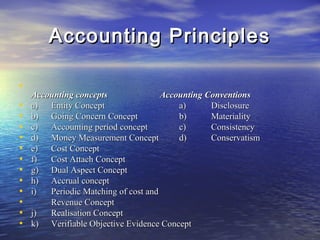

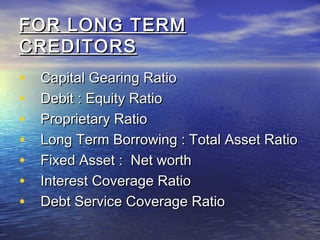

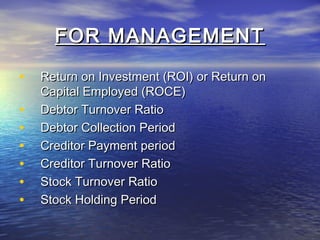
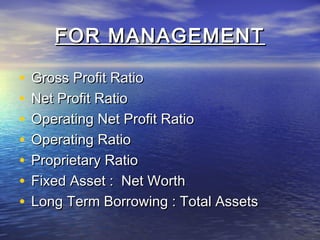

This document discusses the analysis of financial statements. It covers the meaning and nature of financial statements, their essential qualities and limitations. It also discusses various tools and techniques used for financial statement analysis, including comparative statements, common size statements, trend analysis, ratio analysis, and cash flow statements. The document provides examples of different types of ratios and how they can be used by various stakeholders like management, investors, creditors for analysis.


