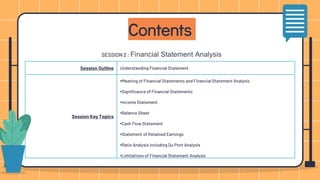
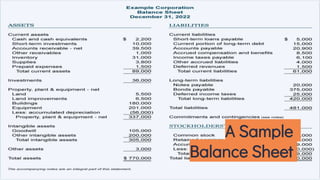
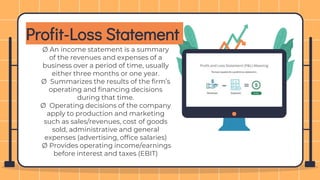
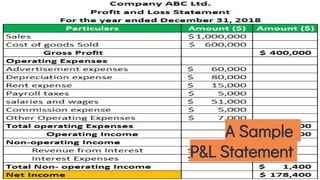
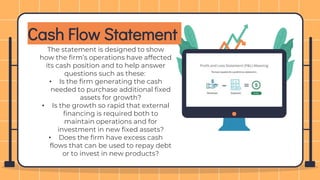
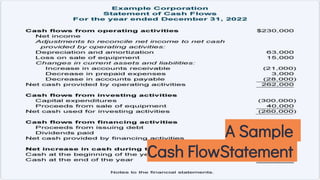
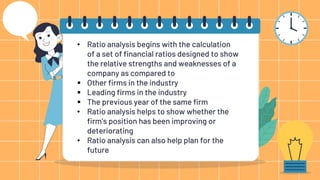
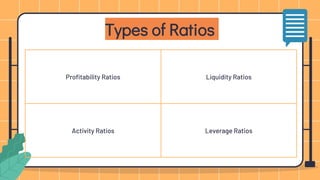
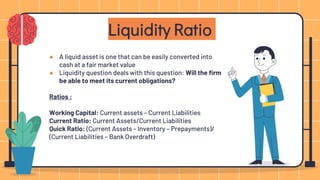
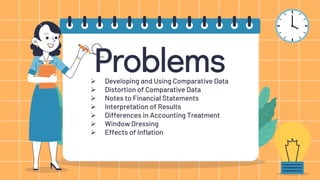
Finance Roles
Workshop
Udit Singh
MBA’24 – FMS DELHI ( SUMMER INTERNSHIP – BAIN AND COMPANY)
CFA LEVEL 2 CANDIDATE
INDUS INSIGHTS (1.5 YEARS)
DEUTSCHE BANK (6 MONTHS )
Session Outline Understanding Financial Statement
Session Key Topics
•Meaning of Financial Statements and Financial Statement Analysis
•Significance of Financial Statements
•Income Statement
•Balance Sheet
•Cash Flow Statement
•Statement of Retained Earnings
•Ratio Analysis including Du Pont Analysis
•Limitations of Financial Statement Analysis
SESSION 2 : Financial Statement Analysis
Contents
Meaning and
Significance of
Financial Statements
1
What is a
Financial
Statement
● Financial statements are summaries of the
operating, financing, and investment activities
of a firm.
● According to the Institute of Chartered
Accountant of India (ICAI) the financial
statements of a firm should provide sufficient
information that is useful to
○ investors
○ creditors
● The financial statements of publicly traded
firms must be audited at least annually by
independent public accountants.
Meaning of Financial Statements
● Financial statements summarize and provide an overview
of events relating to the functioning of a firm
● Financial statement analysis helps identify a firm’s
strengths and weaknesses so that management can take
advantage of a firm’s strengths and make plans to counter
the weaknesses of the firm
● The strengths must be understood if they are to be used to
proper advantage and weaknesses must be recognized if
corrective action needs to be taken
Significance of Financial Statements
 For example, are inventories adequate to
support the projected level of sales?
 Does the firm have too heavy an investment
in accounts receivable?
 Does large account receivable reflect a lax
collection policy?
 To ensure efficient operations of a firm’s
manufacturing facility, does the firm have
too much or too little investment in plant
and equipment?
Financial statement analysis provides
answers to all of these questions.
Financial Statements
and Reports
2
Financial Statements
Balance
Sheet
Profit and
Loss
Cash Flow
Statement
1
2
3
Balance Sheet
A summary of the assets, liabilities, and
equity of a business at a particular
point in time, usually at the end of the
firm’s fiscal year.
A Sample
Balance Sheet
Profit-Loss Statement
Ø An income statement is a summary
of the revenues and expenses of a
business over a period of time, usually
either three months or one year.
Ø Summarizes the results of the firm’s
operating and financing decisions
during that time.
Ø Operating decisions of the company
apply to production and marketing
such as sales/revenues, cost of goods
sold, administrative and general
expenses (advertising, office salaries)
Ø Provides operating income/earnings
before interest and taxes (EBIT)
A Sample
P&L Statement
Cash Flow Statement
The statement is designed to show
how the firm’s operations have affected
its cash position and to help answer
questions such as these:
• Is the firm generating the cash
needed to purchase additional fixed
assets for growth?
• Is the growth so rapid that external
financing is required both to
maintain operations and for
investment in new fixed assets?
• Does the firm have excess cash
flows that can be used to repay debt
or to invest in new products?
A Sample
Cash FlowStatement
Ratio Analysis
3
• Ratio analysis begins with the calculation
of a set of financial ratios designed to show
the relative strengths and weaknesses of a
company as compared to
 Other firms in the industry
 Leading firms in the industry
 The previous year of the same firm
• Ratio analysis helps to show whether the
firm’s position has been improving or
deteriorating
• Ratio analysis can also help plan for the
future
Types of Ratios
Profitability Ratios Liquidity Ratios
Activity Ratios Leverage Ratios
● A liquid asset is one that can be easily converted into
cash at a fair market value
● Liquidity question deals with this question: Will the firm
be able to meet its current obligations?
Ratios :
Working Capital: Current assets – Current Liabilities
Current Ratio: Current Assets/Current Liabilities
Quick Ratio: (Current Assets – Inventory – Prepayments)/
(Current Liabilities – Bank Overdraft)
Liquidity Ratio
● Activity ratio measures how effectively the firm is
managing/using its assets
● Do we have too much investment in assets or too little
investment in assets in view of current and projected
sales levels?
Ratios :
• Asset Turnover: Net Sales/Average Total Assets
• Inventory Turnover: Cost of Goods Sold/Average Ending
Inventory
• Average Collection Period: Average accounts Receivable
/Average daily net credit sales*
* Average daily net credit sales = net credit sales / 365
Activity Ratio
● Measures the riskiness of business in terms of debt
Gearing
Ratios :
• Debt/Equity ratio: Debt / Equity
• Debt/Total Assets ratio: Debt *100/Total Assets
• Equity ratio: Equity *100/Total Assets
• Times Interest Earned: Earnings before Interest and Tax /
Interest
Leverage Ratio
● Show the combined effect of liquidity, asset management,
and debt management on operating results
Ratios :
Gross Profit %: Gross Profit * 100 /Net Sales
Net Profit %: Net Profit after tax * 100/Net Sales
Return on Assets: Net Profit * 100/Average Total Assets
Return on Equity: Net Profit *100/Average Total Equity
Profitability Ratios
CREDITS: This presentation template was created by
Slidesgo, including icons by Flaticon, infographics &
images by Freepik
 Developing and Using Comparative Data
 Distortion of Comparative Data
 Notes to Financial Statements
 Interpretation of Results
 Differences in Accounting Treatment
 Window Dressing
 Effects of Inflation
Problems
Any
Questions

170723_UditSingh_Session 2_Financial_Statement_Analysis.pptx

  • 1.
    Finance Roles Workshop Udit Singh MBA’24– FMS DELHI ( SUMMER INTERNSHIP – BAIN AND COMPANY) CFA LEVEL 2 CANDIDATE INDUS INSIGHTS (1.5 YEARS) DEUTSCHE BANK (6 MONTHS )
  • 2.
    Session Outline UnderstandingFinancial Statement Session Key Topics •Meaning of Financial Statements and Financial Statement Analysis •Significance of Financial Statements •Income Statement •Balance Sheet •Cash Flow Statement •Statement of Retained Earnings •Ratio Analysis including Du Pont Analysis •Limitations of Financial Statement Analysis SESSION 2 : Financial Statement Analysis Contents
  • 3.
  • 4.
  • 5.
    ● Financial statementsare summaries of the operating, financing, and investment activities of a firm. ● According to the Institute of Chartered Accountant of India (ICAI) the financial statements of a firm should provide sufficient information that is useful to ○ investors ○ creditors ● The financial statements of publicly traded firms must be audited at least annually by independent public accountants. Meaning of Financial Statements
  • 6.
    ● Financial statementssummarize and provide an overview of events relating to the functioning of a firm ● Financial statement analysis helps identify a firm’s strengths and weaknesses so that management can take advantage of a firm’s strengths and make plans to counter the weaknesses of the firm ● The strengths must be understood if they are to be used to proper advantage and weaknesses must be recognized if corrective action needs to be taken Significance of Financial Statements
  • 7.
     For example,are inventories adequate to support the projected level of sales?  Does the firm have too heavy an investment in accounts receivable?  Does large account receivable reflect a lax collection policy?  To ensure efficient operations of a firm’s manufacturing facility, does the firm have too much or too little investment in plant and equipment? Financial statement analysis provides answers to all of these questions.
  • 8.
  • 9.
  • 10.
    Balance Sheet A summaryof the assets, liabilities, and equity of a business at a particular point in time, usually at the end of the firm’s fiscal year.
  • 11.
  • 12.
    Profit-Loss Statement Ø Anincome statement is a summary of the revenues and expenses of a business over a period of time, usually either three months or one year. Ø Summarizes the results of the firm’s operating and financing decisions during that time. Ø Operating decisions of the company apply to production and marketing such as sales/revenues, cost of goods sold, administrative and general expenses (advertising, office salaries) Ø Provides operating income/earnings before interest and taxes (EBIT)
  • 13.
  • 14.
    Cash Flow Statement Thestatement is designed to show how the firm’s operations have affected its cash position and to help answer questions such as these: • Is the firm generating the cash needed to purchase additional fixed assets for growth? • Is the growth so rapid that external financing is required both to maintain operations and for investment in new fixed assets? • Does the firm have excess cash flows that can be used to repay debt or to invest in new products?
  • 15.
  • 16.
  • 17.
    • Ratio analysisbegins with the calculation of a set of financial ratios designed to show the relative strengths and weaknesses of a company as compared to  Other firms in the industry  Leading firms in the industry  The previous year of the same firm • Ratio analysis helps to show whether the firm’s position has been improving or deteriorating • Ratio analysis can also help plan for the future
  • 18.
    Types of Ratios ProfitabilityRatios Liquidity Ratios Activity Ratios Leverage Ratios
  • 19.
    ● A liquidasset is one that can be easily converted into cash at a fair market value ● Liquidity question deals with this question: Will the firm be able to meet its current obligations? Ratios : Working Capital: Current assets – Current Liabilities Current Ratio: Current Assets/Current Liabilities Quick Ratio: (Current Assets – Inventory – Prepayments)/ (Current Liabilities – Bank Overdraft) Liquidity Ratio
  • 20.
    ● Activity ratiomeasures how effectively the firm is managing/using its assets ● Do we have too much investment in assets or too little investment in assets in view of current and projected sales levels? Ratios : • Asset Turnover: Net Sales/Average Total Assets • Inventory Turnover: Cost of Goods Sold/Average Ending Inventory • Average Collection Period: Average accounts Receivable /Average daily net credit sales* * Average daily net credit sales = net credit sales / 365 Activity Ratio
  • 21.
    ● Measures theriskiness of business in terms of debt Gearing Ratios : • Debt/Equity ratio: Debt / Equity • Debt/Total Assets ratio: Debt *100/Total Assets • Equity ratio: Equity *100/Total Assets • Times Interest Earned: Earnings before Interest and Tax / Interest Leverage Ratio
  • 22.
    ● Show thecombined effect of liquidity, asset management, and debt management on operating results Ratios : Gross Profit %: Gross Profit * 100 /Net Sales Net Profit %: Net Profit after tax * 100/Net Sales Return on Assets: Net Profit * 100/Average Total Assets Return on Equity: Net Profit *100/Average Total Equity Profitability Ratios
  • 23.
    CREDITS: This presentationtemplate was created by Slidesgo, including icons by Flaticon, infographics & images by Freepik  Developing and Using Comparative Data  Distortion of Comparative Data  Notes to Financial Statements  Interpretation of Results  Differences in Accounting Treatment  Window Dressing  Effects of Inflation Problems
  • 24.