This document provides an overview of financial statement analysis. It discusses the different types of financial statement analysis including horizontal analysis, vertical analysis, comparative statement analysis, trend analysis, common size analysis, funds flow analysis, cash flow statement analysis, and ratio analysis. It outlines the different ratios used in financial analysis including liquidity ratios, activity ratios, solvency/leverage ratios, and profitability ratios. It also discusses the different users of financial statement analysis and their interests including lenders, shareholders/investors, employees, regulatory agencies, and management.
Financial Statements :Nature, uses and limitations. Analysis and interpretations – meaning, procedure, objectives, and importance. Comparative statement, Common Size Statements and Trend Analysis - practical problems. Comparative financial statements are prepared by arranging financial data of two or more financial years in two side by side column.
Any financial statement that reports and comparison of data of two or more consecutive accounting periods are known as comparative financial statements.
Income statement or profit and loss account.
Financial ratios and their use in understanding Financial StatementsPranav Dedhia
An introduction and in-depth understanding on the importance of Financial ratios in understanding financial statements of business entities along with relevant examples
Financial ratios are created with the use of numerical values taken from financial statements to gain meaningful information about a company. The numbers found on a company’s financial statements – balance sheet, income statement, and cash flow statement – are used to perform quantitative analysis and assess a company’s liquidity, leverage, growth, margins, profitability, rates of return, valuation, and more.
Modes of Expression of Ratios:
Ratios may be expressed in any one or more of the following ways:
(a) Proportion,
(b) Rate or times
(c) Percentage.
Advantages of Ratio Analysis:
The information shown in financial statements does not signify anything individually because the facts shown are inter-related. Hence it is necessary to establish relationships between various items to reveal significant details and throw light on all notable financial and operational aspects. Ratio analysis caters to the needs of various parties interested in financial statements. The basic objective of ratio analysis is to help management in interpretation of financial statements to enable it to perform the managerial functions efficiently.
Limitations of Ratio Analysis:
Ratios are precious tools in the hands of management but the utility lies in the proper utilisation of ratios. Mishandling or misuse of ratios and using them without proper context may lead the management to a wrong direction. The financial analyst should be well versed in computing ratios and proper utilization of ratios. Like all techniques of control, ratio analysis also suffers from several ‘ifs and buts’ and for proper computation and utilization of ratios the analyst should be aware of the limitations of ratio analysis.
Uses and Users of Financial Ratio Analysis
Analysis of financial ratios serves two main purposes:
1. Track company performance
Determining individual financial ratios per period and tracking the change in their values over time is done to spot trends that may be developing in a company. For example, an increasing debt-to-asset ratio may indicate that a company is overburdened with debt and may eventually be facing default risk.
2. Make comparative judgments regarding company performance
Comparing financial ratios with that of major competitors is done to identify whether a company is performing better or worse than the industry average. For example, comparing the return on assets between companies helps an analyst or investor to determine which company is making the most efficient use of its assets.
Users of financial ratios include parties external and internal to the company:
External users: Financial analysts, retail investors, creditors, competitors, tax authorities, regulatory authorities, and industry observers
Internal users: Management team, employees, and owners
Francesca Gottschalk - How can education support child empowerment.pptxEduSkills OECD
Francesca Gottschalk from the OECD’s Centre for Educational Research and Innovation presents at the Ask an Expert Webinar: How can education support child empowerment?
A Strategic Approach: GenAI in EducationPeter Windle
Artificial Intelligence (AI) technologies such as Generative AI, Image Generators and Large Language Models have had a dramatic impact on teaching, learning and assessment over the past 18 months. The most immediate threat AI posed was to Academic Integrity with Higher Education Institutes (HEIs) focusing their efforts on combating the use of GenAI in assessment. Guidelines were developed for staff and students, policies put in place too. Innovative educators have forged paths in the use of Generative AI for teaching, learning and assessments leading to pockets of transformation springing up across HEIs, often with little or no top-down guidance, support or direction.
This Gasta posits a strategic approach to integrating AI into HEIs to prepare staff, students and the curriculum for an evolving world and workplace. We will highlight the advantages of working with these technologies beyond the realm of teaching, learning and assessment by considering prompt engineering skills, industry impact, curriculum changes, and the need for staff upskilling. In contrast, not engaging strategically with Generative AI poses risks, including falling behind peers, missed opportunities and failing to ensure our graduates remain employable. The rapid evolution of AI technologies necessitates a proactive and strategic approach if we are to remain relevant.
Macroeconomics- Movie Location
This will be used as part of your Personal Professional Portfolio once graded.
Objective:
Prepare a presentation or a paper using research, basic comparative analysis, data organization and application of economic information. You will make an informed assessment of an economic climate outside of the United States to accomplish an entertainment industry objective.
Read| The latest issue of The Challenger is here! We are thrilled to announce that our school paper has qualified for the NATIONAL SCHOOLS PRESS CONFERENCE (NSPC) 2024. Thank you for your unwavering support and trust. Dive into the stories that made us stand out!
Instructions for Submissions thorugh G- Classroom.pptxJheel Barad
This presentation provides a briefing on how to upload submissions and documents in Google Classroom. It was prepared as part of an orientation for new Sainik School in-service teacher trainees. As a training officer, my goal is to ensure that you are comfortable and proficient with this essential tool for managing assignments and fostering student engagement.
Honest Reviews of Tim Han LMA Course Program.pptxtimhan337
Personal development courses are widely available today, with each one promising life-changing outcomes. Tim Han’s Life Mastery Achievers (LMA) Course has drawn a lot of interest. In addition to offering my frank assessment of Success Insider’s LMA Course, this piece examines the course’s effects via a variety of Tim Han LMA course reviews and Success Insider comments.
Biological screening of herbal drugs: Introduction and Need for
Phyto-Pharmacological Screening, New Strategies for evaluating
Natural Products, In vitro evaluation techniques for Antioxidants, Antimicrobial and Anticancer drugs. In vivo evaluation techniques
for Anti-inflammatory, Antiulcer, Anticancer, Wound healing, Antidiabetic, Hepatoprotective, Cardio protective, Diuretics and
Antifertility, Toxicity studies as per OECD guidelines
Introduction to AI for Nonprofits with Tapp NetworkTechSoup
Dive into the world of AI! Experts Jon Hill and Tareq Monaur will guide you through AI's role in enhancing nonprofit websites and basic marketing strategies, making it easy to understand and apply.
How to Make a Field invisible in Odoo 17Celine George
It is possible to hide or invisible some fields in odoo. Commonly using “invisible” attribute in the field definition to invisible the fields. This slide will show how to make a field invisible in odoo 17.
2024.06.01 Introducing a competency framework for languag learning materials ...Sandy Millin
http://sandymillin.wordpress.com/iateflwebinar2024
Published classroom materials form the basis of syllabuses, drive teacher professional development, and have a potentially huge influence on learners, teachers and education systems. All teachers also create their own materials, whether a few sentences on a blackboard, a highly-structured fully-realised online course, or anything in between. Despite this, the knowledge and skills needed to create effective language learning materials are rarely part of teacher training, and are mostly learnt by trial and error.
Knowledge and skills frameworks, generally called competency frameworks, for ELT teachers, trainers and managers have existed for a few years now. However, until I created one for my MA dissertation, there wasn’t one drawing together what we need to know and do to be able to effectively produce language learning materials.
This webinar will introduce you to my framework, highlighting the key competencies I identified from my research. It will also show how anybody involved in language teaching (any language, not just English!), teacher training, managing schools or developing language learning materials can benefit from using the framework.
2. Financial Statement Analysis /FSA/
Financial analysis is a process of selecting, evaluating,
and interpreting financial data, along with other pertinent
information, in order to formulate an assessment of a
company’s present and future financial condition and
performance.
Financial analysis refers to an assessment of the
viability, stability and profitability of a business, sub-
business or project.
Financial analysis is also known as analysis and
interpretation of financial statements.
Interpretation means identifying relationship between
variables
3. Need for FSA
Financial statement analysis is used to identify the
trends and relationships between financial statement
items.
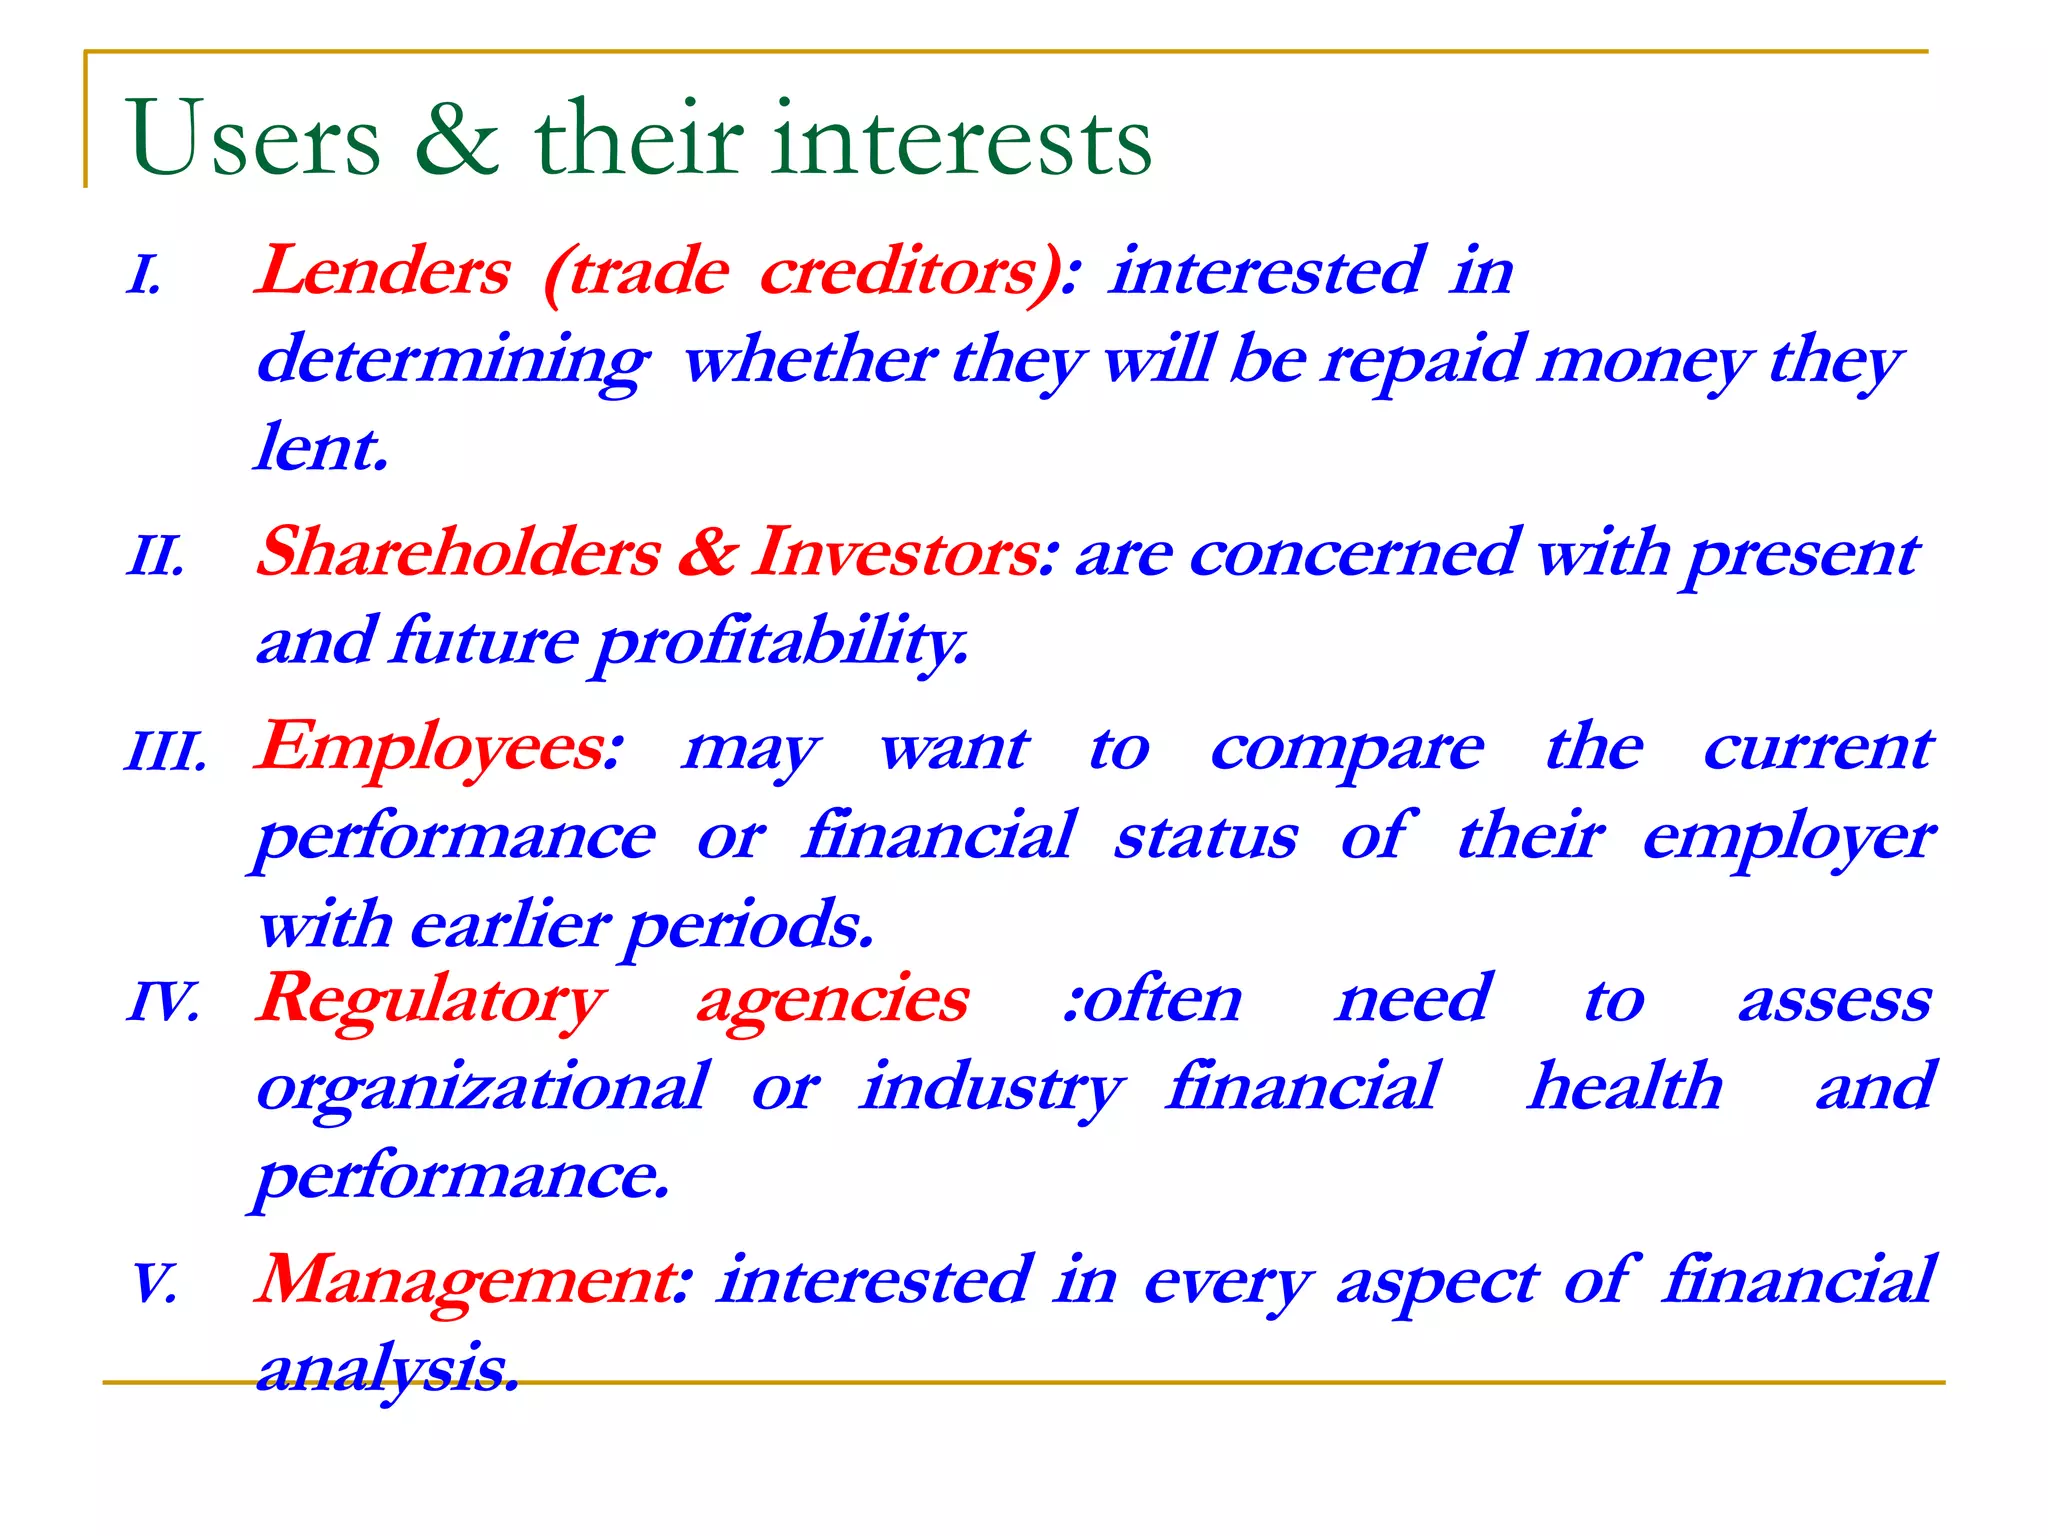
Both internal management and external users (such as
analysts, creditors, and investors) of the financial
statements need to evaluate a company's profitability,
liquidity, and solvency.
Nature of Analysis: The nature of the analysis depends
upon their [users] purpose or requirement. They [users]
make the necessary analysis and take the decision,
based on their assessment of the results obtained.
4. Users & their interests
I. Lenders (trade creditors): interested in
determining whether they will be repaid money they
lent.
II. Shareholders & Investors: are concerned with present
and future profitability.
III. Employees: may want to compare the current
performance or financial status of their employer
with earlier periods.
IV. Regulatory agencies :often need to assess
organizational or industry financial health and
performance.
V. Management: interested in every aspect of financial
analysis.
5. Types of financial statement analysis
Horizontal Analysis:
Here financial statements are compared
with several years.
Vertical Analysis:
Here, financial statements measure the
quantities relationship of the various items
in the financial statement on a particular
period.
It is also called as static analysis
6.
7. Comparative Statement Analysis
Include
Is an analysis of financial statement at different
period of time.
Helps to understand the comparative position of
financial and operational performance at different
period of time
Comparative Income Statement Analysis
Helps to understand the operational performance of the
business concern in a given period
Comparative Position Statement Analysis
Here elements of balance sheet are compared with
previous year’s figures.
8. Trend Analysis
Helps to understand the trend relationship with
various items, which appear in the financial
statements.
These percentages may also be taken as index
number showing relative changes in the financial
information resulting with the various period of
time.
In this analysis, only major items are considered
for calculating the trend percentage (e.g.
Deposits, advances, etc.)
9. Common Size Analysis
Here, figures reported are converted into
percentage to some common base.
In the balance sheet the total assets figures is
assumed to be 100 and all figures are
expressed as a percentage of this total.
It is one of the simplest methods of financial
statement analysis, which reflects the
relationship of each and every item with the
base value of 100%.
10. Funds Flow Analysis
This is one of the important tools, which is used
in many ways.
It helps to understand the changes in the
financial position of a business enterprise
between the beginning and ending financial
statement dates.
It is also called as statement of sources and
uses of funds.
11. Cash Flow Statement
is a statement which shows the sources of cash
inflow and uses of cash out-flow of the business
concern during a particular period of time.
Involves only short-term financial position of the
business concern.
It provides a summary of operating, investment
and financing cash flows and reconciles them
with changes in its cash and cash equivalents
such as marketable securities.
12. Ratio Analysis
Is a commonly used tool of financial statement
analysis.
Is a mathematical relationship between one
number to another number.
Is used as an index for evaluating the financial
performance of the business concern.
An accounting ratio shows the mathematical
relationship between two figures, which have
meaningful relation with each other. Ratio can
be classified into various types.
13. What can we do with financial ratios?
Standards of Comparisons
Amounts of ratio may be compared with industry
norms
Amounts or ratios may be compared with the
same measurement in a prior period
Amounts of ratio may be compared with same
measurement in a competitor’s organization
Amounts of ratio may be compared with planned or
budgeted amounts previously established
14. Ratio Analysis
From financial management view point, ratios
include:
A. Liquidity Ratio
B. Activity Ratio
C. Solvency Ratio
D. Profitability Ratio
E. Market Ratio
16. A. Liquidity Ratios
Also called as short-term ratio.
Help to understand the liquidity in a business
which is the potential ability to meet current
obligations.
This ratio expresses the relationship between
current assets and current liabilities of the
business concern during a particular period.
Include:
Current Ratio
Quick Ratio
18. B. Activity Ratios
Are also called turnover ratio.
Reflect firm’s efficiency in utilizing assets (the speed with
which various accounts are converted into sales or cash)
This ratio is helpful to understand the performance of the
business concern.
Some of the activity ratios are given below:
Inventory turnover ratio
Debtors (Receivables) turnover ratio
Creditors turnover ratio
Working Capital Ratios
Total Assets Turnover ratio
21. B. Activity Ratio
Creditors Turnover ratio: measures the number of times,
on average, the accounts payable are paid during a period
CTR =
𝑪𝒓𝒆𝒅𝒊𝒕 𝑷𝒖𝒓𝒄𝒉𝒂𝒔𝒆𝒔
𝑨𝒗𝒆𝒓𝒂𝒈𝒆 𝑷𝒂𝒚𝒂𝒃𝒍𝒆𝒔
Average Creditors payment Period (ACPP)
ACPP =
𝟑𝟔𝟓 𝒅𝒂𝒚𝒔
𝑪𝑻𝑹
Working Capital Turnover ratio (WCTR):It signifies that
how well a company is generating its sales with respect to the
working capital of the company
WCTR =
𝑁𝑒𝑡 𝑠𝑎𝑙𝑒𝑠
𝐴𝑣𝑒𝑟𝑎𝑔𝑒 𝑊𝐶
Working capital = Current Assets – Current liabilities
If last years WC is Br. 640,000, compute WCTR
22. B. Activity Ratio
Total Assets Turnover ratio:
Indicates the efficiency with which the firm uses
its assets to generate sales.
Formula:
Total Assets Turnover ratio=
𝑁𝑒𝑡 𝑆𝑎𝑙𝑒𝑠
𝑇𝑜𝑡𝑎𝑙 𝐴𝑠𝑠𝑒𝑡𝑠
23. C. Leverage or Solvency or Debt Ratios
It is also called as solvency ratio
Measures the long-term obligation of the
business.
Helps to understand, how the long-term funds
are used in the business
Indicates the amount of other people’s money
being used to generate profits.
Some of the solvency ratios are given below:
Debt-Equity Ratio
Debt Ratio
Interest Coverage Ratio
24. C. Solvency
DE Ratio indicates how much
debt a company is using to
finance its assets relative to the
amount of value represented in
SHE
25. D. Profitability Ratios
Profitability ratio helps to measure the
profitability position of the business concern.
Some of the major profitability ratios are given
below.
Gross Profit Margin Ratio
Net Profit Ratio
Operating Profit Margin Ratio
Return in Investment
Return on Equity
Earnings Per Share
26. Profitability Ratios
Gross Profit Margin Ratio
Operating Profit Margin Ratio
Net Profit Ratio
26
Sales
Net
Sold
Goods
of
Cost
-
Sales
Net
GPM
Sales
Net
Profit
Operating
OPR
Sales
Net
Pr Tax
After
ofit
NPM
Sales
Net
rs
Shareholde
Common
to
Available
Income
NPM
29. E. Market Ratios
These relate the firm’s market value, as
measured by its current share price, to certain
accounting values.
These ratios give insight into how well investors
in the market place fell the firm is doing in terms
of risk and return.
Include ratios such as:
Price/Earnings (P/E) Ratio
Market/Book (M/B) Ratio
37. BALANCE SHEET ANALYSIS Complete the balance sheet
and sales information using the following financial data:
Debt ratio:
Current ratio:
Total assets turnover:
Days sales outstanding:
50%
1.8×
1.5×
36.5 days*
Gross profit margin on sales: (Sales − Cost of goods sold)/Sales ¼ or 25%
Inventory turnover ratio: 5×
* Calculation is based on a 365-day year.
Balance Sheet
Cash Accounts payable
Accounts receivable Long-term debt 60,000
Inventories Common stock
Fixed assets Retained earnings 97,500
Total assets $300,000 Total liabilities and equity
Sales Cost of goods sold