Downloaded 139 times


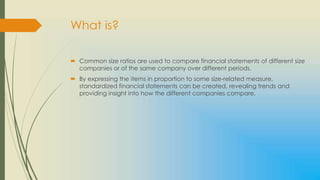
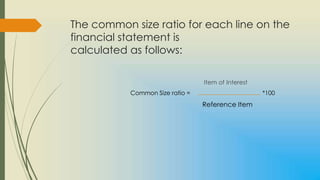

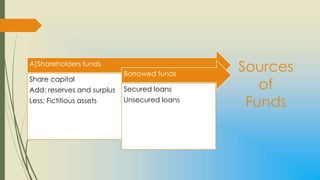
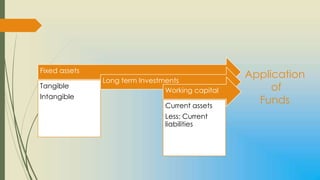
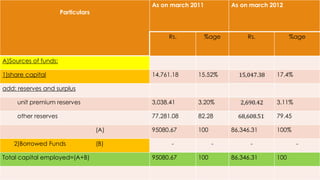
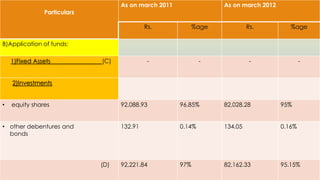
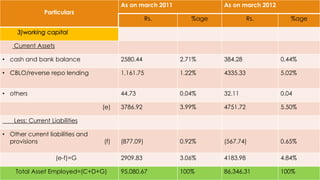
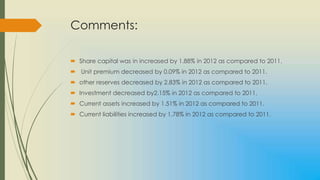


Vertical common size balance sheets are presented for HDFC Mutual Fund for the financial years 2011 and 2012. Key points include: 1) Share capital increased slightly while reserves decreased from 2011 to 2012. 2) Investments decreased as a percentage of total funds from 97% to 95.15% over the period. 3) Current assets increased from 3.99% to 5.50% of total funds while current liabilities also increased slightly. The vertical common size balance sheets allow comparison of line items as a percentage of total funds employed for the two periods.