Download to read offline


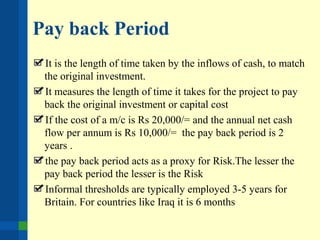


The document outlines the importance of financial analysis in decision making, detailing tools and techniques to assess project viability. It emphasizes key financial metrics such as net cash flow, payback period, net present value (NPV), and internal rate of return (IRR), providing examples of their calculations. Additionally, it discusses company objectives, current situations, available solutions, and the process for making informed strategic recommendations.


![Cap budget [autosaved]](https://cdn.slidesharecdn.com/ss_thumbnails/capbudgetautosaved-111120050918-phpapp01-thumbnail.jpg?width=640&height=640&fit=bounds)


![5) capital_budgeting_(1)_-(2)[1].ppt.pdf](https://cdn.slidesharecdn.com/ss_thumbnails/5capitalbudgeting121-250323135834-146732f6-thumbnail.jpg?width=640&height=640&fit=bounds)


