1. Introduction Experimental Design
Gene expression profiling is being widely applied in cancer
research to identify biomarkers for clinical endpoint prediction
such as diagnosis, prognosis, or prediction of therapeutic
response. The advent of RNA deep sequencing (RNA-Seq)
technologies has revolutionized eukaryotic transcriptome analysis
by providing the ability to decipher global gene expression
patterns beyond the limitation of microarrays, including the ability
to discover novel genes and splice variants. However, data
generated by the Sequencing Quality Control (SEQC) consortium
has shown that RNA-Seq and microarray-based gene expression
models are comparable in clinical endpoint prediction
performance, even when the additional information unique to
RNA-Seq is included in the prediction models.
In order to understand and characterize the reproducibility and
validity of gene expression experiments, exogenous RNA spike-in
controls and associated ratio performance metrics have been
introduced by the External RNA Controls Consortium (ERCC). The
ERCC developed a library of 96 exogenous control transcripts from
synthetic or bacterial sequences that are spiked into RNA at
defined abundances and ratios, providing data that measures the
technical performance of gene expression profiling methods.
Scientists from the National Institute of Standards and Technology
(NIST) have created a Bioconductor software tool called
“ERCCdashboard” that produces ERCC performance metrics from
expression values such as microarray signals or RNA-Seq read
counts. Using the ERCC spike-in control transcripts and the
“ERCCdashboard” analysis tool, we compare the performance of
Agilent gene expression microarray and Agilent RNA-Seq
platforms run with the same total RNA samples, and highlight
performance differences between the two different Agilent gene
expression measurement technologies.
Using ERCC Spike-In Control Transcripts Provides Confidence in Agilent Microarray and RNA-Seq Gene Expression Data
Anne Bergstrom Lucas, Namrata Joglekar, Bilan Hsue, Bahram Arezi, Mary Napier, Paul Wolber and Scott Happe
Agilent Technologies Genomics R&D, Santa Clara, California
ERCC RNA Ratio/Abundance in Mixtures
Two mixtures (Mix 1 and Mix 2) were prepared from 92 ERCC RNA
control transcripts that were placed in different subpools (a to d) in four
defined abundance ratios of 4:1, 1:2, 1:1.5 and 1:1 between the mixtures
(Figure a). Within each subpool there are 23 controls that span a large
dynamic range of 220 or 6 orders of magnitude (Figure b). These ERCC
control transcript mixes are technology-independent and can be spiked
into the RNA at the beginning of any gene expression analysis
experiment. (Munro, S., et al. Assessing technical performance in
differential gene expression experiments with external spike-in RNA
control ratio mixtures. (2014) Nature Communications, 5:5125)
The technology-independent spike-in control
transcripts developed by the ERCC can serve as a
truth set to benchmark the accuracy of endogenous
transcript ratio measurements.
The ERCCdashboard tool enables rapid, reproducible,
and automated analysis of the ERCC spike-in control
transcripts in any differential expression experiment.
The ERCC controls demonstrate that both the Agilent
One-Color Gene Expression Microarray platform and
the Agilent RNA WT NGS platform can generate
linear gene expression data spanning 5 orders of
magnitude with the ability to detect sensitive 1.5-fold
changes at levels as low as:
36 counts with the microarray workflow
55 mapped reads with the RNA-Seq workflow
For Research Use Only. Not for use in diagnostic procedures.
This figure demonstrates the ability of each platform to detect small changes
in ERCC spike-in concentration between the UHRR and HBRR samples. Shown
are the average fluorescence intensity (microarrays) or the average counts
(RNA-Seq) versus the differential expression test P-values calculated by the
ERCCdashboard program. The heavy black dashed line indicates the false
discovery rate (FDR) cutoff of FDR = 0.01 chosen for this analysis. Colored
arrows indicate the LODR estimate (average intensity or average counts) for
each fold change that crosses the line indicating the upper boundary of the
90% confidence interval. LODR results and confidence intervals derived from
the plots are shown in the annotation tables below the plots.
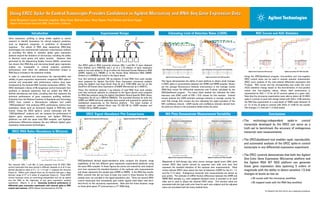
ERCCdashboard derived signal-abundance plots compare the dynamic range
capabilities of the two different gene expression experimental platforms using
the same RNA samples. In these figures the points are colored by ratio subpool,
error bars represent the standard deviation of the replicate ratio measurements,
and shape represents the sample type (UHRR or HBRR). In the RNA-Seq results,
ERCC controls that did not have at least one count in three libraries for either
sample were not included in the signal-abundance plot. There are several ERCC
control transcripts that consistently give outlier signals (ERCC-00022, ERCC-00131,
ERCC-00144) on the microarray experiments. Note that the linear dynamic range
on these plots spans 220 (microarrays) or 216 (RNA-Seq).
Agilent Gene Expression Microarrays Agilent SureSelect WT RNA-Seq NGS
Using the ERCCdashboard program, true-positive and true-negative
ERCC control ratios can be used in receiver operator characteristic
(ROC) curve analysis of the rank-ordered differential expression test
P-values. ROC curves and the corresponding area under the curve
(AUC) statistics change based on the discrimination of true-positive
values and true-negative values, where ideal performance is
represented by AUC = 1.0 for all 23 controls spiked at a given ratio.
Note that the microarray experiments were able to detect all 23 ERCC
spike-in controls at each fold change tested with AUCs >0.90 whereas
the RNA-Seq experiments at a read depth of 100M reads detected 16
(or 17) of the 23 spike-in controls with AUCs of <0.90 for the smaller
fold changes (1:2 fold and 1:1.5 fold) tested.
ERCC Signal-Abundance Plot Comparisons
Estimating Limit of Detection Rates (LODR)
MA Plots Demonstrate Measurement Variability Conclusions
Magnitude of fold-change (log ratio) versus average signal/count (MA) plots
contain ERCC data points colored by expected ratio with error bars that
represent the standard deviation of the replicate ratio measurements. Filled
circles indicate ERCC ratios above the limit of detection (LODR) for the 4:1, 1:2,
and the 1:1.5 ratios. Endogenous transcript ratio measurements are shown as
gray points. The estimate of mRNA fraction differences between the UHRR and
HBRR RNA samples (rm) with weighted standard errors is provided in an inset
table and is used to adjust the nominal ERCC ratios. The nominal ratios are
annotated with the light solid color lines for each ratio subpool and the adjusted
ratios are annotated with the heavy dashed lines.
Agilent Gene Expression Microarrays Agilent SureSelect WT RNA-Seq NGS
ROC Curves and AUC Statistics
Agilent Gene Expression Microarrays Agilent SureSelect WT RNA-Seq NGS
Agilent Gene Expression Microarrays Agilent SureSelect WT RNA-Seq NGS
Two ERCC spike-in RNA transcript mixtures (Mix 1 and Mix 2) were obtained
from Ambion (p/n 4456739) and 2 µl of a 1:10 dilution of each respective
spike-in mix was added to 10 µg of either the Universal Human Reference RNA
(UHRR, Agilent p/n 740000) or to the Human Brain Reference RNA (HBRR,
Ambion p/n AM6050) as noted in the figure above.
Four (4x) technical replicate 100 ng aliquots of total RNA from each sample
were prepared for Agilent One-Color Gene Expression microarray analysis
using the Agilent Low Input Quick Amp kit (p/n 5190-2305) and run on the
SurePrint G3 Human Gene Expression v3 8x60K Microarrays (p/n G4851C).
Three (3x) technical replicate 2 µg aliquots of total RNA from each sample
(one less technical replicate as compared to the figure above) were prepared
for RNA-Seq analysis using the Agilent SureSelect Strand-Specific RNA Library
Preparation Kit kit (p/n G9691A/G9692A). The barcoded libraries for both the
UHRR and HBRR technical replicates were pooled and prepared for paired-end
multiplexed sequencing on the Illumina platform. The mean number of
mapped reads per indexed library was 151,155,130 for UHRR samples and
115,602,753 for HBRR samples.
ERCC Mix 1 ERCC Mix 2
UHRR HBRR
ERCC-00022
ERCC-00131
ERCC-00144