Downloaded 75 times
![Sample to Insight
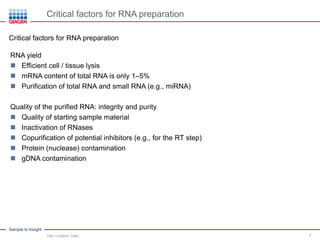
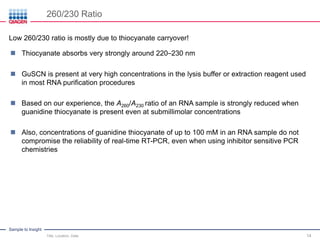
Challenges of gDNA contaminations
Title, Location, Date 20
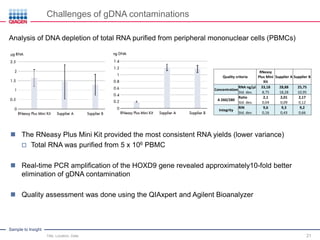
1. DNase treatment
a. On-membrane / on-bead
b. In solution (more efficient than on-membrane, esp. for large amounts of DNA
[mainly for sterical reasons])
2. Chemical separation of DNA and RNA
a. organic extraction – acid phenol / chloroform (e.g., QIAzol, …)
b. specific binding to solid matrix (e.g., RNeasy Plus, gDNA Eliminator)
3. DNA removal as part of cDNA synthesis protocol
a. e.g., QT Reverse Transcription kit
Combinations of different methods are possible
e.g., 1a. + 2a. or 2b. + 3., etc.
Different ways to eliminate genomic DNA](https://image.slidesharecdn.com/rnaintegrityquality-160106174212/85/RNA-Integrity-and-Quality-Standardize-RNA-Quality-Control-20-320.jpg)
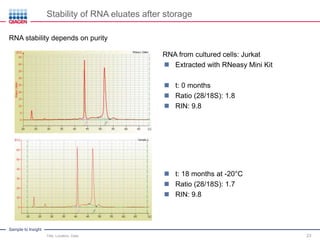
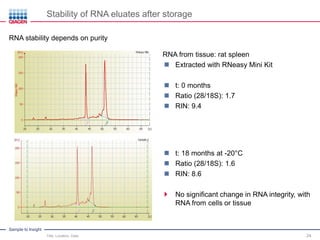
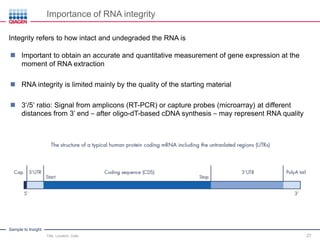
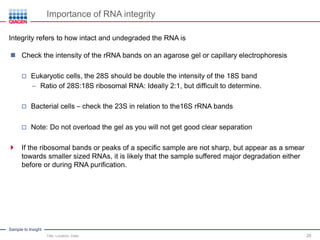
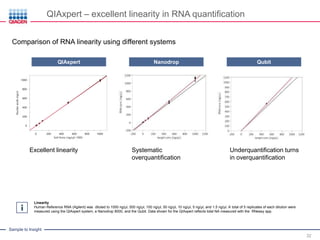
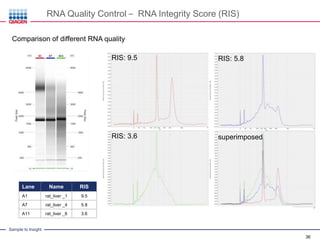
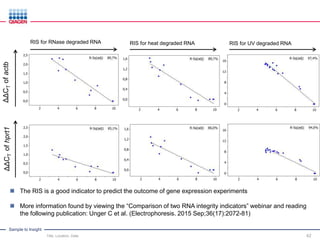
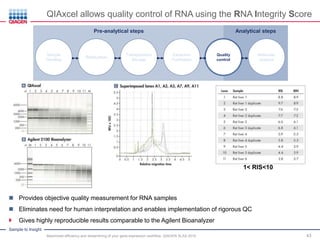

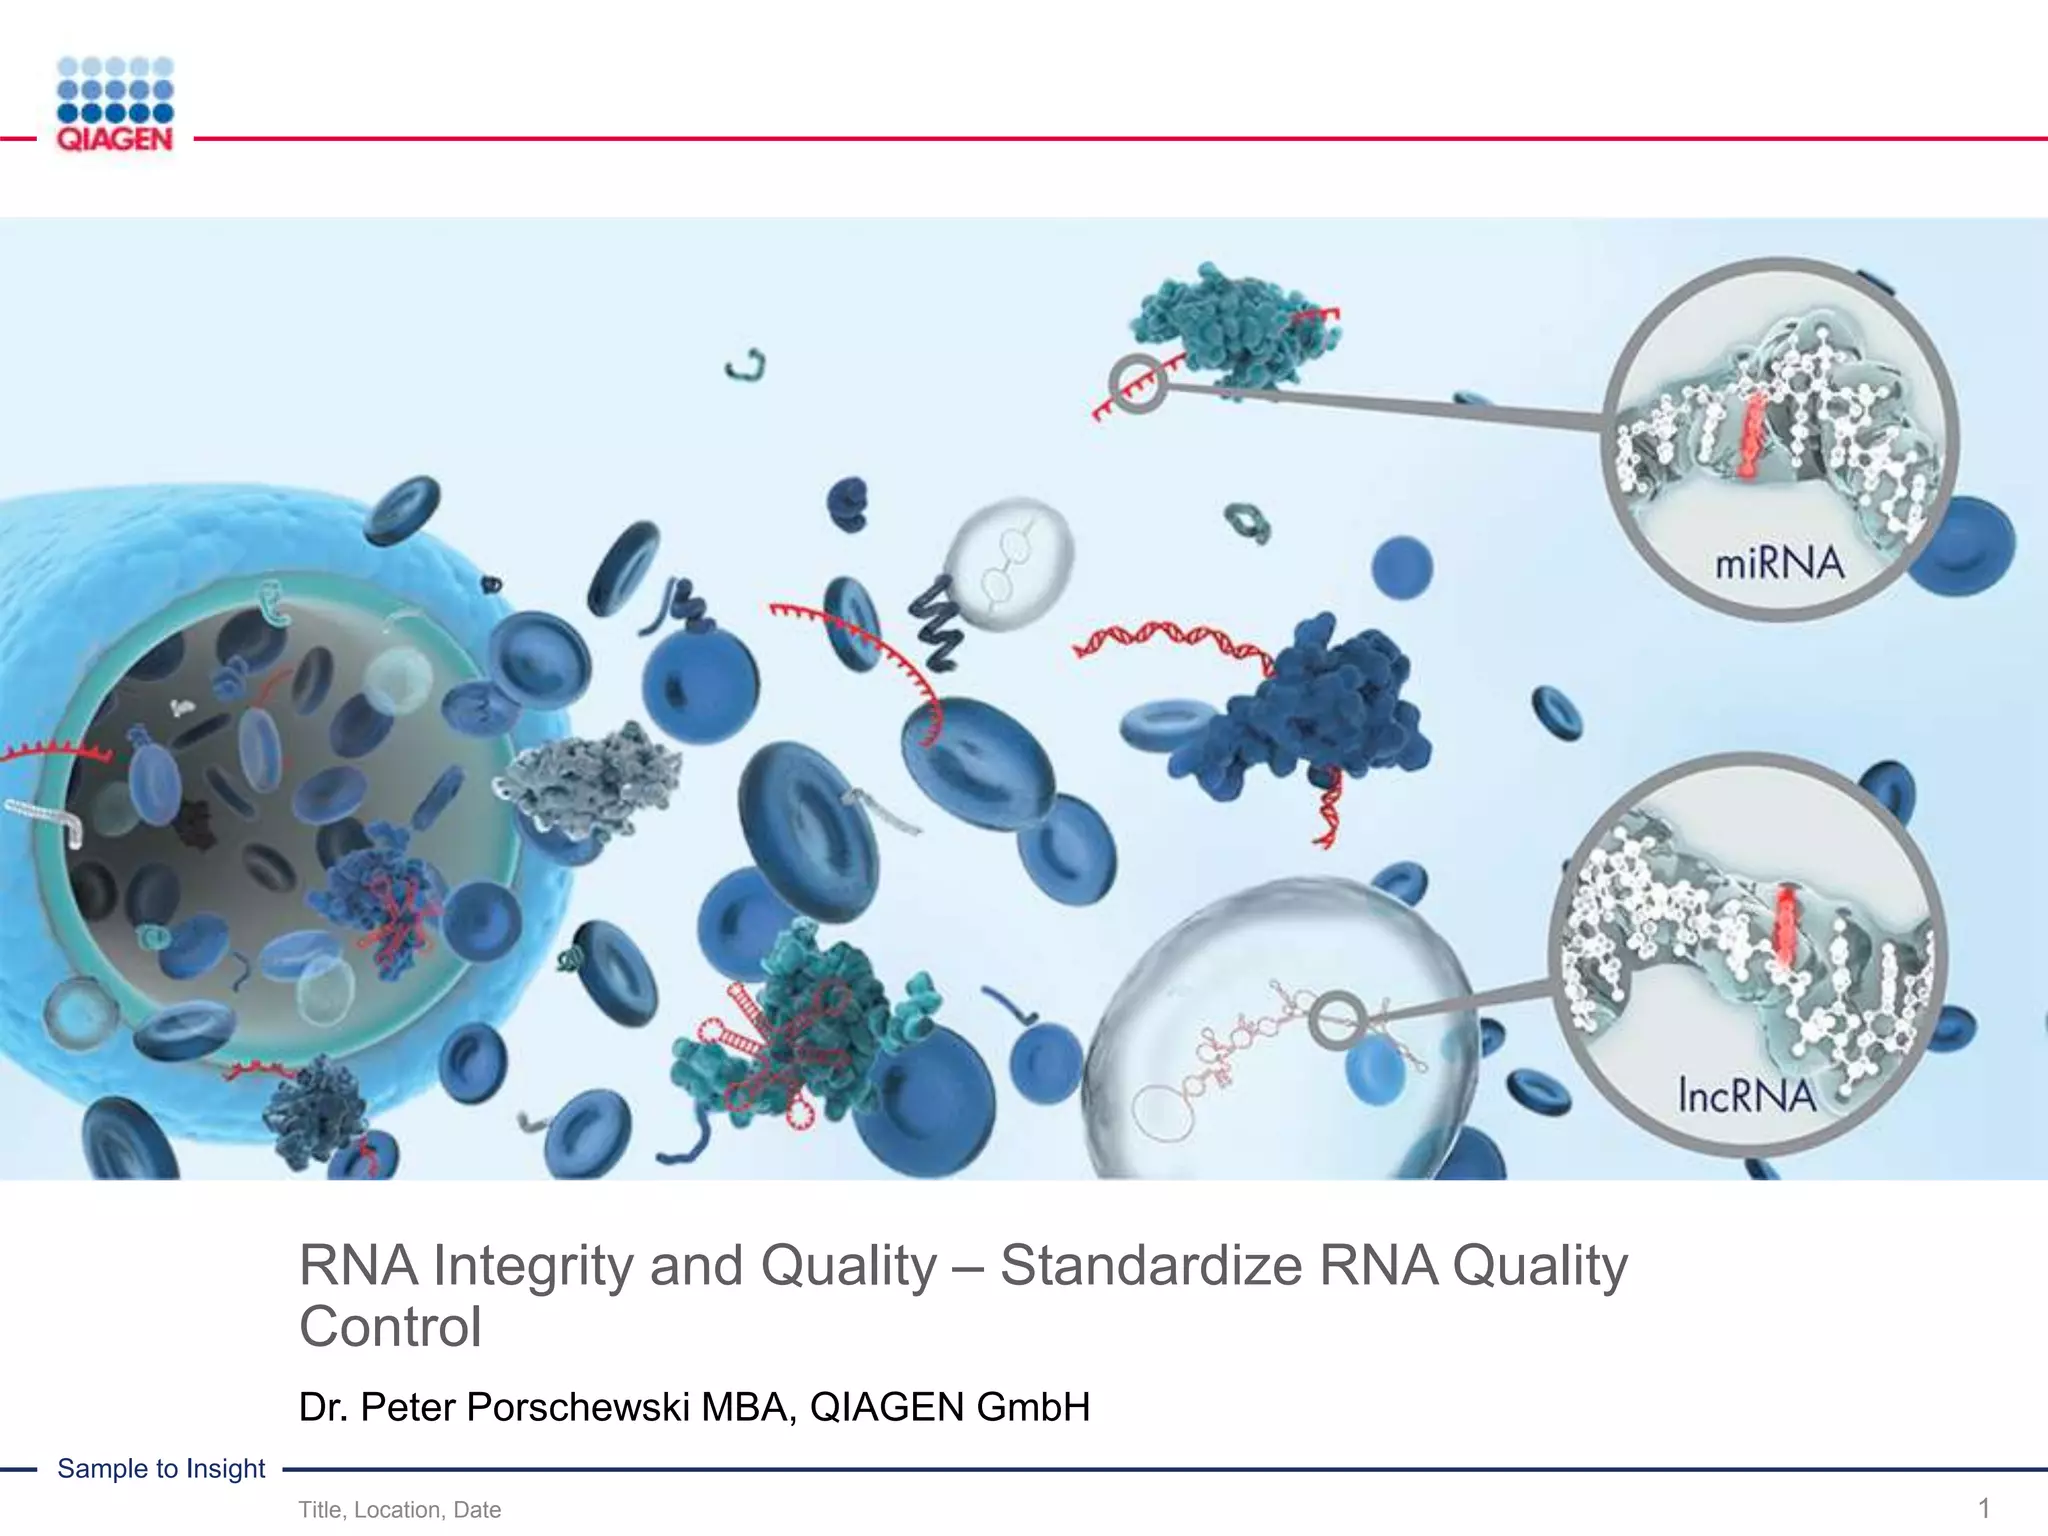
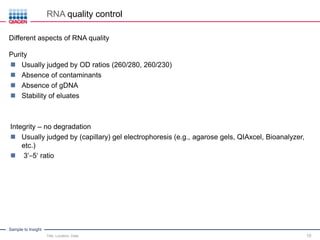
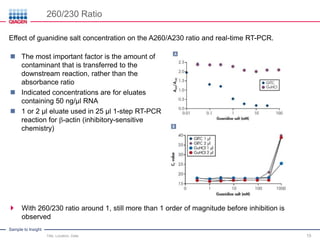
This document discusses RNA quality control and integrity. It emphasizes that RNA integrity is critical for obtaining accurate gene expression measurements. The RNA Integrity Number (RIN) provides a standardized score to assess RNA integrity based on capillary electrophoresis. Maintaining high RNA purity and avoiding degradation are important to ensure stable RNA samples that can be reliably stored. The QIAxpert system allows comprehensive RNA quality control by assessing concentration, purity, integrity, and contaminants in a single analysis.