Download to read offline
![REVIEW Open Access
EEG seizure detection and prediction algorithms:
a survey
Turkey N Alotaiby1
, Saleh A Alshebeili2
, Tariq Alshawi3
, Ishtiaq Ahmad4
and Fathi E Abd El-Samie5,6*
Abstract
Epilepsy patients experience challenges in daily life due to precautions they have to take in order to cope with this
condition. When a seizure occurs, it might cause injuries or endanger the life of the patients or others, especially
when they are using heavy machinery, e.g., deriving cars. Studies of epilepsy often rely on electroencephalogram
(EEG) signals in order to analyze the behavior of the brain during seizures. Locating the seizure period in EEG
recordings manually is difficult and time consuming; one often needs to skim through tens or even hundreds of hours
of EEG recordings. Therefore, automatic detection of such an activity is of great importance. Another potential usage
of EEG signal analysis is in the prediction of epileptic activities before they occur, as this will enable the patients (and
caregivers) to take appropriate precautions. In this paper, we first present an overview of seizure detection and
prediction problem and provide insights on the challenges in this area. Second, we cover some of the state-of-the-art
seizure detection and prediction algorithms and provide comparison between these algorithms. Finally, we conclude
with future research directions and open problems in this topic.
1 Review
1.1 Introduction
Epilepsy, which is classified as a neurological disorder
that affects the brain, impacts about 2% of the world
population leading to a reduction in their productivity
and imposing restrictions on their daily life [1]. Diagno-
sis of epilepsy is done by analyzing electroencephalo-
gram (EEG) signals, as well as patient behavior. EEG
signals have two types: scalp EEG and intracranial EEG
(iEEG). Scalp EEG signals are usually collected with elec-
trodes placed on the scalp using some sort of conductive
gel after treating the scalp area with light abrasion in
order to decrease the impedance resulting from dead
skin cells. Commonly, 19 recording electrodes in
addition to a ground and system reference are placed on
the scalp area according to specifications by the Inter-
national 10–20 system. However, fewer electrodes are
used when the EEG signals are recorded for neonates
[2]. Each of these electrodes collects an EEG signal,
which is centrally recorded for post-processing. On the
other hand, in iEEG, electrodes are placed directly on
the exposed surface of the brain during a surgery to rec-
ord electrical activity from the cerebral cortex. For the
seizure detection task in the case of epilepsy patients, it
is required to analyze these EEG signals towards a deci-
sion of the existence, or absence, of an epileptic seizure.
If a seizure exists, further analysis could be made for
more understanding of seizure behavior. Most of the re-
search work in the field of seizure detection depends on
scalp EEG signals, which are acquired with non-invasive
techniques. So, we will adopt the term EEG to refer to
scalp EEG throughout the paper.
The seizure detection process can be made on a
single- or multi-channel basis [3,4]. Single-channel seiz-
ure detection requires selecting the channel containing
the strongest EEG signal collected from the closest point
to the seizure spot. This selection process depends
mainly on activity measures evaluated for the different
channels instantaneously such as the local variance. A
better treatment to the seizure detection issue depends
on incorporating the information from all EEG signals
available into the seizure detection process through data
fusion, or multi-channel processing techniques [5].
Several studies have been conducted on EEG seizure
detection [3,4]. To perform seizure detection on time-
domain waveforms, there is a need to create models for
the EEG signals, from which features are extracted,
* Correspondence: fathi_sayed@yahoo.com
5
KACST-TIC in Radio Frequency and Photonics for the e-Society (RFTONICS),
King Saud University, Riyadh 11362, Saudi Arabia
6
Faculty of Electronic Engineering, Menoufia University, Menouf, 32952, Egypt
Full list of author information is available at the end of the article
© 2014 Alotaiby et al.; licensee Springer. This is an Open Access article distributed under the terms of the Creative Commons
Attribution License (http://creativecommons.org/licenses/by/4.0), which permits unrestricted use, distribution, and reproduction
in any medium, provided the original work is properly credited.
Alotaiby et al. EURASIP Journal on Advances in Signal Processing 2014, 2014:183
http://asp.eurasipjournals.com/content/2014/1/183](https://image.slidesharecdn.com/alotaiby2014articleeegseizuredetectionandpredicti-180924030524/85/Alotaiby2014-article-eeg_seizure_detectionandpredicti-1-320.jpg)
![REVIEW Open Access
EEG seizure detection and prediction algorithms:
a survey
Turkey N Alotaiby1
, Saleh A Alshebeili2
, Tariq Alshawi3
, Ishtiaq Ahmad4
and Fathi E Abd El-Samie5,6*
Abstract
Epilepsy patients experience challenges in daily life due to precautions they have to take in order to cope with this
condition. When a seizure occurs, it might cause injuries or endanger the life of the patients or others, especially
when they are using heavy machinery, e.g., deriving cars. Studies of epilepsy often rely on electroencephalogram
(EEG) signals in order to analyze the behavior of the brain during seizures. Locating the seizure period in EEG
recordings manually is difficult and time consuming; one often needs to skim through tens or even hundreds of hours
of EEG recordings. Therefore, automatic detection of such an activity is of great importance. Another potential usage
of EEG signal analysis is in the prediction of epileptic activities before they occur, as this will enable the patients (and
caregivers) to take appropriate precautions. In this paper, we first present an overview of seizure detection and
prediction problem and provide insights on the challenges in this area. Second, we cover some of the state-of-the-art
seizure detection and prediction algorithms and provide comparison between these algorithms. Finally, we conclude
with future research directions and open problems in this topic.
1 Review
1.1 Introduction
Epilepsy, which is classified as a neurological disorder
that affects the brain, impacts about 2% of the world
population leading to a reduction in their productivity
and imposing restrictions on their daily life [1]. Diagno-
sis of epilepsy is done by analyzing electroencephalo-
gram (EEG) signals, as well as patient behavior. EEG
signals have two types: scalp EEG and intracranial EEG
(iEEG). Scalp EEG signals are usually collected with elec-
trodes placed on the scalp using some sort of conductive
gel after treating the scalp area with light abrasion in
order to decrease the impedance resulting from dead
skin cells. Commonly, 19 recording electrodes in
addition to a ground and system reference are placed on
the scalp area according to specifications by the Inter-
national 10–20 system. However, fewer electrodes are
used when the EEG signals are recorded for neonates
[2]. Each of these electrodes collects an EEG signal,
which is centrally recorded for post-processing. On the
other hand, in iEEG, electrodes are placed directly on
the exposed surface of the brain during a surgery to rec-
ord electrical activity from the cerebral cortex. For the
seizure detection task in the case of epilepsy patients, it
is required to analyze these EEG signals towards a deci-
sion of the existence, or absence, of an epileptic seizure.
If a seizure exists, further analysis could be made for
more understanding of seizure behavior. Most of the re-
search work in the field of seizure detection depends on
scalp EEG signals, which are acquired with non-invasive
techniques. So, we will adopt the term EEG to refer to
scalp EEG throughout the paper.
The seizure detection process can be made on a
single- or multi-channel basis [3,4]. Single-channel seiz-
ure detection requires selecting the channel containing
the strongest EEG signal collected from the closest point
to the seizure spot. This selection process depends
mainly on activity measures evaluated for the different
channels instantaneously such as the local variance. A
better treatment to the seizure detection issue depends
on incorporating the information from all EEG signals
available into the seizure detection process through data
fusion, or multi-channel processing techniques [5].
Several studies have been conducted on EEG seizure
detection [3,4]. To perform seizure detection on time-
domain waveforms, there is a need to create models for
the EEG signals, from which features are extracted,
* Correspondence: fathi_sayed@yahoo.com
5
KACST-TIC in Radio Frequency and Photonics for the e-Society (RFTONICS),
King Saud University, Riyadh 11362, Saudi Arabia
6
Faculty of Electronic Engineering, Menoufia University, Menouf, 32952, Egypt
Full list of author information is available at the end of the article
© 2014 Alotaiby et al.; licensee Springer. This is an Open Access article distributed under the terms of the Creative Commons
Attribution License (http://creativecommons.org/licenses/by/4.0), which permits unrestricted use, distribution, and reproduction
in any medium, provided the original work is properly credited.
Alotaiby et al. EURASIP Journal on Advances in Signal Processing 2014, 2014:183
http://asp.eurasipjournals.com/content/2014/1/183](https://image.slidesharecdn.com/alotaiby2014articleeegseizuredetectionandpredicti-180924030524/75/Alotaiby2014-article-eeg_seizure_detectionandpredicti-1-2048.jpg)
![because treating the signal as discrete-time sequence is
not a robust approach for extracting characterizing fea-
tures. Some algorithms create models for normal and ab-
normal EEG signals of the patients and use these models
in the training process. New signals are tested against these
models leading to the decision of seizure or non-seizure
activities. Most of the time-domain seizure detection algo-
rithms are patient specific; that is, they are applied to the
patient for which training data are extracted. This is intui-
tively meaningful as each patient has a different nature for
his/her EEG signals.
Efforts have also been made to develop seizure predic-
tion algorithms [6,7]. Note that with seizure prediction,
it is possible to alert ambulatory patients or caregivers
before seizure occurs and causes injury. In addition, seiz-
ure prediction could initiate time-sensitive clinical proce-
dures necessary for characterizing epileptic syndromes. It
could, also, help in initiating delivery of therapy early
enough to attenuate seizure attack and reduce its duration
or may even terminate it completely. The endeavor to-
wards fast and simple seizure prediction algorithms has
led to the development of a variety of algorithms which
will be covered in this paper.
Signal processing has shown a breakthrough with the
evolution of several discrete transforms and signal de-
composition techniques, because all of these transforms
and decompositions have their unique nature. For ex-
ample, the discrete Fourier transform (DFT) and discrete
wavelet transform (DWT) have found popularity in seiz-
ure detection and prediction applications. Similarly, the
singular value decomposition (SVD) and empirical mode
decomposition (EMD) have also found a role in these
applications. Even the principal component analysis
(PCA) and the independent component analysis (ICA)
have found a pre-processing noise removal role in these
applications.
Several attempts have been presented in the literature
to classify EEG seizure detection and prediction methods.
For example, classification into linear and non-linear
methods considers variance-based, correlation-based, and
simple power spectrum-based methods as linear methods
and all other methods as non-linear methods [8-10]. We
did not adopt this classification as most of the reviewed
methods in this paper are non-linear techniques. Another
classification for seizure detection and prediction methods
depends on the type of EEG signals used: whether scalp
EEG or iEEG. We mentioned in this paper the type of
database used for testing each method and the type of the
signals in the database.
Tzallas et al. presented a classification of EEG seizure
detection methods into pattern recognition methods,
morphological analysis methods, parametric methods,
decomposition methods, clustering methods, and data
mining methods [11]. In this paper, we review some of
the recently developed seizure detection and prediction
algorithms along with a comparison study between them
adopting another basis for classification of seizure detec-
tion and prediction methods depending on the trans-
form domain of operation. It seems that seizure detection
and prediction are two different trends, but we look at
them from a signal processing perspective with different
transform domains. We investigate in our description and
classification in this paper the most important seizure de-
tection and prediction algorithms operating in each trans-
form domain. Figure 1 shows a classification of the seizure
detection and prediction methods based on the processing
domain.
Therefore, we organize the paper as follows. We first
begin by the most common methods for seizure detec-
tion and prediction: time-domain methods, which are
addressed in Section 1.2. Section 1.3 is devoted to
frequency-domain seizure detection methods. Wavelet-
domain seizure detection and prediction methods are
covered in Section 1.4. Sections 1.5 and 1.6 are devoted
for seizure detection methods that are based on the
EMD and the SVD, respectively. Section 1.7 presents the
role of ICA and PCA in seizure detection. A comparison
study illustrating seizure detection and prediction
methods is given in Section 2.
1.2 Time-domain methods
In general, local activities of EEG waveforms vary from
patient to patient; therefore, seizure detection and pre-
diction algorithms are preferred to be patient specific.
Seizure
DetecƟon
and
PredicƟon
Wavelet domain
Frequency
domain
Singular value
decomposiƟon
Empirical mode
decomposiƟon
PCA and ICA
domain
Time domain
Figure 1 Classification of seizure detection and
prediction methods.
Alotaiby et al. EURASIP Journal on Advances in Signal Processing 2014, 2014:183 Page 2 of 21
http://asp.eurasipjournals.com/content/2014/1/183](https://image.slidesharecdn.com/alotaiby2014articleeegseizuredetectionandpredicti-180924030524/85/Alotaiby2014-article-eeg_seizure_detectionandpredicti-2-320.jpg)
![Figure 2 shows an example of an EEG signal including a
seizure period. It is clear that there is a difference be-
tween seizure and non-seizure intervals. As we are able
to differentiate between these intervals visually, time-
domain detection and prediction methods attempt to
differentiate between them automatically, and evaluate
the performance using different metrics such as the sen-
sitivity, specificity, accuracy, and false-positive value.
These metrics are defined as follows [12]:
Sensitivity ¼
TP
TP þ FN
 100 ð1Þ
Specificity ¼
TN
TN þ FP
 100 ð2Þ
Accuracy ¼
TP þ TN
TN þ FP þ TP þ FN
 100 ð3Þ
False positive value ¼
TP
TP þ FP
 100; ð4Þ
where true positive (TP) is the number of seizure epochs
determined by both algorithm and experienced physi-
cians, false positive (FN) is the number of seizure epochs
which are missed by the algorithm but have been deter-
mined by experienced physicians, true negative (TN) is
the number of non-seizure epochs recognized by both
algorithm and experienced physicians, and false positive
(FP) is the number of non-seizure epochs recognized as
seizure by the algorithm.
1.2.1 Seizure detection methods
To detect EEG seizures in time domain, there is a need
to analyze discrete time sequences of EEG epochs. This
analysis can be accomplished through histograms of the
epochs. Runarsson and Sigurdsson presented a simple
time-domain seizure detection method that is based on
tracing consecutive peaks and minima in the signal seg-
ment at hand and estimating the histograms for two var-
iables: the amplitude difference and time separation
between peak values as well as minima [13]. The fea-
tures used for classification of an epoch as a seizure or
non-seizure are the estimated values of the histogram
bins. The authors used a support vector machine (SVM)
classifier for this task and achieved an average sensitivity
of about 90% on self-recorded data.
Another approach to deal with the EEG seizure detec-
tion method in time domain is to compute the signal en-
ergy during seizure and non-seizure periods. A better
treatment to the energy estimation approach is to esti-
mate the energies of the signal sub-bands not the signal
as a whole in order to build a more discriminative fea-
ture vector. Yoo et al. adopted this approach and pre-
sented an eight-channel EEG acquisition system-on-chip
(SoC) that can detect and record patient-specific epilep-
tic seizures [14]. They used a bank of seven band-pass
filters covering the frequency range from 2 to 26 Hz on
eight channels of the processed EEG signals. Eight highly
dynamic analog channels, classification processor, and a
64-KB SRAM have been integrated in the SoC. With this
approach, a long-term seizure monitoring and storage
Figure 2 An EEG signal containing a seizure.
Alotaiby et al. EURASIP Journal on Advances in Signal Processing 2014, 2014:183 Page 3 of 21
http://asp.eurasipjournals.com/content/2014/1/183](https://image.slidesharecdn.com/alotaiby2014articleeegseizuredetectionandpredicti-180924030524/85/Alotaiby2014-article-eeg_seizure_detectionandpredicti-3-320.jpg)
![device was built. The authors used an SVM as a classi-
fier with a gain and bandwidth (GBW) controller to per-
form real-time gain and bandwidth adaptation to analog
front end (AFE) in order to keep a high accuracy. This
classifier is well suited for the hardware implementation.
The SoC was tested on CHB-MIT scalp EEG database
[15], and it was verified in the presence of a rapid eye
blink giving an accuracy of 84.4% with 2.03 μJ/classifica-
tion energy.
Another approach to deal with time-domain seizure
detection is to exploit some discriminating statistics be-
tween seizure and non-seizure epochs. Dalton et al. de-
veloped a body senor network (BSN) that can monitor
and detect epileptic seizures based on statistics extracted
from time-domain signals [16]. These statistics include
the mean, variance, zero-crossing rate, entropy, and auto-
correlation with template signals. For auto-correlation es-
timation, they adopted a dynamic time warping (DTW)
approach for best alignment between the signal segment
to be tested and the template signal. The authors pre-
sented a network to be embedded in wearable kinematic
sensors and an N810 Internet tablet. Data were recorded
from the subjects using kinematic sensors such as triacce-
lerometer, gyroscope, and magnetic sensor for physical ac-
tivity monitoring. This algorithm was, then, commercially
distributed and a BSN was developed on a Mercury plat-
form. The sensitivity of the proposed algorithm for a data-
set of 21 seizures was found to be 91% with a specificity of
84% and battery lifetime of 10.5 h.
1.2.2 Seizure prediction methods
The research work on the issue of time-domain seizure
prediction is richer than time-domain seizure detection
due to the importance of the seizure prediction problem.
We can think of the seizure prediction problem as a de-
tection problem of the pre-ictal state on seizure records.
This requires a considerable long inter-ictal state for
good prediction results. Similar statistics to those used
in seizure detection like the zero-crossing rate can be
used for seizure prediction. Zandi et al. used the zero-
crossing rate of EEG signal segments to develop a
patient-specific seizure prediction method [17,18]. A
moving window analysis is used in this method. The his-
tograms of the different window intervals are estimated,
and selected histogram bins are used for classification into
pre-ictal and inter-ictal states based on comparison with
reference histograms. A variational Bayesian Gaussian
mixture model has been used for classification. In this
method, a combined index for the decisions taken on se-
lected bins is computed and compared with a pre-defined
patient-specific threshold to raise an alarm for coming sei-
zures as shown in Figure 3. This method has been tested
on 561 h of scalp EEG containing 86 seizures for 20 pa-
tients. It achieved a sensitivity of 88.34%, a false prediction
rate of 0.155 h−1
, and an average prediction time of
22.5 min.
Aarabi and He [19] developed a time-domain rule-
based patient-specific seizure prediction method which
consists of three stages: pre-processing, feature extraction,
and rule-based decision making. In the pre-processing
stage, the iEEG data is filtered using a 0.5- to 100-Hz
band-pass filter in addition to a 50-Hz notch filter. Then,
the filtered signal is segmented into non-overlapping 10-s
segments. Five univariate features (correlation entropy,
correlation dimension, Lempel-Ziv complexity, noise level,
and largest Lyapunov exponent) and one bivariate feature
(non-linear independence) were extracted from each seg-
ment in the second stage.
Based on the theory of chaos, the correlation dimen-
sion (denoted by ν) represents a dimensionality measure
of the space having a set of random points; in our case,
EEG signals. For an m-dimensional space containing a
set of N points, we have:
x
→
ið Þ ¼ x1 ið Þ; x2 ið Þ; :::::::; xm ið Þ½ Š;
i¼ 1; 2; ::::; N
ð5Þ
The correlation integral C(ε) can be estimated as [20]:
C εð Þ ¼ lim
N→∞
g
N2 ; ð6Þ
where g represents the total number of pairs of signals
or points having a distance less than ε. As the number of
points increases and tends to infinity and the distance
tends to be shorter or close to zero, the correlation inte-
gral, in turn, for small values of ε becomes:
Histogram
Extraction and
Selecting
Discriminative
Bins
Variational
GMM
Variational
GMM
Dissimilarity
Index
Dissimilarity
Index
Combine
Indices
Xint
Xpre
Xk Decision
Making
Figure 3 Zandi et al. seizure prediction method.
Alotaiby et al. EURASIP Journal on Advances in Signal Processing 2014, 2014:183 Page 4 of 21
http://asp.eurasipjournals.com/content/2014/1/183](https://image.slidesharecdn.com/alotaiby2014articleeegseizuredetectionandpredicti-180924030524/85/Alotaiby2014-article-eeg_seizure_detectionandpredicti-4-320.jpg)
![C εð Þ≈εv
ð7Þ
If a large number of evenly distributed points exists, a
log-log graph of the correlation integral versus ε can be
used to estimate ν. For objects with higher dimensions,
several ways exist for points to be close to each other,
and hence, the number of pairs which are close to each
other jumps rapidly for higher dimensions [20].
Correlation entropy is a Kolmogorov entropy variant,
which is similar to the mutual information between two
sequences of data. Large mutual information between an
available data segment and stored segments with specific
patterns is an indication that the segment at hand
belongs to a dataset with similar characteristics to the
stored pattern [21]. The Lempel-Ziv complexity is a
measure of randomness of data sequences [22]. It counts
the number of data patterns with certain characteristics
in data segments. For example, if we find enough short
patterns with specific mean, variance, or higher-order
statistics in an EEG segment, we can classify this seg-
ment as a seizure segment.
The Lyapunov exponent of a dynamical system deter-
mines the separation rate of very closely related trajec-
tories. Hence, two signal vectors in the phase space with
an initial separation of δZ0 will eventually diverge at a
rate given by:
δZ tð Þj j≈eλt
δZ0j j; ð8Þ
where λ is the Lyapunov exponent. This can be achieved
if the divergence can be dealt with within the linearized
approximation.
The separation rate differs based on the initial separ-
ation vector orientation. The maximal Lyapunov expo-
nent can be estimated as [23]:
λ ¼ lim
t→∞
lim
δZ0→0
1
t
ln
δZ tð Þj j
δZ0j j
ð9Þ
The limit δZ0 → 0 ensures the validity of the linear ap-
proximation at any time.
Considering a given segment and feature, if N chan-
nels exhibit behaviors like those expected in the feature
or segment spatiotemporal profile describing the pre-
ictal state of the patient, and if N was greater than a
threshold Nch, then this segment is temporarily catego-
rized as a seizure precursor, and hence a flag, labeled as
I, is raised for the segment as shown in Figure 4. A value
is given to this flag by an averaging process for the chan-
nels’ absolute normalized feature values. The channels
selected are those that show similar behavior to the one
expected in the spatiotemporal profile of the feature char-
acterizing the pre-ictal state of the patient. The values and
location of all flag Is are hence stored and given as input
into the feature integrator, which integrates decisions for
every segment to accurately locate the seizure precursors.
For any signal segment, if M flag Is with values that are
higher than a certain significance threshold Tc1 are raised
and if M is larger than a certain threshold NF, then an-
other flag which is labeled as II is raised. This flag is deter-
mined as the average of the values of the flag Is. Flag IIs
ensure a higher likelihood of accurate seizure prediction.
Flag IIs are used as input to the feature integrator II to ob-
tain a higher-level decision. This feature integrator inte-
grates flag Is and flag IIs as shown in Figure 4. If both flag
I and flag II are raised, then a flag III representing a defini-
tive seizure precursor is also raised.
This method has been evaluated using iEEG data from
two patients (frontal, temporal lobe origin) from Freiburg
Seizure Prediction EEG (FSPEEG) database with a 256-Hz
sampling rate and a total of 58 h, and 10 seizures with
50-min pre-ictal at least [24]. The results demonstrated
average sensitivities of 90% and 96.5% for patient one and
patient two, respectively. The average false prediction
rates were 0.06/h and 0.055/h for both patients for predic-
tion horizons of 30 and 60 min.
Schelter et al. presented a new method to minimize
the false alarms adopting circadian concepts [25]. A cir-
cadian rhythm is defined as any biological operation that
reveals an endogenous, entrainable oscillation for 24 h.
The authors used the output of the mean phase coher-
ent algorithm, which measures the interaction between
pairs of EEG signals, as a seizure predictor, which causes
an alarm to be raised if it exceeds a certain threshold. It
was assumed that the seizures occur while the patient is
sleeping. The false alarms display a circadian depend-
ency with most of the seizure prediction algorithms. The
seizure predectability is increased during night due to
the large number of seizures. Accordingly, threshold
adaptation can be used in day and night to enhance pre-
dictability. The authors evaluated this method utilizing
iEEG data from eight patients and a total of 1400 h,
which include 172 seizures and reported a good predic-
tion performance for 40% of the patients.
Wang et al. proposed an adaptive learning system that
interactively learns from the patient and improves its
Intracranial
EEG
Correlation Dimension
Noise Level
Correlation Entropy
Lempel-Ziv Complexity
Largest Lyapunov Exponent
Nonlinear Independence
Feature
Integrator I
Feature
Integrator II
Feature Extraction
Flag I
Flag I
Flag II
Flag III
Figure 4 Method of Aarabi and He for seizure prediction.
Alotaiby et al. EURASIP Journal on Advances in Signal Processing 2014, 2014:183 Page 5 of 21
http://asp.eurasipjournals.com/content/2014/1/183](https://image.slidesharecdn.com/alotaiby2014articleeegseizuredetectionandpredicti-180924030524/85/Alotaiby2014-article-eeg_seizure_detectionandpredicti-5-320.jpg)
![seizure predictability over time [26]. It is based on
reinforcement learning and online monitoring, in addition
to adaptive control theory. In this system, a sliding win-
dow size of 10 min is used to read continuous multi-
channel EEG data with a 50% overlap at each move. Then,
k-nearest neighbor (KNN) method is adopted for the
classification of the windowed epochs to normal or pre-
seizure states based on pre-constructed baselines for both
states using pre-specified baseline for normal and pre-
seizure states. Finally, according to the prediction feed-
backs, the two baselines are updated. This method
was evaluated using iEEG data for five patients having
temporal lobe epilepsy. The EEG data consisted of 26
channels with a duration range from 3 to 13 h. This
method achieved an accuracy of 70% compared to 50% for
the Poisson random predictor with a mean interval of λ
minutes.
Researchers have proved that symptoms like sleep
problems or headaches are observable from the analysis
of the iEEG. These symptoms can be utilized as a major
tool for seizure prediction. Bedeeuzzaman et al. have
presented a seizure prediction algorithm with a statis-
tical feature set consisting of mean absolute deviation
(MAD) and inter-quartile range (IQR) to predict epilep-
tic seizures [27]. A linear classifier has been used to find
the seizure prediction time in pre-ictal iEEGs. A sensitiv-
ity of 100% with zero false-positive rate (FPR) in 12 pa-
tients and low values of FPR for the rest were achieved
using Freiburg iEEG dataset. Average prediction time
varied between 51 and 96 min.
The envelope of the EEG signal can be exploited to
distinguish between different activities. Li et al. pre-
sented a time-domain method for seizure prediction that
is based on spike rate estimation [28]. Morphological
operations and averaging filters are applied to transform
each signal segment to a train of spikes in a way similar
to the process of envelope detection. Based on the spike
rate, ictal, inter-ictal, and pre-ictal states can be identi-
fied through comparison with a certain threshold. This
method was applied on 21 patients from Freiburg data-
base, and it achieved a sensitivity of 75.8% and an aver-
age false-alarm prediction rate of 0.09/h.
Due to the inherent intra- and inter-patient seizure het-
erogeneities and EEG non-stationarity, it is difficult to
measure the modulations of neuronal network interac-
tions using seizure precursors. To solve this problem,
Stamoulis et al. studied the pre-ictal neuro-modulations
corresponding to temporal and/or frontal lobe seizures.
They used information theoretic features like entropy and
mutual information extracted from two frequency ranges
(the range that is less than or equal to 100 Hz and the
range that is greater than 100 Hz) of awake scalp EEGs
[29]. They succeeded to measure pre-ictal modulations at
frequencies greater than 100 Hz with high specificity.
Another approach to process EEG signals in the time
domain in order to detect or predict seizure is to create
models from the EEG signal segments corresponding to
different activities. One of such models is the auto-
regressive (AR) model, which can be thought of as a data
reduction model that transforms the EEG signal segment
into few coefficients. Chisci et al. studied the implant-
ation of monitoring and control units on drug-resistant
epilepsy patients with AR modeling [30]. They adopted
AR modeling with a least-squares parameter estimator
for EEG feature extraction in addition to a binary SVM
classifier to distinguish between pre-ictal, ictal, and
inter-ictal states as shown in Figure 5. This algorithm is
computationally simple enabling real-time implementa-
tion. Simulation results on the Freiburg database have
shown 100% sensitivity with low false-alarm rate. This is
attributed to the regularization strategy of the SVM clas-
sifier with Kalman post-processing.
The realization of implantable seizure prediction de-
vices that can be used for alerting the patient and taking
an action is a very challenging task. Cellular non-linear
networks (CNNs), which represent a paradigm for high-
speed computations, can be used for this task. Tetzlaff
and Senger presented four different CNN-based ap-
proaches for epileptic seizure prediction towards an im-
plantable seizure warning device working on any type of
simple time-domain features [31]. This method can be
used with any of the abovementioned features. The
CNNs have been used in these approaches because they
consist of locally coupled dynamical systems that can
simulate the non-linear phenomena encountered in
physical communication.
1.3 Frequency-domain methods
Frequency-domain techniques have been used for EEG
seizure detection. Both of the Fourier transform magni-
tude and phase can be exploited for this purpose. Rana
et al. presented a frequency-domain epileptic seizure
Pre-
Processing
Feature Extraction
Ar
Estimation
MA
Filtering
Classification
SVM
Kalman
Filter
Decision
Function
EEG
St
Xt ak Zkka ˆ
kd yk
Figure 5 Chisci et al. seizure prediction method.
Alotaiby et al. EURASIP Journal on Advances in Signal Processing 2014, 2014:183 Page 6 of 21
http://asp.eurasipjournals.com/content/2014/1/183](https://image.slidesharecdn.com/alotaiby2014articleeegseizuredetectionandpredicti-180924030524/85/Alotaiby2014-article-eeg_seizure_detectionandpredicti-6-320.jpg)
![detection approach depending on the phase-slope index
(PSI) of multi-channel EEG signals [32]. If we consider
signals zi [n] and zj [n], their cross spectrum is given by:
Sij fð Þ ¼ E Zi fð ÞZÃ
j fð Þ
h i
; ð10Þ
where Zi (f) and Zi (f) are the Fourier transforms of zi
[n] and zj [n]. Hence, the complex coherence is given by:
Cij fð Þ ¼
Sij fð Þ
ffiffiffiffiffiffiffiffiffiffiffiffiffiffiffiffiffiffiffiffiffi
Sii fð ÞSjj fð Þ
p ð11Þ
An unnormalized PSI metric can be defined using
complex coherence as follows:
~Ψ ij ¼ Im
X
f ∈F
CÃ
ij fð ÞCij f þ δfð Þ
!
; ð12Þ
where δf is the frequency resolution and F is the fre-
quency band of interest. We can deduce that ~Ψ ij mea-
sures a weighted sum of the slopes of the phase between zi
[n] and zj [n] over the selected band F [32]. Normalization
with the standard deviation is used to determine whether
causal influence from zi [n] to zj [n] is of significant extent
or not.
The PSI computes the measure of interaction between
two channels. The authors used the PSI metric to distin-
guish between seizure and normal activities. The detec-
tion performance has been evaluated over five patients
having different types of epilepsy with 47 seizures in
258 h of recorded data. The simulation results showed
that this algorithm succeeded in the detection of all sei-
zures for four out of five patients, and it achieved a
lower false detection rate than two per hour. The results
also showed that the channels with strong activity can
be determined for each patient.
Khamis et al. used frequency-moment signatures for
building a patient-specific seizure detection method [33].
Firstly, experienced electroencephalographs have marked
the collected scalp EEG data with seizure events. After
that, a filtering process has been performed on the win-
dowed EEG data from electrode differences T6-P4 for
the right hemisphere and T5-P3 for the left hemisphere.
Power spectral densities of the signals on both hemi-
spheres have been computed and a background removal
technique has been used. Moments of these spectra have
been used as features for signal classification as seizure
or non-seizure. Results reported a sensitivity of 91% and
false-alarm rate of 0.02 false positives per hour.
EEG signals are in general non-linear and non-stationary.
So, there is a difficulty to characterize different activities of
EEG signals with certain mathematical models. To tackle
this problem, Acharya et al. presented a modified method
for the detection of normal, pre-ictal, and ictal conditions
from recorded EEG signals [34]. This method is based on
four entropy features for classification: phase entropy 1 (S1),
phase entropy 2 (S2), approximate entropy (ApEn), and
sample entropy (SampEn). The phase entropies are esti-
mated from the higher-order spectra of EEG signal epochs
as discriminating features for ictal, pre-ictal, and inter-ictal
activities. The approximate and sample entropies are loga-
rithmic metrics that determine the closeness and matching
between the incoming EEG signal pattern and the recorded
templates. These features are extracted from EEG signals
and fed to seven different classifiers for comparison: SVM,
fuzzy Sugeno classifier (FSC), probabilistic neural network
(PNN), KNN, naive Bayes classifier (NBC), decision tree
(DT), and Gaussian mixture model (GMM). The obtained
results with this method showed the superiority of the
Fuzzy classifier, which achieved an accuracy of 98.1%.
1.4 Wavelet-domain methods
Wavelets have been widely used in the field of EEG sig-
nal analysis, especially for seizure detection and predic-
tion. The wavelet transform in itself can be regarded as
some sort of sub-band decomposition, but with down-
sampling. The wavelet transform can be implemented
on analog as well as digital signals. We are more inter-
ested in the DWT. The DWT can be implemented with
low-pass (LP) and high-pass (HP) filtering in addition to
a decimation process, and it must be invertible as shown
in Figure 6a [35]. The DWT can be implemented with a
single level or multi levels as shown in Figure 6b, c. For
the multi-level wavelet decomposition, further decompo-
sitions up to the required level are performed on the
low-pass branch only. Another implementation of wave-
let analysis is the wavelet packet transform, which
performs further decomposition on the low-pass and
high-pass branches.
The wavelet decomposition and reconstruction filters
H0, H1, G0, and G1 must satisfy the perfect reconstruc-
tion (PR) condition. These filters can be obtained by
solving the following equation [35]:
Y zð Þ ¼
1
2
X0 zð Þ þ X0 −zð Þf gG0 zð Þ þ
1
2
X1 zð Þ þ X1 −zð Þf gG1 zð Þ
¼
1
2
X zð Þ H0 zð ÞG0 zð Þ þ H1 zð ÞG1 zð Þf g
þ
1
2
X −zð Þ H0 −zð ÞG0 zð Þ þ H1 −zð ÞG1 zð Þf g
ð13Þ
The main idea of using the wavelet analysis for EEG
seizure detection and prediction is extracting discrimin-
ating features from appropriate sub-bands to be used for
further classification.
Alotaiby et al. EURASIP Journal on Advances in Signal Processing 2014, 2014:183 Page 7 of 21
http://asp.eurasipjournals.com/content/2014/1/183](https://image.slidesharecdn.com/alotaiby2014articleeegseizuredetectionandpredicti-180924030524/85/Alotaiby2014-article-eeg_seizure_detectionandpredicti-7-320.jpg)
![1.4.1 Wavelet-domain seizure detection
The main challenge in wavelet-based EEG seizure detec-
tion is the determination of the appropriate wavelet de-
composition level and the selection of the features from
certain sub-bands for discrimination between seizure
and non-seizure periods. Zhou et al. presented a wavelet-
based seizure detection method that depends on lacunar-
ity and fluctuation index as features with Bayesian linear
discriminant analysis (BLDA) [12]. The lacunarity is a
measure of heterogeneity used in fractal analysis. In this
method, the authors first decompose the EEG epochs into
five wavelet sub-bands. Three sub-bands with scales 3, 4,
and 5 are chosen for further processing. For feature ex-
traction, lacunarity and fluctuation index are computed
within the frequency bands. If p(m,l) denotes the probabil-
ity of points, whose amplitude is equal to m, l represents
the length of EEG epochs, A is the minimum amplitude
value, and B is the maximum amplitude value, then the
equation below holds [12]:
XB
m¼A
p m; lð Þ ¼ 1 ð14Þ
After calculating,
M1 lð Þ ¼
XB
m¼A
mp m; lð Þ ð15Þ
M2 lð Þ ¼
XB
m¼A
m2
p m; lð Þ ð16Þ
The lacunarity can be obtained as:
la lð Þ ¼
M2 lð Þ− M1 lð Þ½ Š2
M1 lð Þ½ Š2 ð17Þ
After feature extraction, BLDA is used to classify the
seizures. The BLDA tries to minimize the risk associated
with the classification decision. It can deal with high
H0(z)
H1(z)
G0(z)
G1(z)
+X(z) Y(z)
X0(z)
X1(z)
½ {X0(z)+X0(-z)}
½ {X1(z)+X1(-z)}
H0(z)
H1(z)
X
H0(z)
H1(z)
H0(z)
H1(z)
H0(z)
H1(z)
X1
X01
X001
X0001X0
X00
X000
X0000
G0(z)
G1(z)
+
G0(z)
G1(z)
+
G0(z)
G1(z)
+
G0(z)
G1(z)
+
X0000
X0001
X000
X00
X0 X
Figure 6 Wavelet decomposition and reconstruction. The down arrow is down-sampling by 2, and the up arrow is up-sampling by 2. (a) The
two-band decomposition-reconstruction filter bank. (b) Multi-level wavelet decomposition tree. (c) Multi-level wavelet reconstruction tree.
Alotaiby et al. EURASIP Journal on Advances in Signal Processing 2014, 2014:183 Page 8 of 21
http://asp.eurasipjournals.com/content/2014/1/183](https://image.slidesharecdn.com/alotaiby2014articleeegseizuredetectionandpredicti-180924030524/85/Alotaiby2014-article-eeg_seizure_detectionandpredicti-8-320.jpg)
![dimensionality and noisy datasets, assuming a linear re-
lation between targets t and feature vectors x from one
side and additive white Gaussian noise n from the other
side in Bayesian regression. Post-processing, such as
smoothing, and multi-channel decision fusion are ap-
plied to enhance the detection accuracy of the BLDA.
The performance of this method was investigated on
Freiburg EEG database, and it achieved a 96.25% sensi-
tivity with 0.13/h false detection rate.
Another five-level wavelet decomposition method for
seizure detection was developed by Liu et al. [36]. This
method works on multi-channel iEEG signals. Three
wavelet sub-bands are selected for further processing.
The extracted features from these sub-bands are the
relative amplitude, relative energy, coefficient of vari-
ation, and fluctuation index from the selected frequency
bands. The coefficient of variation is the ratio between
the standard deviation of a decomposed sub-band and
the square of its mean. The fluctuation index is a meas-
ure of the intensity of a decomposed sub-band. An SVM
classifier is used in this approach, and some sort of post-
processing is implemented to enhance the detection per-
formance with smoothing, multi-channel decision fusion,
and collar processing. The collar processing is technique
aiming to maintain the data continuity during processing.
The performance of this method has been tested on 509 h
for 21 epilepsy patients. Experimental results have shown
that this method achieved a 94.46% sensitivity, a 95.26%
specificity, and a 0.58/h false detection rate on long-term
iEEG.
The five-level wavelet decomposition was also adopted
by Panda et al. with an SVM classifier for seizure detec-
tion from background EEGs [37]. This classifier was
tested on a healthy subject with open eyes, a healthy
subject with closed eyes, and an epilepsy patient. The
extracted features for signal classification are energy,
standard deviation, and entropy. The simulation results
revealed an accuracy of 91.2% in seizure activity detec-
tion. Khan et al. proposed a similar approach for seizure
detection, but with relative energy and a normalized co-
efficient of variation (NCOV) as features [38]. It works
on wavelet coefficients acquired in the frequency range
of 0 to 32 Hz as follows:
1) The COV is estimated as:
COV ¼
σ2
μ2
ð18Þ
where σ2
is the epoch variance and μ is the epoch
mean.
2) The RCOV is estimated as:
RCOV ¼
COVe nð Þ
COV lð Þ
ð19Þ
where COVe(n) is the epoch coefficient of variation
and COV(l) is the background coefficient of variation.
3) The NCOV is evaluated as:
NCOV ¼
σ2
μa
; ð20Þ
where μa represents the mean of the absolute values of
the wavelet coefficients. The obtained results with the
NCOV are better than those obtained using the COV
only.
Wang et al. used Neyman-Pearson rules and an SVM
classifier for seizure detection as shown in Figure 7 [39].
This method depends on the wavelet coefficients in
addition to the ApEn in the wavelet domain as extracted
features, and the detection is performed using Neyman-
Pearson rules with an SVM. The approximate entropy is
an entropy metric that takes into consideration the order-
ing of the points of the discrete time sequence at hand,
and hence, it is a good measure for the regularity of the
data sequence. Simulation results have shown a detection
accuracy of 98% and a false detection rate of 6%.
Zainuddin et al. investigated the use of wavelet neural
networks (WNNs) based on wavelet basis functions for
seizure detection [40]. Firstly, the wavelet transform of
EEG signals is estimated, and maximum, minimum, and
standard deviation of the absolute values of the wavelet
coefficients in each sub-band are extracted as features.
These features are then fed to trained WNNs. The
Gaussian, Mexican Hat, and Morlet wavelet activation
functions have been investigated for classification. A
cross-validation approach have been adopted in the
Wavelet
Transform
ApEn
Neyman -
Person
Detector
SVM
Performance
Evaluation
Raw EEG
Signal
Figure 7 Wang et al. method for seizure detection.
Alotaiby et al. EURASIP Journal on Advances in Signal Processing 2014, 2014:183 Page 9 of 21
http://asp.eurasipjournals.com/content/2014/1/183](https://image.slidesharecdn.com/alotaiby2014articleeegseizuredetectionandpredicti-180924030524/85/Alotaiby2014-article-eeg_seizure_detectionandpredicti-9-320.jpg)
![simulation experiments. Simulation results revealed that
the best performance was obtained with WNNs employ-
ing a Morlet wavelet activation function with order 4
Daubechies wavelet for feature extraction. The authors
have carried simulation experiments on the University of
Bonn database for scalp EEG signals [41]. The simulation
results reported sensitivity and accuracy up to 98% with
such combination.
Niknazar et al. presented a wavelet-based method for
epileptic seizure detection that adopts recurrence quan-
tification analysis (RQA) on EEG recordings and their
delta, theta, alpha, beta, and gamma sub-bands extracted
through a four-level Daubechies wavelet transform [42].
The RQA is well-suited for non-linear data analysis. It
quantifies the number and duration of recurrences of
the EEG signals based on phase space trajectories. The
phase space is built on estimating a time delay and an
embedding dimension, which are the features corre-
sponding to each EEG signal state. The authors adopted
an error-correcting output coding (ECOG) classifier for
discriminating between three states: healthy, inter-ictal,
and ictal. This method achieved an accuracy of 98.67%.
Daou and Labeau presented a wavelet-based approach
for EEG signal compression and seizure detection, sim-
ultaneously [43]. The compression is performed with the
set partitioning in hierarchical trees (SPIHT) algorithm.
The SPIHT codes the LP and HP components of the sig-
nals with binary sequences. A dictionary is built for
these binary sequences of normal and seizure activities.
The seizure detection process is performed for each in-
coming segment by correlation estimation with the bin-
ary codes of normal sequences in the dictionary. If low
correlation is detected, correlation estimation is per-
formed with binary sequences of the HP components of
seizure segments to ensure seizure activity. This method
achieved an accuracy of about 90%.
Statistical analysis revealed that the spectra of normal
EEG signals follow an inverse attenuation law over the
bands of interest, which means that there are self-similar
fluctuations in EEG signals over a multiplicity of scales.
Based on this idea, Mehta et al. presented a scale-invariant
seizure detection method [44]. In this method, the onset is
detected, when the scale invariance is lost, which means
that the slope of the regression line on a logarithmic plot
for the wavelet scales 6 to 2 decreases.
Shoaib et al. presented a low-energy scalable processor
for directly analyzing EEG signals acquired through com-
pressive sensing [45]. This work adopts wavelet energy
features. It studies the effect of compressive sensing on
seizure detection performance showing a reduction of
only 4% in detection sensitivity and an increase of only
0.15/h in false-alarm rate and 1 s in latency compared to
baseline performance. The main advantage of this method
is energy saving archived through compressive sensing.
Zandi et al. presented a wavelet packet real-time seiz-
ure detection algorithm working on scalp EEG signals
[46]. They developed a patient-specific metric to differ-
entiate between seizure and non-seizure states in the 1-
to 30-Hz frequency range based on wavelet coefficients
of seizure and non-seizure references. A combined seiz-
ure index (CSI) is derived from all EEG signal channels
depending on the rhythmicity and relative energy of sig-
nal epochs for classification as seizure or non-seizure. A
majority voting rule is used on the decisions from all
channels to generate the CSI and raise an alarm when a
seizure is detected. This algorithm was tested on 14 pa-
tients having 75.8 h with 63 seizures, and it achieved a
sensitivity of 90.5%, a median detection delay of 7 s, and
a false-alarm rate of 0.51 h−1
.
1.4.2 Wavelet-domain seizure prediction
The same concepts of wavelet signal analysis used for
seizure detection can be extended to seizure prediction,
but with the target this time as the detection of the pre-
ictal state. In general, EEG signals containing seizures
are build up of constantly changing bursting levels. This
signal nature enables discrimination between different
signal activities from wavelet sub-bands. The residual
sub-band wavelet entropy (RSWE) can be directly used
to estimate the entropy of bursts from the sub-bands as
proposed by Paul et al. [47]. The wavelet decomposition
equation for an EEG signal using a sliding window of
index m is given by:
s tð Þ ¼
X∞
τ¼−∞
am
L τð Þϕ 2−L
t−τ
À Á
þ
XL
l¼1
X∞
τ¼−∞
Cm
l τð Þψ 2−l
t−τ
À Á
; ð21Þ
where Cm
1 τð Þ; Cm
2 τð Þ; …; Cm
L τð Þ are the wavelet coeffi-
cients. The sequence am
L τð Þ
È É
is the coarser-resolution
signal for a high-level decomposition. The authors experi-
mented lower and higher numbers of levels and found
that the five levels are the optimum choice.
The relative wavelet energy (RWE) of the wavelet coef-
ficients is used to derive a sub-band wavelet entropy
(SWE) feature. For a sliding window with index m, the
field potential (FP) is given by [48]:
Em
l τð Þ ¼ Cm
l τð Þ
2
ð22Þ
The wavelet coefficients total energy is given by:
Em
rmtotal ¼
X
l
X
τ
Em
l τð Þ ð23Þ
The RWE can be expressed with normalization as:
Alotaiby et al. EURASIP Journal on Advances in Signal Processing 2014, 2014:183 Page 10 of 21
http://asp.eurasipjournals.com/content/2014/1/183](https://image.slidesharecdn.com/alotaiby2014articleeegseizuredetectionandpredicti-180924030524/85/Alotaiby2014-article-eeg_seizure_detectionandpredicti-10-320.jpg)
![pm
l τð Þ ¼
Em
l τð Þ
Em
rmtotal
ð24Þ
The SWE at scale l can be defined with a probabilistic
approach as:
H Cm
l
À Á
¼
X
τ
pm
l τð Þ logpm
l τð Þ ð25Þ
The lth level RSWE of the nth frame is given by:
J Cm;n
l
À Á
¼ H Cm;n
l
À Á
−
1
No
XNo
n¼1
H Cm;n
l
À Á
; ð26Þ
where Cm;n
l represents the wavelet coefficients of the nth
frame in the mth window.
For the estimation of the RSWE, a sliding window of
1-min length has been used assuming that the FP is sta-
tionary during this window. It was also assumed that the
background FP fluctuations stay statistically unchanged
for frames of 5-s length during the main sliding window.
On the other hand, the FP fluctuations have another
component that is statistically variant over the 5-s
frames. Hence, an averaging process is performed on the
background entropy components estimated in the main
window. Consequently, resulting residual entropy corre-
sponds only to the bursting components. A key observa-
tion on this approach is that there is an increment in the
mean cortical RSWE during the transition from the pre-
ictal to inter-ictal period. This increment can be used
with an efficient slope change detector and used for
early seizure prediction.
Hung et al. developed a very large scale integration
(VLSI) setup of wavelet-based seizure prediction algo-
rithm using the correlation dimension (Dc) and its
correlation coefficient [48]. Their system comprises
arithmetic functional and control units. The arithmetic
functional units are the DWT, correlation dimension,
correlation coefficient, and seizure prediction. The DWT
of the pre-processed signal is estimated to decompose it
into four sub-bands (0 to 63 Hz, 64 to 128 Hz, 0 to
1 Hz, and 32 to 64 Hz). The higher-frequency sub-bands
are then represented in the phase space. The correlation
dimension and correlation coefficient are estimated in
the phase space as seizure prediction features. The au-
thors evaluated their method utilizing iEEG data from
11 patients of the Freiburg database with 256-Hz sam-
pling rate. Their method achieved an average of 87%
sensitivity, 0.24/h false prediction rate, and in average a
27-min warning time ahead the ictal.
Chiang et al. developed an online wavelet-domain
retraining method to improve the seizure prediction by
enlarging the training dataset gradually [49]. Their
method is based on the method of Mirowski et al. [50]
that uses non-linear interdependence, cross-correlation,
difference of Lyapunov exponents, and phase locking.
Post-processing is used in this method to reduce the
false-alarm rate if two consecutive patterns are classified
as pre-ictal. The authors evaluated their method using
three datasets: Freiburg database, CHB-MIT database
(eight patients), and National Taiwan University Hospital
database for scalp EEG (one patient) [51]. This method
achieved sensitivities of 74.2% and 52.2% on intracranial
and scalp databases, respectively. It also achieved an im-
provement in the sensitivity of off-line training on both
databases by 29.0% and 17.4%, respectively.
Rojas et al. presented a seizure prediction method de-
pending on brain excitability recognized with couplings
between low-frequency phases (delta: 0.5 to 33 Hz, theta:
3 to 8 Hz) and high-frequency amplitudes (low gamma:
40 to 70 Hz, high gamma 70 to 140 Hz) of brain waves
[52]. They evaluated this method on 20 patients from
EPILEPSIAE scalp EEG database [53]. The EEG data
was recorded using either depth or subdural stereotactic
electrodes at a sampling rate 1,024 Hz with a total of
267 seizures and more than 3,400 h of inter-ictal activ-
ities. They found that in 50% of the cases, their predictor
performed better than the random predictor, which is
based on Poisson process, with an average sensitivity
98.9%, false rate of 1.84/h, and pre-ictal window length
of 10 min.
Gadhoumi et al. presented an iEEG-based seizure pre-
diction method based on measuring the similarity with a
reference state as shown in Figure 8 [54]. In the valid-
ation of this method, 1,565 h of continuous iEEG data
for 17 patients having mesial temporal lobe epilepsy
were used. These recordings have 175 seizures. Distance,
inclusion, and persistence features are extracted in this
method from the continuous wavelet transform of EEG
recordings to discriminate between pre-ictal and inter-
ictal states. The distance is a Euclidean distance between
the center energy and the rest of energy points computed
from the wavelet coefficients. Inclusion is the percentage
of energy points with entropy confined to a pre-specified
distance. Inclusion represents the time interval in which
the maximum number of successive 2-s points has energy
and entropy profiles confined to the pre-specified dis-
tance. An SVM classifier has been used in the signal dis-
crimination and a comparison has been performed with a
random statistical predictor. Simulation results have
shown a sensitivity of 85% and a false-alarm rate of 0.35/h.
The authors came to a conclusion that state similarity
measures can be used for seizure prediction above chance
in 41% of the patients.
Gadhoumi et al. also presented a method to discrimin-
ate between pre-ictal and inter-ictal states using features
extracted from the high-frequency sub-bands of iEEG
signals [55]. The selected features are the wavelet energy
and entropy extracted from different signal epochs. The
Alotaiby et al. EURASIP Journal on Advances in Signal Processing 2014, 2014:183 Page 11 of 21
http://asp.eurasipjournals.com/content/2014/1/183](https://image.slidesharecdn.com/alotaiby2014articleeegseizuredetectionandpredicti-180924030524/85/Alotaiby2014-article-eeg_seizure_detectionandpredicti-11-320.jpg)
![estimated energy and entropy are compared to reference
energy and entropy for pre-defined signals with pre-state
and seizure activities, and based on distance metrics, the
decisions are taken from different channels and fused.
Sensitivity and false-alarm rate evaluation revealed a
sensitivity of about 80% and a false positive rate ranging
from 0.09 to 0.7 for different patients.
Wang et al. presented a wavelet-based online adaptive
seizure prediction system [56]. This system adopts Lyapunov
exponent, correlation dimension, Hurst exponent, and
entropy features extracted from the wavelet transform
of EEG recordings. It adopts also a KNN classifier. The
adaptation is performed in this system with a reinforcement
learning algorithm. A 150-min prediction horizon used on
ten patients and the system achieved the best prediction re-
sults of 73% sensitivity and 67% specificity.
Soleimani et al. presented a simple and fast adaptive
online method for the detection of pre-ictal patterns de-
pending on multiple features as illustrated in Figure 9
[57]. These features are time domain and wavelet do-
main. The time-domain features are the curve length,
the average energy, non-linear energy, six-order power
at time n, kurtosis, skewness, and variance. The wavelet-
domain feature include mean of absolute values, average
power, standard deviation, absolute mean of sub-bands
of a fifth level Daubechies wavelet transform. In this
method, a neuro-fuzzy model is used for combined fea-
tures learning in an adaptive manner. An adaptive tun-
ing process is used in the classifier operation to build a
personal seizure predictor. Freiburg database of intracra-
nial recordings for 21 patients has been used with this
classifier. Simulation results revealed that on-line adap-
tive seizure prediction achieves better results than off-
line non-adaptive seizure prediction. The percentage of
prediction was 99.52%, and the FPR was 0.1417/h.
It is possible to use some time-domain features with
wavelet-domain features to enhance the detectability of
seizures. Costa et al. have selected 14 features for effi-
cient seizure prediction from EEG recordings [58]. These
features include energy estimated from time-domain sig-
nals, energy variation, energy level, non-linear statistics,
and sub-band energies extracted from the wavelet sub-
bands. They used a neural network classifier for signal
classification into four states: pre-ictal, ictal, inter-ictal,
and post-ictal. They achieved an average specificity of
99%, an average sensitivity of 83%, and an average accur-
acy of 96% on patient records from Freiburg database.
Moghim and Corne compared the Costa et al. results with
multi-class SVM and evolved neural network classifiers
[59]. They carried out this comparative study on one pa-
tient (patient 2: 135 min, 3 seizures, 30 to 40 min before
and 10 min after each seizure) from Freiburg database,
and they reported that 8- to 10-min detection before the
onset can be achieved with reasonable specificity and
sensitivity.
1.5 Empirical mode decomposition
The EMD is a signal decomposition, which transforms a
signal into a group of intrinsic mode functions (IMFs).
For EEG seizure detection, these IMFs show different
behavior with normal and abnormal activities in the sig-
nals. Features can also be extracted from the IMFs and
Feature
Extraction
Classification
(ENFM)
P-Minute
Delay
EEG
f[n] c[n]
Figure 9 Soleimani et al. seizure prediction method.
Wavelet
energy and
entropy
Calculation
of reference
state
parameters
Feature
Computation
Classification
and
Performance
Assessment
Channel and
Frequency
band
Selction
Preictal State Detection and
warning Protocol
Prediction Performance
Evaluation
Training Stage
Testing Stage
Figure 8 Gadhoumi et al. method showing training and testing stages.
Alotaiby et al. EURASIP Journal on Advances in Signal Processing 2014, 2014:183 Page 12 of 21
http://asp.eurasipjournals.com/content/2014/1/183](https://image.slidesharecdn.com/alotaiby2014articleeegseizuredetectionandpredicti-180924030524/85/Alotaiby2014-article-eeg_seizure_detectionandpredicti-12-320.jpg)
![tested for seizure detection and prediction. The steps to
extract these IMFs from an original signal x(t) are sum-
marized below [60]:
1. Determine the signal envelope by maxima and
minima point estimation and interpolate between
them.
2. The local mean, m(t) is estimated using the envelope
as follows:
m tð Þ ¼
emin tð Þ þ emax tð Þ
2
ð27Þ
where emin(t) and emax(t) are the envelope minimum
and maximum values respectively.
3. The mean is subtracted from the original signal to
get h(t) = x(t) − m(t).
4. If h(t) does not satisfy the IMF criteria of a
difference of at most 1 between the number of
extrema (maxima and minima) and number of zero
crossings, we go to step 1 with h(t) as a new input.
5. The obtained h(t) is stored as an IMF in case it
satisfies the criteria of an IMF, ci(t) = h(t). Hence,
this IMF is removed from the original signal by
subtraction, r(t) = x(t) − ci(t), where i is the ith IMF.
6. Similar steps are repeated beginning from step 1.
The Hilbert transform (HT) is performed on each IMF
to get ~ci tð Þ provided that z tð Þ ¼ ci tð Þ þ j~ci tð Þ is ana-
lytic. Both amplitude and phase of z(t) are given by:
A tð Þ ¼
ffiffiffiffiffiffiffiffiffiffiffiffiffiffiffiffiffiffiffiffiffiffiffiffiffi
c2
i tð Þ þ ~c2
i tð Þ
q
ð28Þ
ϕ tð Þ ¼ arctan
~c2
i tð Þ
c2
i tð Þ
!
ð29Þ
The instantaneous frequency is estimated as:
ω ¼
dϕ tð Þ
dt
ð30Þ
1.5.1 EMD seizure detection
Eftekhar et al. used the EMD approach for seizure detec-
tion [60]. They adopted features such as the frequency
rise at the seizure onset with the EMD in a patient-
specific manner. Their simulation results have shown
that the Hilbert transform can be used to decompose
EEG signals into components, from which features can
be extracted for seizure onset detection.
Tafreshi et al. evaluated the performance of the EMD
in discriminating epileptic seizure data from normal data
using means of the absolute of the IMFs as features [61].
They compared this approach for feature extraction with
wavelet features using both multi-layer perceptron
(MLP) and self-organizing map (SOM) neural networks.
Results have shown that the EMD approach is better in
performance than the wavelet approach with success
rates up to 95%, and they revealed that four empirical
modes are enough to obtain good results. In addition,
the results have shown that a window length of 1,500
samples is appropriate to obtain good recognition rates.
The MLP networks are superior in performance to the
SOM networks.
Orosco et al. presented a seizure detection approach
based on the energies of IMFs as discriminating features
between seizure and non-seizure activities as shown in
Figure 10 [62]. In this approach, the IMF energies are
compared with certain thresholds for decision making. It
was tested on nine patient records from Freiburg data-
base with invasive nature. The obtained sensitivity and
specificity were 56.41% and 75.86%, respectively, using
39 seizure records.
Guarnizo and Delgado presented a modified EMD ap-
proach, in which mutual information is used for feature
selection in the EMD domain [63]. These features in-
clude the average or instantaneous frequency and ampli-
tude for all EMD components. Higher-order statistics such
as the skewness and kurtosis in addition to Shannon’s en-
tropy have been selected as features extracted from the en-
ergy estimated with the Teager energy operator (TEO)
over all EMD components [64-66]. This approach adopts a
linear Bayes classifier and it achieved an accuracy of 98%.
Alam and Bhuiyan presented a seizure detection method
depending on extracting kurtosis, skewness, largest Lyapunov
exponent, variance, approximate entropy, and correl-
ation dimension from the EMD of EEG signals with
artificial neural network classifiers [67,68]. This method
achieved a 100% sensitivity in seizure detection and has
shown a superiority as compared to time-frequency
techniques and band-limited techniques in the compu-
tational complexity.
Bajaj and Pachori presented an EMD-based seizure de-
tection method to detect focal temporal lobe epilepsy
[69]. In this method, they used Hilbert transformation of
IMFs which were obtained by an EMD process. Epileptic
seizures are then detected based on the instantaneous
area estimated from the trace of analytic IMFs of EEG
signals. The performance of this epileptic detection
method was evaluated on Freiburg database and achieved
a sensitivity of 90%, a specificity of 89.31%, and an error
detection rate of 24.25%.
The local mean of EMD can be used as a statistical
feature for seizure detection. This local mean is obtained
by averaging the lower and upper envelopes obtained
through interpolation between the local maxima and
minima. If these local maxima and minima are not de-
fined as in the case of multivariate signals, another alter-
native which is the multivariate EMD (MEMD) can be
used instead. The MEMD depends on signal projections
Alotaiby et al. EURASIP Journal on Advances in Signal Processing 2014, 2014:183 Page 13 of 21
http://asp.eurasipjournals.com/content/2014/1/183](https://image.slidesharecdn.com/alotaiby2014articleeegseizuredetectionandpredicti-180924030524/85/Alotaiby2014-article-eeg_seizure_detectionandpredicti-13-320.jpg)
![along n-dimensional spaces to generate n-dimensional
envelopes, which are then averaged to get the local mean.
The projection direction vectors are based on spherical
and polar coordinates. To sample the n-sphere, quasi-
Monte Carlo low-discrepancy sequences are exploited for
sampling enhancement. This style of sampling is non-
uniform but not random. Its objective is to get the most
useful samples over a certain space. The other steps of the
algorithm to estimate the MEMD are similar to the stand-
ard EMD algorithm. The use of the MEMD enables the
multi-channel EEG signal decomposition into narrow fre-
quency bands that can be analyzed separately for better
detectability of seizures. In addition, the mean frequency
of the signal segments can be used as a discriminative fea-
ture for seizure detection. This mean frequency can be
calculated by applying the Hilbert transform on the result-
ing IMFs. Rehman et al. investigated the use of the
MEMD with the mean frequency as possible features for
EEG seizure detection [70], but this proposal needs fur-
ther studies.
1.5.2 EMD seizure prediction
Qi et al. suggested the use of EMD for seizure prediction
with a new feature, called IMF-VoE. This feature com-
bines three IMFs obtained from the EMD of an EEG sig-
nal in addition to the range variance between upper and
lower envelopes (VoE) in the EMD domain [71]. The au-
thors tested this method using 80.4 h of EEG data con-
taining ten seizures for four patients. This method
achieved a sensitivity of 100% and a false detection rate
of 0.16/h. The estimated average time delays were 19.4,
13.2, and 10.7 s for false detection rates of 0.16, 0.27,
and 0.41/h, respectively, using different thresholds.
1.6 SVD methods
The SVD operating on a matrix A decomposes it into
matrices U, S, and V [72,73]:
A ¼ USVT
ð31Þ
The matrices U and V are orthogonal such that UT
U = I, and VT
V = I. S = diag(σ1,…,σP), where σ1 ≥ σ2 ≥
…σP ≥ 0 is the matrix of SVs of A. The matrix U contains
the left singular vectors of A, while the matrix V con-
tains the right singular vectors of A. An important char-
acteristic of the SVD that can be used in EEG seizure
detection is that the SVs are not largely affected by little
disturbances in the matrix A. This property can be used
for the detection of seizure activities taking into consid-
eration the slight variations between seizures [72,73].
Vanrumste et al. developed an SVD-based algorithm
for EEG seizure detection [74]. In this algorithm, the
EEG is segmented into overlapping epochs, which are
formulated as 2-D arrays to allow SVD. Most of the
Pre-Processing
EMD
Energy Computation
Energy and duration
thresholds detection
Energy event
Identification
Inter-channels
Decision
EEG Signals
Epileptic Seizures
Figure 10 Orosco et al. method for epileptic seizure detection
with EMD.
Alotaiby et al. EURASIP Journal on Advances in Signal Processing 2014, 2014:183 Page 14 of 21
http://asp.eurasipjournals.com/content/2014/1/183](https://image.slidesharecdn.com/alotaiby2014articleeegseizuredetectionandpredicti-180924030524/85/Alotaiby2014-article-eeg_seizure_detectionandpredicti-14-320.jpg)
![signal energy, which differs from seizure to non-seizure
activities, is concentrated in the first SVs. After that, an
EEG dipole source analysis adopting a single-dipole model
is implemented on the EEG segments. This analysis as-
sumes that each spike results from a dipole in the human
brain and performs a localization process for the position
of this source dipole [75]. This yields dipole parameters in
addition to a relative residual energy (RRE). A seizure
alarm on an epoch is raised if the SVD indicates a domin-
ant source and the RRE has a low value. The algorithm
has been investigated on synthetic EEG signals obtained
from two sources, synchronous and asynchronous. In the
synchronous case, the main metric is the RRE, and in the
asynchronous case, the SVD and RRE are of major con-
cern. The same algorithm has been investigated with real
EEG signals having two spikes and an eye-blink artifact.
The algorithm has shown that the RRE was always low for
all three events.
Shahid et al. presented an algorithm based on SVD for
the detection of seizures [76]. In this algorithm, the SVD
is applied sequentially on a sliding window of the EEG
signal of 1-s width and then r singular values are ob-
tained and used to indicate sudden changes in the sig-
nals. EEG recordings of four pediatric patients with 20
seizures have been used to validate this algorithm, and
the results indicated the sensitivity of the SVs to the
changes in the EEG signals due to epileptic seizure.
1.7 ICA and PCA methods
The SVD methods presented in above section adopt a
strategy of transforming the 1-D data to a 2-D array, but
the PCA and ICA techniques in this section adopt a co-
variance approach to obtain the PCs. ICA is signal decom-
position that transforms a multivariate signal into additive,
non-Gaussian, and statistically independent components
[77]. The main principle that the ICA depends on is the
maximization of the statistical independence between the
estimated components. This can be guaranteed through ei-
ther mutual information minimization or non-Gaussianity
maximization. For mutual information minimization,
measures like Kullback–Leibler divergence and maximum
entropy are exploited. On the other hand, for non-
Gaussianity maximization, central limit theorem, higher-
order statistics such as kurtosis, and negentropy are used
[77]. The ICA depends mainly on some pre-processing
techniques such as mean removal, whitening, and dimen-
sionality reduction. Both whitening and dimensionality re-
duction can be achieved with PCA or SVD. Whitening
ensures an equal treatment to all dimensions before the al-
gorithm is run.
1.7.1 Seizure detection
Both ICA and PCA have been used as signal separation
algorithms to enhance the detectability of seizures from
EEG signals by separating artifacts from these signals
[78]. Xie and Krishnan proposed a multi-scale PCA
method combining both DWT and PCA for de-noising
and EEG signal decomposition [79]. They developed an
empirical classification (EC) method using spatial and
temporal features. This method achieved high classifica-
tion accuracy.
1.7.2 Seizure prediction
Miri and Nasrabadi proposed a seizure prediction tech-
nique based on chaos theory and non-linear dynamics to
create a return map depending on zero crossings [80].
This method consists of nine steps: raw EEG data re-
cording from six channels, baseline noise reduction
through filtering, signal segmentation to non-overlapping
5-min sections, PCA decomposition of the signal, zero-
crossing rate estimation for the first PCA component,
resampling of the second component based on the esti-
mated zero-crossing rate, creation of a series of samples to
construct a Poincare map, feature extraction, and finally
estimation of the seizure risk. They evaluated this method
with iEEG data from six patients of Freiburg database with
256-Hz sampling rate, 50-min pre-ictal, and 24 h of non-
seizure data. Their method achieved a 20 ± 5-min predic-
tion time, an 86.6% sensitivity, and a 0.067/h false-alarm
rate.
Williamson et al. presented a seizure prediction method
that is based on estimating eigenspectral features from
space-delay correlation and covariance matrices of EEG
signal blocks with multiple delay scales [81]. An SVM
classifier has been used in this method. An averaging
process over 15-min windows is used as a post-processing
step to get the final prediction score. This method was
tested on the recordings of 19 patients from the Freiburg
database having at least three seizures. It succeeded in
predicting 71 out of 83 seizures. The false prediction rate
was 13.8/h.
2 Conclusions
Table 1 shows a comparison between the different seiz-
ure detection and prediction methods. It is clear from
this table that most seizure detection and prediction
methods adopt time- or wavelet-domain features. For
wavelet-domain method, several papers have adopted
five-level decomposition for robust feature extraction.
Few methods have used hybrid features like time and
wavelet-domain features and achieved better perform-
ance than using features from one domain only. It is
clear also that the EMD is a promising trend for seizure
detection and prediction that needs further investigation.
Also, we can say that seizure detection and prediction
methods based on classifiers are better in performance
than methods that do not implement classifiers. Multi-
Alotaiby et al. EURASIP Journal on Advances in Signal Processing 2014, 2014:183 Page 15 of 21
http://asp.eurasipjournals.com/content/2014/1/183](https://image.slidesharecdn.com/alotaiby2014articleeegseizuredetectionandpredicti-180924030524/85/Alotaiby2014-article-eeg_seizure_detectionandpredicti-15-320.jpg)
![Table 1 Summary of seizure detection and prediction methods
Method Domain and
algorithm
classification
Single or
multi-channel
Database Frame
length
Features Classifier Performance metrics Hardware
implementation
Runarsson and
Sigurdsson [9]
Time,
detection
Single channel Self-recorded data Variable
length
frames
Histogram bin amplitudes for
amplitude difference and
separation time between peaks
and minima
SVM Sensitivity: 90% No
Yoo et al. [14] Time,
detection
Multi-channel MIT database (scalp EEG) 2 s Energies of sub-bands SVM Accuracy: 84.4%, classification
energy 2.03 μJ
Yes
Dalton et al.
[16]
Time,
detection
Single channel Dataset of 21 seizures 12 to 25 s Signature of seizure Template
matching
Sensitivity: 91 %, specificity:
84 %, battery lifetime: 10.5 h
Yes
Zandi et al.
[17,18]
Time,
prediction
Multi-channel 561 h of scalp EEG with 86
seizures for 20 patients
15 s Combined index Non-linear
SVM with
Gaussian
classifier
Sensitivity: 88.34%, false
prediction rate: 0.155 h−1
,
average prediction time:
22.5 min
No
Aarabi and He
[19]
Time,
prediction
Single channel 316 h of iEEG data containing
49 seizures for 11 patients
from Freiburg database
10 s Correlation dimension,
correlation entropy, noise level,
Lempel-Ziv complexity, largest
Lyapunov exponent
No classifier Average sensitivity: 79.9%,
90.2% with average false
prediction rate: 0.17 and
0.11/h
No
Schelter et al.
[25]
Time,
prediction
Single channel Eight patients with focal
epilepsy
30 s Probabilistic threshold No classifier Sensitivity: 60% No
Wang et al. [26] Time,
prediction
Single channel Data for five patients 10 min Area under the ROC curve KNN Average accuracy: 70% No
Bedeeuzzaman
et al. [27]
Time,
prediction
Single channel 21 patients from Freiburg
database (scalp and iEEG)
1 min MAD, IQR Binary linear
classifier
Sensitivity: 100%, FPR: 0 (for
12 patients), average
prediction time: 51 to
96 min
No
Li et al. [28] Time,
prediction
Multi channel 21 patients from Freiburg
database (scalp and iEEG)
5 s Spike rate No classifier Accuracy: 75.8%, false
prediction rate: 0.09
No
Chisci et al. [30] Time,
prediction
Multi channel 21 patients from Freiburg
database (scalp and iEEG)
2 s AR coefficients SVM Sensitivity: 100%, average
prediction time: 60 min
No
Rana et al. [32] Frequency,
detection
Multi-channel EEG and ECoG time series, BW:
0.5 to 100 Hz
10 to 60 s Phase slope index No classifier Detection accuracy: 100% No
Khamis et al.
[33]
Frequency,
detection
Single channel 12 patients with six data records
(R1 to R6)
32 s Range of frequencies, range
of frequencies used for
background subtraction, number of
points, hemisphere parameters,
moment parameters, artifact
removal parameters, p-norm power,
cutoff point
Powell’s
direction set
method
Sensitivity: 91%, false
positives per hour: 0.02
No
Acharya et al.
[34]
Frequency,
detection
Single channel Self-recorded data 23.6 s Phase entropy 1 (S1),
phase entropy 2 (S2),
approximate entropy (ApEn),
and sample entropy (SampEn)
SVM, FSC,
PNN, KNN,
NBC, DT,
and GMM
Average accuracy: 98.1% No
Alotaibyetal.EURASIPJournalonAdvancesinSignalProcessing2014,2014:183Page16of21
http://asp.eurasipjournals.com/content/2014/1/183](https://image.slidesharecdn.com/alotaiby2014articleeegseizuredetectionandpredicti-180924030524/85/Alotaiby2014-article-eeg_seizure_detectionandpredicti-16-320.jpg)
![Table 1 Summary of seizure detection and prediction methods (Continued)
Zhou et al. [12] Wavelet,
detection
Multi-channel Freiburg database of 21
patients; six channels: channels
1, 2, and 3 near the epileptic
focus, and channels 4, 5, and 6
in remote locations
4 s without
overlapping
Lacunarity and fluctuation
index on wavelet scales
Bayesian
linear
discriminant
analysis
(BLDA)
classifier
Sensitivity: 96.25%, false
detection rate: 0.13/h, mean
delay time: 13.8 s
No
Liu et al. [36] Wavelet,
detection
Multi-channel Dataset of 509 h from 21
epileptic patients
4 s Relative energy, relative
amplitude, coefficient of
variation, fluctuation index
SVM Sensitivity: 94.46%, specificity:
95.26%, false detection rate:
0.58/h
No
Panda et al.
[37]
Wavelet,
detection
Single channel 500 epochs of EEG data from
five different brain activities
(100 signals per epoch)
0.5 s Energy, entropy, standard
deviation
SVM Accuracy: 91.2% No
Khan et al. [38] Wavelet,
detection
Single channel Self-recorded data for five
patients
25 s Energy and normalized
coefficient of variation
Simple LDA
classifier
Sensitivity: 83%, specificity:
100%, accuracy: 92%, overall
precision: 87%
No
Wang et al. [56] Wavelet,
detection
Single channel Changhai Hospital database
(scalp EEG)
70 to
200 ms
Approximate entropy Neyman-
Pearson
criteria and
SVM
Detection accuracy: 98%,
false detection rate: 6%
No
Zainuddin et al.
[40]
Wavelet,
detection
Single channel University of Bonn database
(scalp EEG)
23.6 s Maximum, minimum,
standard deviation of absolute
wavelet coefficients
WNN Sensitivity: 98%, accuracy:
98%
No
Niknazar et al.
[42]
Wavelet,
detection
Single channel 100 single-channel segments
from Bonn University Database
(scalp EEG)
23.6 s Time delay, embedding
dimension
ECOG Accuracy: 98.67% No
Daou and
Labeau [43]
Wavelet,
detection
Multi-channel Nine patients from MIT
database, and nine patients
from Montreal Neurological
Institute database (scalp EEG)
1 s SPIHT codes No classifier Accuracy: 90% No
Mehta et al.
[44]
Wavelet,
detection
Single channel Self-recorded 10 s Slope of the regression line
on a logarithmic plot for the
wavelet scales 6 to 2
No classifier Slope decreases with onset No
Shoaib et al.
[45]
Wavelet,
detection
Multi-channel MIT database (scalp EEG) 2 s Wavelet energy SVM Sensitivity: 91% to 96%,
latency: 4.7 to 5.3 s, false-
alarm rate: 0.17 to 0.3/h
Yes
Zandi et al. [46] Wavelet,
detection
Multi-channel EEG recordings from 14
patients approximately 75.8 h
with 63 seizures
10 to 40 s Combined seizure index No classifier Sensitivity: 90.5%, false
detection rate: 0.51 h−1
,
median detection delay: 7 s
No
Paul et al. [47] Wavelet,
prediction
Single channel Data for rats 5 s RSWE No classifier Detection: 90% No
Hung et al. [48] Wavelet,
prediction
Multi-channel 11 patients from Freiburg
database (scalp and iEEG)
1 h Chaos features, wavelet features,
correlation dimension
No classifier Accuracy: 87%, false
prediction rate: 0.24/h,
average warning time:
27 min ahead the ictal
Yes
Alotaibyetal.EURASIPJournalonAdvancesinSignalProcessing2014,2014:183Page17of21
http://asp.eurasipjournals.com/content/2014/1/183](https://image.slidesharecdn.com/alotaiby2014articleeegseizuredetectionandpredicti-180924030524/85/Alotaiby2014-article-eeg_seizure_detectionandpredicti-17-320.jpg)
![Table 1 Summary of seizure detection and prediction methods (Continued)
Chiang et al.
[49]
Wavelet,
prediction
Single channel Freiburg database, CHB-MIT
database (eight patients), Na-
tional Taiwan University Hos-
pital database (one patient)
60 s Wavelet coherence SVM 74.2% and 52.2% sensitivity
on intracranial and scalp
databases, sensitivity
improvement by 29.0% and
17.4% for both databases
No
Rojas et al. [52] Wavelet,
prediction
Single channel 20 patients (267 seizures,
3,400 h)
Up to 22 h Cross-frequency coupling No classifier Sensitivity: 100% No
Gadhoumi
et al. [54]
Wavelet,
prediction
Multi-channel 1,565 h iEEG, 17 patients with
mesial temporal lobe epilepsy
with 175 seizures
1 min with
75%
overlap
Distance, inclusion, persistence SVM Sensitivity: 85%, warning
rate: 0.35/h, proportion of
time under warning: 30%
No
Gadhoumi
et al. [55]
Wavelet,
prediction
Multi-channel Self-recorded dataset for six
patients
2 s, disjoint Wavelet energy and entropy Binary
classifier
Average sensitivity: 80%, FP
rate: from 0.09 to 0.7 FP/h
No
Wang et al. [56] Wavelet,
prediction
Multi-channel Ten patients (self-recorded
data)
10 min
with 50%
overlap
Lyapunov exponent, correlation
dimension, Hurst exponent,
entropy
KNN Sensitivity: 73%, specificity:
67%
No
Soleimani et al.
[57]
Wavelet and
time,
prediction
Single channel 21 patients Freiburg database
(scalp and iEEG)
10 s Time- and wavelet-domain
features
Neuro-fuzzy Prediction: 99.52%, FPR:
0.1417/h
No
Moghim and
Corne [59]
Wavelet and
time,
prediction
Single channel One patient from Freiburg
database (135 min, three
seizures, 10 min following
each seizure) (scalp and iEEG)
Up to
5 min
Time-domain energies,
wavelet-domain energies,
correlation dimension, max
Lyapunov exponent
MC-SVM and
EANN
Sensitivity and specificity
with different values
according to simulation
assumptions
No
Tafreshi et al.
[61]
EMD,
detection
Single channel Five patients of Freiburg
database (scalp and iEEG)
4 to 6 s Mean of the absolute of each
IMF, wavelet features
Neural
network
Accuracy: 95% No
Orosco et al.
[62]
EMD,
detection
Single channel 90 EEG segments acquired for
nine patients
1 h Energies of the IMFs No classifier Sensitivity: 56%, specificity:
75%, positive predictive
value: 61%, negative
predictive value: 72%
No
Guarnizo and
Delgado [63]
EMD,
detection
Single channel Five groups with 100 single-
channel registers sampled at
173.61 Hz
Whole
signal
Instantaneous frequency,
amplitude of each EMD component,
skewness, kurtosis, Shannon’s entropy
Linear Bayes
classifier
Accuracy: 98% No
Alam and
Bhuiyan [67,68]
EMD,
detection
Single channel Bonn University database
(scalp EEG)
23.6 s Skewness, kurtosis, variance,
largest Lyapunov exponent,
correlation dimension, approximate
entropy from intrinsic modes
ANN Accuracy: 100% No
Bajaj and
Pachori [69]
EMD,
detection
Single channel Freiburg database for 21
patients (scalp and iEEG)
15 s Modified central tendency measure No classifier Sensitivity: 90%, specificity:
89.31%, error detection rate:
24.25%
No
Qi et al. [71] EMD,
prediction
Single channel Pre-surgical epilepsy
monitoring database with
80.4 h of EEG data with ten
seizures of four patients
Whole
signal
IMF-VoE No classifier Sensitivity: 100%, false
detection rate: 0.16/h,
average time delay: 10.7 to
19.4 s are 19.4 s
No
Vanrumste
et al. [74]
SVD,
detection
Single channel Simulated EEG signals 10 s Dipole parameters, relative
residual energy (RRE)
No classifier Visual inspection of
parameters
No
Alotaibyetal.EURASIPJournalonAdvancesinSignalProcessing2014,2014:183Page18of21
http://asp.eurasipjournals.com/content/2014/1/183](https://image.slidesharecdn.com/alotaiby2014articleeegseizuredetectionandpredicti-180924030524/85/Alotaiby2014-article-eeg_seizure_detectionandpredicti-18-320.jpg)
![Table 1 Summary of seizure detection and prediction methods (Continued)
Shahid et al.
[76]
SVD,
detection
Single channel Recordings of four pediatric
patients with 20 seizures
1 s Largest r-singular values, Euclidean
distance from the r-singular
values of a baseline window
located 1 h before the seizure
No classifier Visual inspection of results No
Xie and
Krishnan [79]
PCA in
wavelet
domain,
detection
Single channel Data for eight patients 4,097 s Adjusted random index (ARI) Empirical
classifier
ARI up to 1 No
Miri and
Nasrabadi [80]
PCA,
prediction
Multi-channel Six patients of Freiburg
database (scalp and iEEG)
5 min Zero-crossing rate, a statistical index No classifier Prediction time: 20 ± 5 min,
sensitivity 86.6%, false-alarm
rate: 0.067%
No
Williamson
et al. [81]
PCA, FFT,
prediction
Multi-channel Freiburg database (scalp and
iEEG)
15 s Eigen spectral features SVM Sensitivity: 85.5%, false
prediction rate: 0.033/h
No
Alotaibyetal.EURASIPJournalonAdvancesinSignalProcessing2014,2014:183Page19of21
http://asp.eurasipjournals.com/content/2014/1/183](https://image.slidesharecdn.com/alotaiby2014articleeegseizuredetectionandpredicti-180924030524/85/Alotaiby2014-article-eeg_seizure_detectionandpredicti-19-320.jpg)
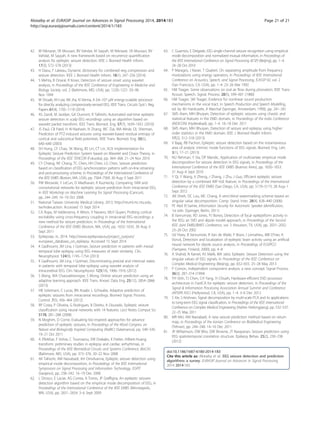

This document summarizes and compares algorithms for detecting and predicting epileptic seizures from electroencephalogram (EEG) signals. It begins by introducing the challenges of epilepsy and importance of automatic seizure detection and prediction. It then provides an overview of state-of-the-art algorithms operating in different transform domains, including time, frequency, wavelet, empirical mode decomposition, singular value decomposition, and principal/independent component analysis domains. The document concludes by comparing seizure detection and prediction methods and discussing future research directions.