Downloaded 860 times
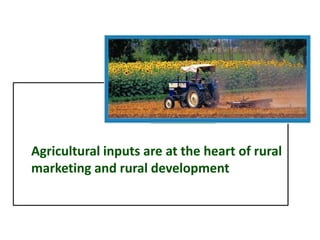
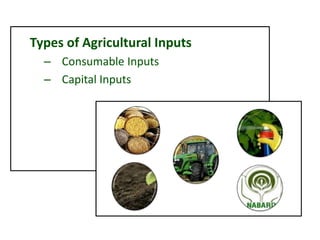
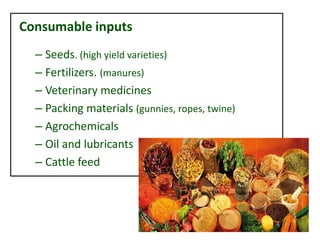
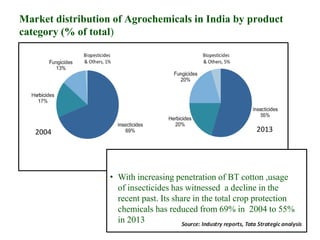
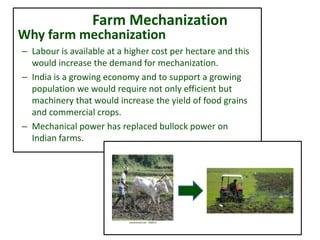


Agricultural inputs are essential for rural development and marketing. There are two types: consumable inputs like seeds, fertilizers, and veterinary medicines, and capital inputs like tractors and irrigation equipment. Seeds are a key input and account for 20-25% of productivity, but challenges include inconsistent seed quality and a lack of comprehensive databases. Fertilizer use has increased food grain production significantly in India, though consumption remains low compared to other countries. Pesticide use is also increasing to combat crop losses, with insecticides currently making up over half of the market. Mechanization brings benefits like increased yields and income, though customized equipment and training are needed given India's diverse farm sizes and conditions. Irrigation potential