Downloaded 117 times


![Mission executive committee
Submits AAP to national steering committe for approval and fund release
Distric Level Executive
Committee
Annual Action
Plan (AAP)
Distric Level Executive
Committee
Annual Action
Plan (AAP)
Distric Level Executive
Committee
Annual Action
Plan (AAP)
Distric Level Executive
Committee
Annual Action
Plan (AAP)
State Level
Executive
Committee
State Agriculture/Agricultural
Engineering department: Nodal Agency
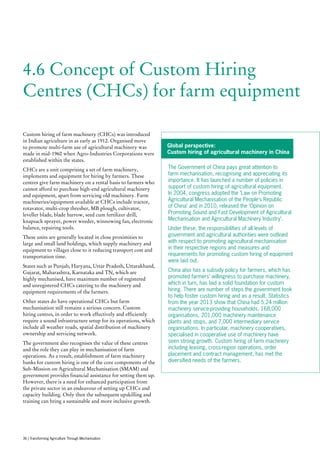
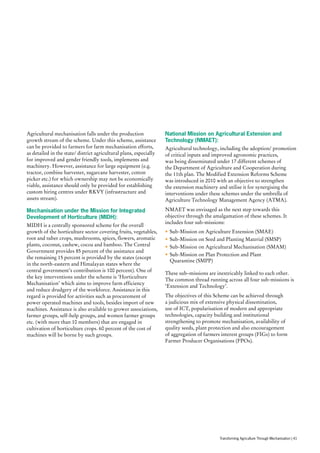
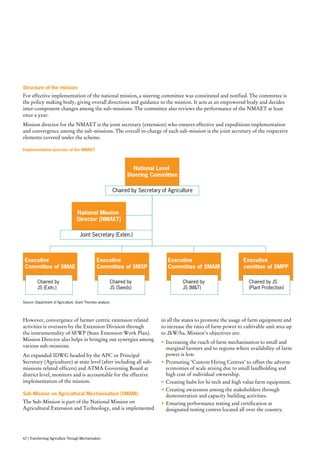
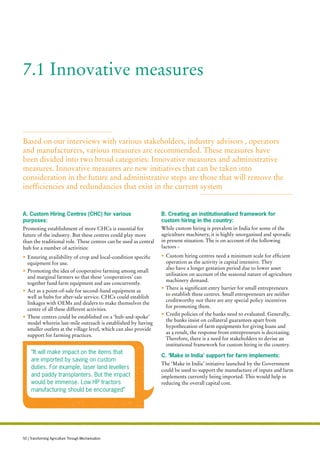
The district level annual plans are submitted to the nodal
agency, which are the state agricultural departments or
agricultural engineering departments. These agencies then
prepare the state annual plans in consonance with the
mission’s goals and objectives, taking into account the
tentative outlay of the state as outlined by the Department
of Agriculture, Cooperation and Farmer Welfare (DAC
FW). The nodal agencies also ensure suitable integration of
AAP with other schemes such as the RKVY, NFSM, and
MIDH. The state annual plans are then submitted to the
State Level Executive Committee (SLEC) for approval and
thereafter to the executive committee. Upon approval of the
plans, the nodal agencies receive the funds from the
DAC FW for the implementing agencies and oversee,
monitor and review implementation of the programmes.
Monitoring:
The mission envisages a coordinated approach for
monitoring and evaluation with active involvement of the
implementing agencies, beneficiaries and other stakeholders.
A combination of periodic desk review, field visits and
web-based mechanism has been adopted for releasing funds,
monitoring physical and financial progress and monitoring
the progress of the other mission interventions at the
national level by Mechanisation Technology (MT)
division at the DAC FW.
Source: Department of Agriculture, Grant Thornton analysis
To achieve these objectives, the mission has the following components:
• Promotion and strengthening of agricultural mechanisation through training, testing and demonstration [Central Sector
Scheme/ Component].
• Demonstration, training and distribution of Post-Harvest Technology and Management (PHTM) [Central Sector Scheme/
Component].
• Financial assistance for procurement of agricultural machinery and equipment.
• Establishment of farm machinery banks for custom hiring.
• Establishment of hi-tech and productive equipment hub for custom hiring.
• Financial assistance for promotion of mechanised operations/ hectare carried out through custom hiring centre.
• Promotion of farm machinery and equipment in north-east region.
Implementation process of the SMAM:
Transforming Agriculture Through Mechanisation | 43](https://image.slidesharecdn.com/transformingagriculturethroughmechanisation-170217054233/85/Transforming-agriculture-through_mechanisation-43-320.jpg)


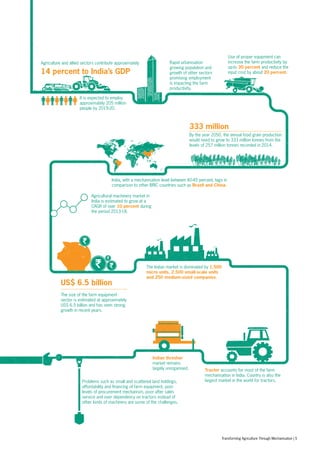
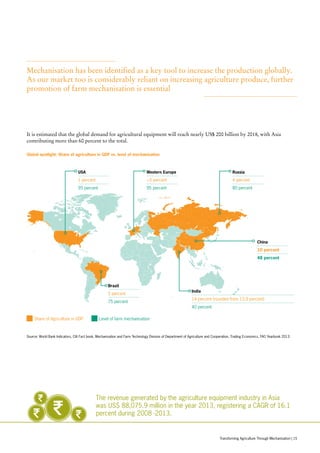
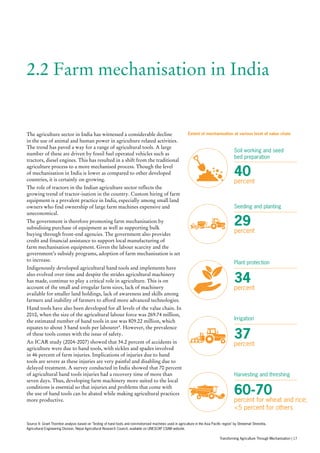
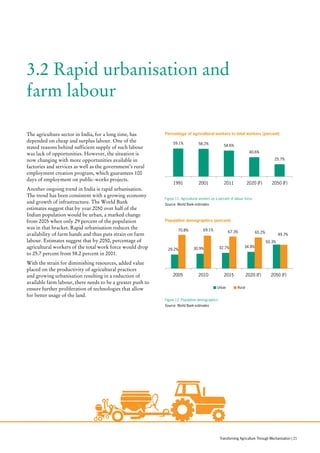
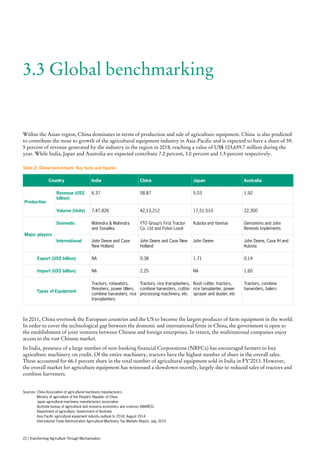
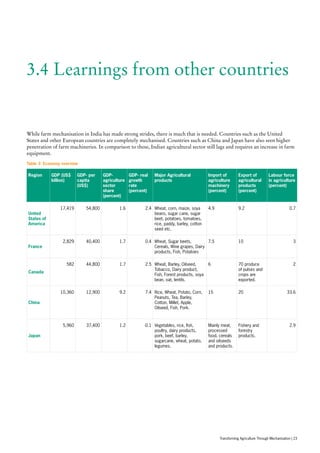
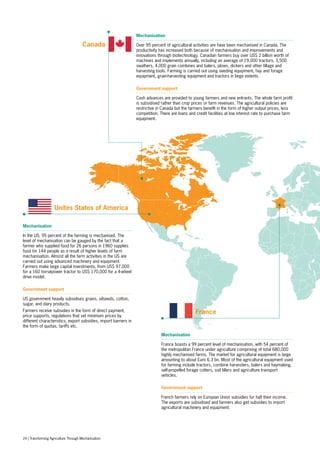
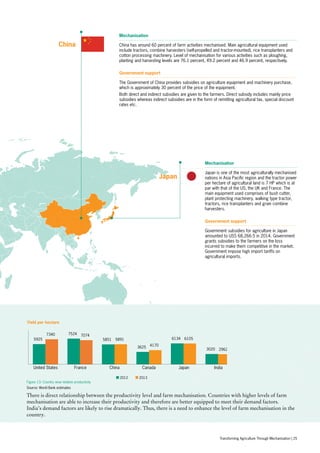
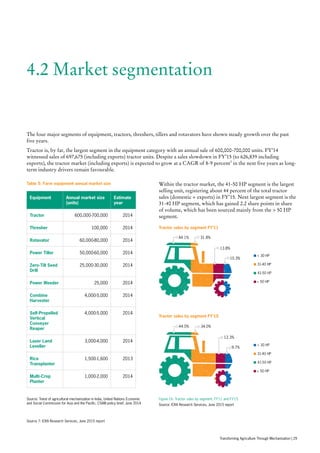
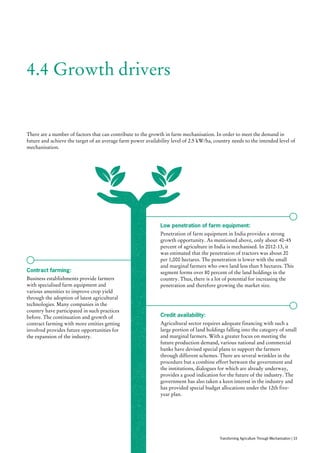
India's agriculture sector faces challenges in meeting the growing demand for food due to a slowing growth in arable land and loss of farm labor to other sectors. Farm mechanization is seen as key to increasing agricultural productivity and yields. The government aims to transform Indian agriculture through increasing mechanization levels. Currently, farm mechanization in India is around 40-45% compared to over 80% in developed countries. The farm equipment market is estimated at $6.5 billion but faces issues like small landholdings, high equipment costs, and lack of financing options for farmers. Increased mechanization through policies supporting custom hiring centers and local manufacturing can help boost agricultural productivity in India.