i
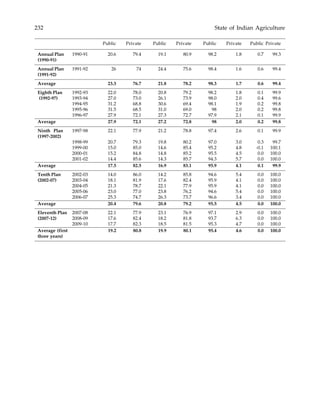
Server-33832AGRIFinal Report SIA-PressIndex.......
State of Indian Agriculture 2011-12
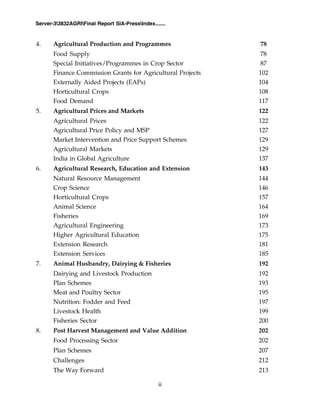
CONTENTS Pages
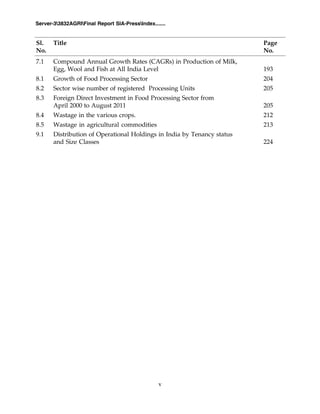
List of Tables iv
List of Figures vi
List of Boxes ix
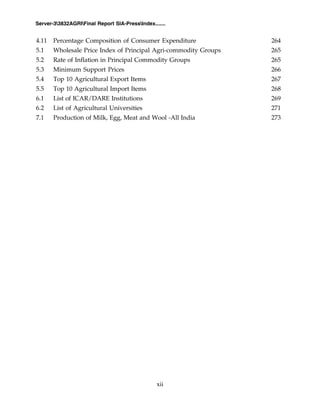
List of Annexures xi
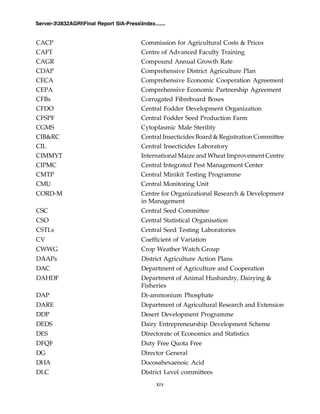
List of Abbreviations/Acronyms xiii
1. Indian Agriculture: Performance and Challenges 1
Structure & Structural Transformation of Indian Agriculture 1
Growth Performance of Agriculture 3
Drivers of Growth in Agriculture 9
Emerging Demand—Supply Imbalances 17
Trade in Agricultural Commodities 17
Public-Private Participation in Indian Agriculture 18
Price Policy 19
Marketing and Warehouse Facilities 19
Land and Credit Markets 20
The Way Forward 20
2. Natural Resource Management 21
Land-use 21
Soil 23
Water 35
Weather and Climate 42
Disaster and Calamity Management 47
3. Farm Inputs and Management 51
Seeds / Planting/Breeding Material 51
Fertilizers and Manures 55
Pesticides 59
Farm Machinery and Equipment 63
Irrigation 68
Labour and Agricultural Wages 69
Credit and Insurance 71
ii
Server-33832AGRIFinal Report SIA-PressIndex.......
4. Agricultural Production and Programmes 78
Food Supply 78
Special Initiatives/Programmes in Crop Sector 87
Finance Commission Grants for Agricultural Projects 102
Externally Aided Projects (EAPs) 104
Horticultural Crops 108
Food Demand 117
5. Agricultural Prices and Markets 122
Agricultural Prices 122
Agricultural Price Policy and MSP 127
Market Intervention and Price Support Schemes 129
Agricultural Markets 129
India in Global Agriculture 137
6. Agricultural Research, Education and Extension 143
Natural Resource Management 144
Crop Science 146
Horticultural Crops 157
Animal Science 164
Fisheries 169
Agricultural Engineering 173
Higher Agricultural Education 175
Extension Research 181
Extension Services 185
7. Animal Husbandry, Dairying & Fisheries 192
Dairying and Livestock Production 192
Plan Schemes 193
Meat and Poultry Sector 195
Nutrition: Fodder and Feed 197
Livestock Health 199
Fisheries Sector 200
8. Post Harvest Management and Value Addition 202
Food Processing Sector 202
Plan Schemes 207
Challenges 212
The Way Forward 213
iii
Server-33832AGRIFinal Report SIA-PressIndex.......
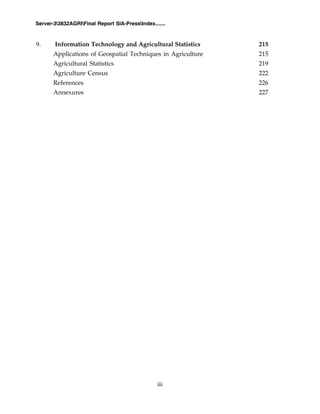
9. Information Technology and Agricultural Statistics 215
Applications of Geospatial Techniques in Agriculture 215
Agricultural Statistics 219
Agriculture Census 222
References 226
Annexures 227
iv
Server-33832AGRIFinal Report SIA-PressIndex.......
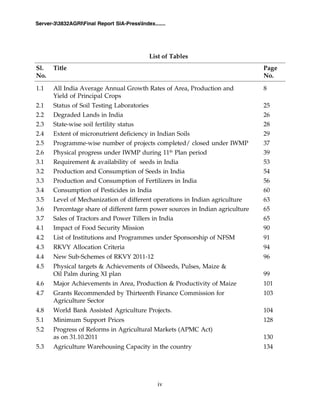
List of Tables
Sl. Title Page
No. No.
1.1 All India Average Annual Growth Rates of Area, Production and 8
Yield of Principal Crops
2.1 Status of Soil Testing Laboratories 25
2.2 Degraded Lands in India 26
2.3 State-wise soil fertility status 28
2.4 Extent of micronutrient deficiency in Indian Soils 29
2.5 Programme-wise number of projects completed/ closed under IWMP 37
2.6 Physical progress under IWMP during 11th
Plan period 39
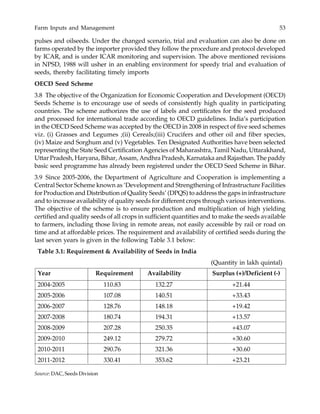
3.1 Requirement & availability of seeds in India 53
3.2 Production and Consumption of Seeds in India 54
3.3 Production and Consumption of Fertilizers in India 56
3.4 Consumption of Pesticides in India 60
3.5 Level of Mechanization of different operations in Indian agriculture 63
3.6 Percentage share of different farm power sources in Indian agriculture 65
3.7 Sales of Tractors and Power Tillers in India 65
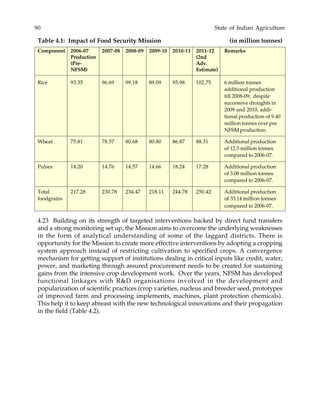
4.1 Impact of Food Security Mission 90
4.2 List of Institutions and Programmes under Sponsorship of NFSM 91
4.3 RKVY Allocation Criteria 94
4.4 New Sub-Schemes of RKVY 2011-12 96
4.5 Physical targets & Achievements of Oilseeds, Pulses, Maize &
Oil Palm during XI plan 99
4.6 Major Achievements in Area, Production & Productivity of Maize 101
4.7 Grants Recommended by Thirteenth Finance Commission for 103
Agriculture Sector
4.8 World Bank Assisted Agriculture Projects. 104
5.1 Minimum Support Prices 128
5.2 Progress of Reforms in Agricultural Markets (APMC Act)
as on 31.10.2011 130
5.3 Agriculture Warehousing Capacity in the country 134
v
Server-33832AGRIFinal Report SIA-PressIndex.......
7.1 Compound Annual Growth Rates (CAGRs) in Production of Milk,
Egg, Wool and Fish at All India Level 193
8.1 Growth of Food Processing Sector 204
8.2 Sector wise number of registered Processing Units 205
8.3 Foreign Direct Investment in Food Processing Sector from
April 2000 to August 2011 205
8.4 Wastage in the various crops. 212
8.5 Wastage in agricultural commodities 213
9.1 Distribution of Operational Holdings in India by Tenancy status
and Size Classes 224
Sl. Title Page
No. No.
vi
Server-33832AGRIFinal Report SIA-PressIndex.......
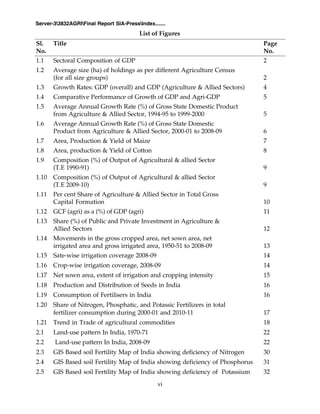
1.1 Sectoral Composition of GDP 2
1.2 Average size (ha) of holdings as per different Agriculture Census
(for all size groups) 2
1.3 Growth Rates: GDP (overall) and GDP (Agriculture & Allied Sectors) 4
1.4 Comparative Performance of Growth of GDP and Agri-GDP 5
1.5 Average Annual Growth Rate (%) of Gross State Domestic Product
from Agriculture & Allied Sector, 1994-95 to 1999-2000 5
1.6 Average Annual Growth Rate (%) of Gross State Domestic
Product from Agriculture & Allied Sector, 2000-01 to 2008-09 6
1.7 Area, Production & Yield of Maize 7
1.8 Area, production & Yield of Cotton 8
1.9 Composition (%) of Output of Agricultural & allied Sector
(T.E 1990-91) 9
1.10 Composition (%) of Output of Agricultural & allied Sector
(T.E 2009-10) 9
1.11 Per cent Share of Agriculture & Allied Sector in Total Gross
Capital Formation 10
1.12 GCF (agri) as a (%) of GDP (agri) 11
1.13 Share (%) of Public and Private Investment in Agriculture &
Allied Sectors 12
1.14 Movements in the gross cropped area, net sown area, net
irrigated area and gross irrigated area, 1950-51 to 2008-09 13
1.15 Sate-wise irrigation coverage 2008-09 14
1.16 Crop-wise irrigation coverage, 2008-09 14
1.17 Net sown area, extent of irrigation and cropping intensity 15
1.18 Production and Distribution of Seeds in India 16
1.19 Consumption of Fertilisers in India 16
1.20 Share of Nitrogen, Phosphatic, and Potassic Fertilizers in total
fertilizer consumption during 2000-01 and 2010-11 17
1.21 Trend in Trade of agricultural commodities 18
2.1 Land-use pattern In India, 1970-71 22
2.2 Land-use pattern In India, 2008-09 22
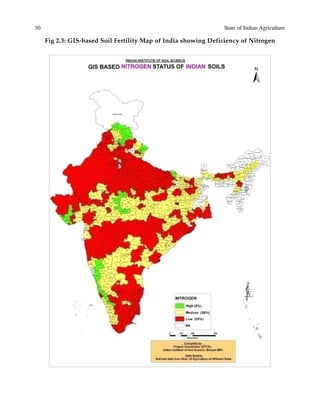
2.3 GIS Based soil Fertility Map of India showing deficiency of Nitrogen 30
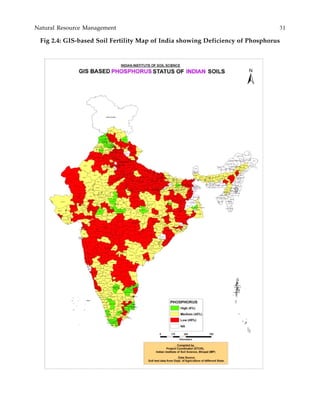
2.4 GIS Based soil Fertility Map of India showing deficiency of Phosphorus 31
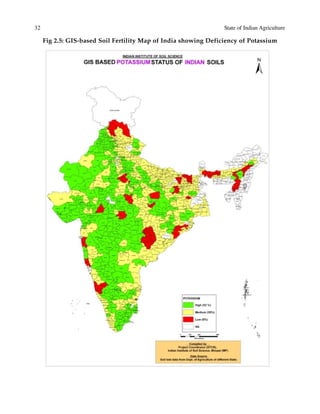
2.5 GIS Based soil Fertility Map of India showing deficiency of Potassium 32
Sl. Title Page
No. No.
List of Figures
vii
Server-33832AGRIFinal Report SIA-PressIndex.......
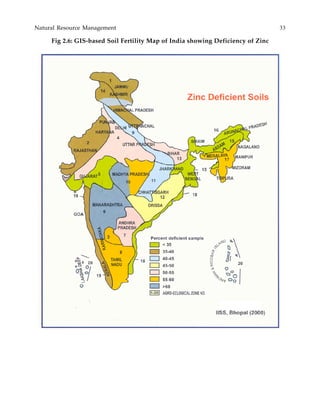
2.6 GIS Based soil Fertility Map of India showing deficiency of Zinc 33
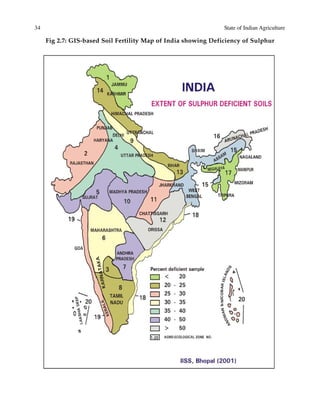
2.7 GIS Based soil Fertility Map of India showing deficiency of Sulphur 34
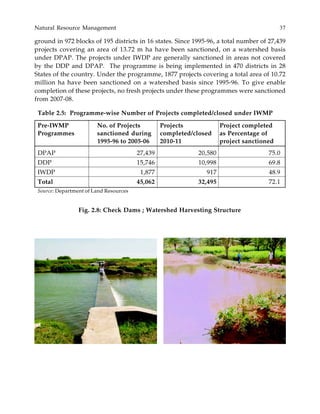
2.8 Check Dams: Watershed Harvesting Structures 37
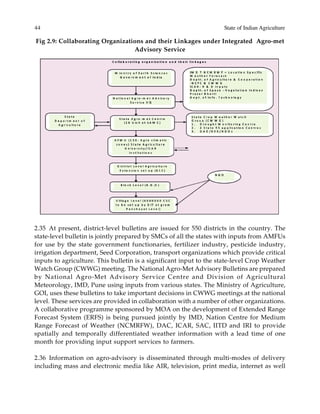
2.9 Collaborating organizations and their linkages under Integrated
Agro met Advisory Service 44
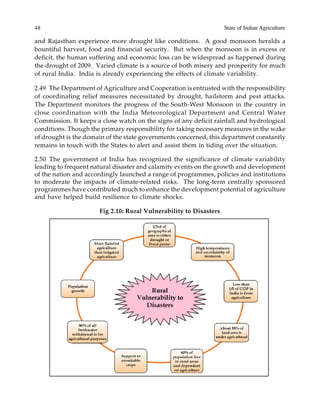
2.10 Rural Vulnerability to Disasters 48
3.1 Consumption, Production and Imports of Fertilisers in India 57
3.2 Popular Agricultural Equipments 66
3.3 Sources of Institutional Agricultural Credit 72
3.4 Target and Achievement of Agricultural Credit 75
4.1 Major Rice growing districts. 81
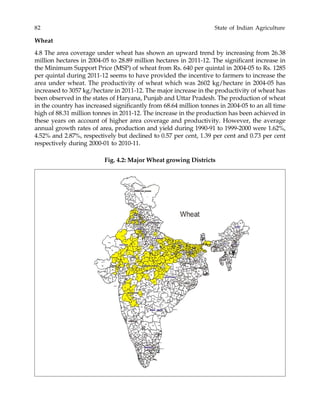
4.2 Major wheat growing districts. 82
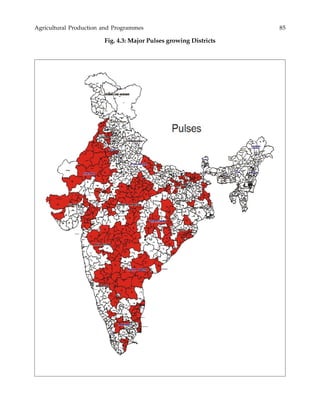
4.3 Major pulses growing districts. 85
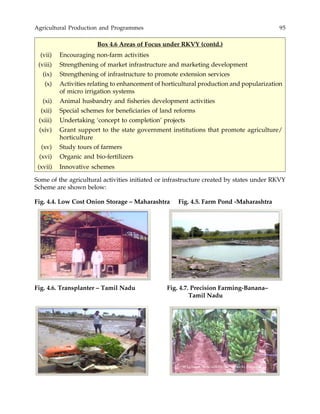
4.4 Low Cost Onion Storage – Maharashtra 95
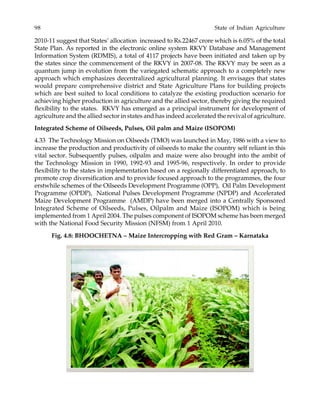
4.5 Farm Pond -Maharashtra 95
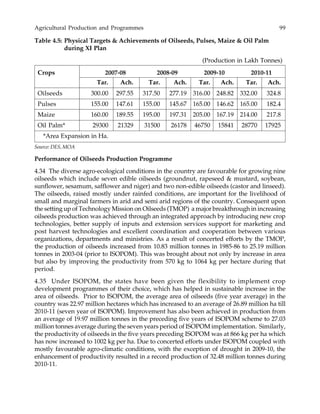
4.6 Transplanter – Tamil Nadu 95
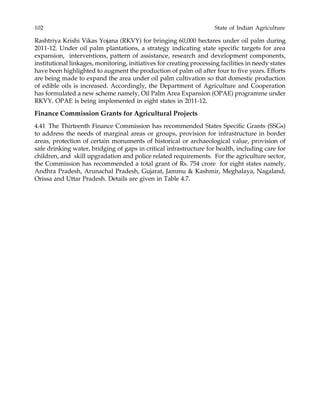
4.7 Precision Farming - Banana Tamil Nadu 95
4.8 BHOOCHETNA – Maize Intercropping with Red Gram – Karnataka 98
4.9 Predominant Horticulture Crops 108
4.10 Modern Cold Chain Storage, HP 112
4.11 Market Arrival of Fruits and Vegetables 116
4.12 Export of Horticultural Produce 116
4.13 Per Capita Availability of Cereals and Pulses 118
4.14 Per Capita consumption of cereals 119
4.15 Consumption of fruits and vegetables 119
4.16 Consumption of milk 120
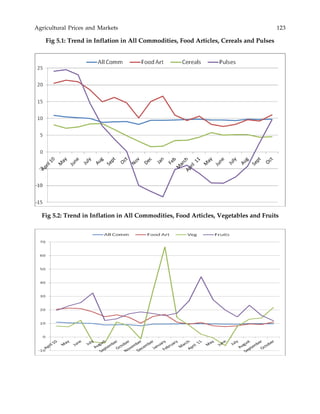
5.1 Trend in Inflation in All Commodities, Food Articles, Cereals
and Pulses 123
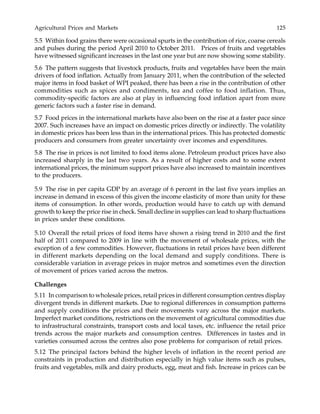
5.2 Trend in Inflation in All Commodities, Food Articles, Vegetables
and Fruits 123
5.3 Trend in Inflation in All Commodities, Food Articles, Milk, Eggs,
Meat and Fish (EMF) 124
5.4 Trend in Inflation in All Commodities, Food Articles, Sugar and
Edible Oils 124
Sl. Title Page
No. No.
viii
Server-33832AGRIFinal Report SIA-PressIndex.......
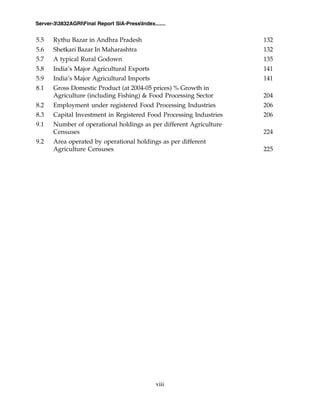
5.5 Rythu Bazar in Andhra Pradesh 132
5.6 Shetkari Bazar In Maharashtra 132
5.7 A typical Rural Godown 135
5.8 India’s Major Agricultural Exports 141
5.9 India’s Major Agricultural Imports 141
8.1 Gross Domestic Product (at 2004-05 prices) % Growth in
Agriculture (including Fishing) & Food Processing Sector 204
8.2 Employment under registered Food Processing Industries 206
8.3 Capital Investment in Registered Food Processing Industries 206
9.1 Number of operational holdings as per different Agriculture
Censuses 224
9.2 Area operated by operational holdings as per different
Agriculture Censuses 225
ix
Server-33832AGRIFinal Report SIA-PressIndex.......
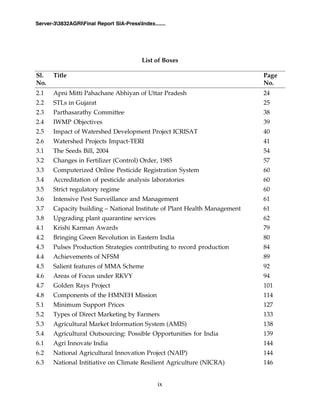
List of Boxes
Sl. Title Page
No. No.
2.1 Apni Mitti Pahachane Abhiyan of Uttar Pradesh 24
2.2 STLs in Gujarat 25
2.3 Parthasarathy Committee 38
2.4 IWMP Objectives 39
2.5 Impact of Watershed Development Project ICRISAT 40
2.6 Watershed Projects Impact-TERI 41
3.1 The Seeds Bill, 2004 54
3.2 Changes in Fertilizer (Control) Order, 1985 57
3.3 Computerized Online Pesticide Registration System 60
3.4 Accreditation of pesticide analysis laboratories 60
3.5 Strict regulatory regime 60
3.6 Intensive Pest Surveillance and Management 61
3.7 Capacity building – National Institute of Plant Health Management 61
3.8 Upgrading plant quarantine services 62
4.1 Krishi Karman Awards 79
4.2 Bringing Green Revolution in Eastern India 80
4.3 Pulses Production Strategies contributing to record production 84
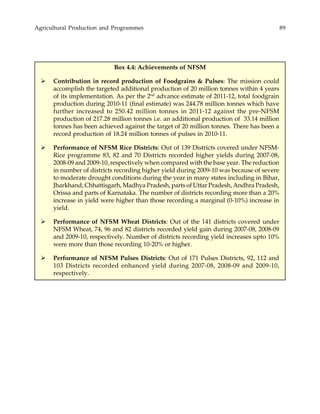
4.4 Achievements of NFSM 89
4.5 Salient features of MMA Scheme 92
4.6 Areas of Focus under RKVY 94
4.7 Golden Rays Project 101
4.8 Components of the HMNEH Mission 114
5.1 Minimum Support Prices 127
5.2 Types of Direct Marketing by Farmers 133
5.3 Agricultural Market Information System (AMIS) 138
5.4 Agricultural Outsourcing: Possible Opportunities for India 139
6.1 Agri Innovate India 144
6.2 National Agricultural Innovation Project (NAIP) 144
6.3 National Intitiative on Climate Resilient Agriculture (NICRA) 146
x
Server-33832AGRIFinal Report SIA-PressIndex.......
6.4 Challenges in climate change 147
6.5 Success in Varieties 148
6.6 Pigeonpea genome 149
6.7 Yellow Rust Disease 154
6.8 Borlaug Institute of South Asia 156
6.9 National Agricultural Bioinformatics Grid (NABG) 157
6.10 Buffalo cloning at NDRI, Karnal 165
6.11 National Academy of Agricultural Research Management (NAARM) 178
6.12 Open access policy for research journals 179
6.13 National Fund for Basic Strategic and Frontier Application Research
in Agriculture 180
6.14 National Academy of Agricultural Sciences (NAAS) 183
6.15 National Agriculture Science Centre 184
8.1 Components of Food Safety Schemes 209
8.2 Human Resource Development in Food Processing Sector 209
8.3 Achievements of IICPT 210
8.4 Achievements of the NMPPB 211
8.5 Functions and objectives of the IGPB 211
9.1 Computerized Online Pesticide Registration System 219
Sl. Title Page
No. No.
xi
Server-33832AGRIFinal Report SIA-PressIndex.......
List of Annexures
1.1 Plan-wise Growth Rates (%) by Economic Activity 227
1.2 Plan Wise Share (%) to Total Economy by Economic Activity 229
1.3 Plan Wise Year Wise Share (%) of Public & Private Sector in Gross Capital
Formation (GCF) 231
1.4 Plan Wise Year Wise (%) GCF/Investment 233
1.5 All India Average Annual Growth Rates of Area, Production and Yield of
Principal Crops 235
1.6 Disaggregated Public Sector Outlays / Expenditure under Agriculture
and Allied Activities 236
2.1 Land Use Classification 238
2.2 Agricultural Land by use in India 239
3.1 All-India Consumption of Fertilisers in Terms of Nutrients (N, P & K) 240
3.2 Fertiliser Consumption per Hectare in Selected Countries 241
3.3 Production and Consumption of Seed, Fertilizer and Pesticides in India 242
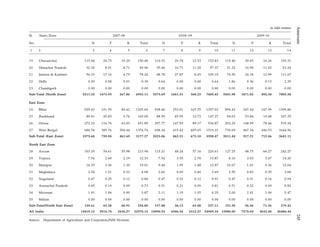
3.4 State-wise Consumption of Fertilizers 244
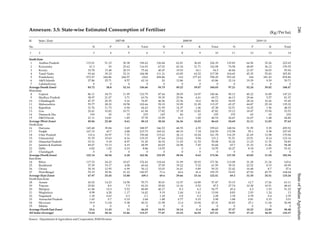
3.5 State-wise Estimated Consumption of Fertiliser per Hectare 246
3.6 Crop-wise Distribution of Certified/ Quality Seeds 247
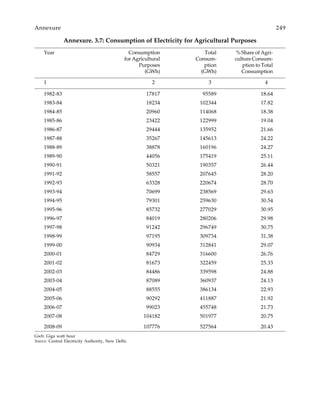
3.7 Consumption of Electricity for Agricultural Purposes 249
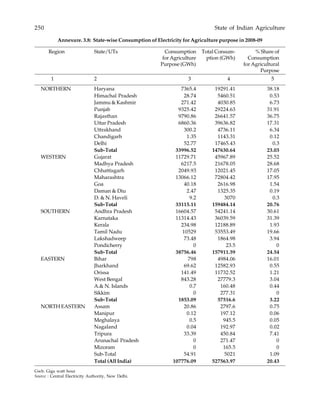
3.8 State-wise Consumption of Electricity for Agriculture purpose in 2008-09 250
3.9 State-wise Number of Kisan Credit Cards issued and amount sanctioned 251
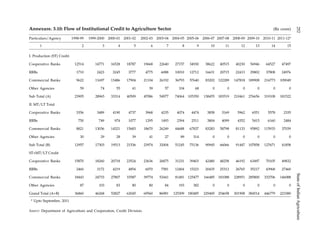
3.10 Flow of Institutional Credit to Agriculture Sector 252
3.11 National Agricultural Insurance Scheme (NAIS) 253
4.1 All India Estimates of Area of Foodgrains 254
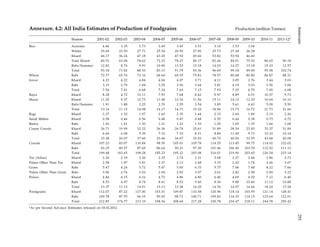
4.2 All India Estimates of Production of Foodgrains 255
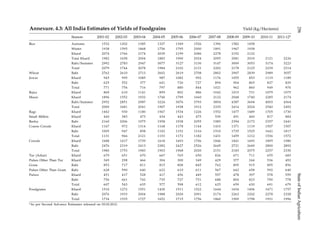
4.3 All India Estimates of Yields of Foodgrains 256
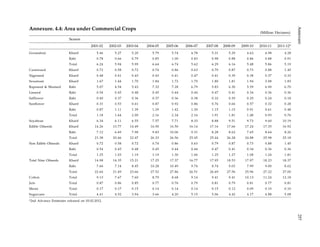
4.4 Area under Commercial Crops 257
4.5 Production of Commercial Crops 258
4.6 Yield of Commercial Crops 259
4.7 Area, Production and Productivity of Horticulture Crops 260
4.8 Per Capita Net Availability of Foodgrains (Per day) in India 261
4.9 Per capita Consumption of Conventional Food Items, 262
4.10 Per capita Consumption of Emerging Food Items 263
xii
Server-33832AGRIFinal Report SIA-PressIndex.......
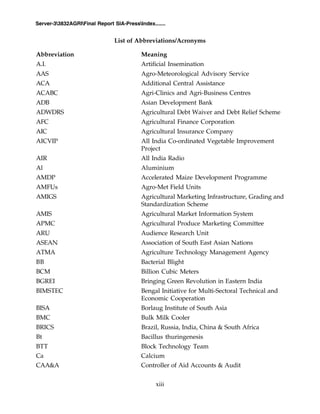
4.11 Percentage Composition of Consumer Expenditure 264
5.1 Wholesale Price Index of Principal Agri-commodity Groups 265
5.2 Rate of Inflation in Principal Commodity Groups 265
5.3 Minimum Support Prices 266
5.4 Top 10 Agricultural Export Items 267
5.5 Top 10 Agricultural Import Items 268
6.1 List of ICAR/DARE Institutions 269
6.2 List of Agricultural Universities 271
7.1 Production of Milk, Egg, Meat and Wool -All India 273
xiii
Server-33832AGRIFinal Report SIA-PressIndex.......
List of Abbreviations/Acronyms
Abbreviation Meaning
A.I. Artificial Insemination
AAS Agro-Meteorological Advisory Service
ACA Additional Central Assistance
ACABC Agri-Clinics and Agri-Business Centres
ADB Asian Development Bank
ADWDRS Agricultural Debt Waiver and Debt Relief Scheme
AFC Agricultural Finance Corporation
AIC Agricultural Insurance Company
AICVIP All India Co-ordinated Vegetable Improvement
Project
AIR All India Radio
Al Aluminium
AMDP Accelerated Maize Development Programme
AMFUs Agro-Met Field Units
AMIGS Agricultural Marketing Infrastructure, Grading and
Standardization Scheme
AMIS Agricultural Market Information System
APMC Agricultural Produce Marketing Committee
ARU Audience Research Unit
ASEAN Association of South East Asian Nations
ATMA Agriculture Technology Management Agency
BB Bacterial Blight
BCM Billion Cubic Meters
BGREI Bringing Green Revolution in Eastern India
BIMSTEC Bengal Initiative for Multi-Sectoral Technical and
Economic Cooperation
BISA Borlaug Institute of South Asia
BMC Bulk Milk Cooler
BRICS Brazil, Russia, India, China & South Africa
Bt Bacillus thuringenesis
BTT Block Technology Team
Ca Calcium
CAA&A Controller of Aid Accounts & Audit
xiv
Server-33832AGRIFinal Report SIA-PressIndex.......
CACP Commission for Agricultural Costs & Prices
CAFT Centre of Advanced Faculty Training
CAGR Compound Annual Growth Rate
CDAP Comprehensive District Agriculture Plan
CECA Comprehensive Economic Cooperation Agreement
CEPA Comprehensive Economic Partnership Agreement
CFBs Corrugated Fibreboard Boxes
CFDO Central Fodder Development Organization
CFSPF Central Fodder Seed Production Farm
CGMS Cytoplasmic Male Sterility
CIB&RC Central Insecticides Board & Registration Committee
CIL Central Insecticides Laboratory
CIMMYT International Maize and Wheat Improvement Centre
CIPMC Central Integrated Pest Management Center
CMTP Central Minikit Testing Programme
CMU Central Monitoring Unit
CORD-M Centre for Organizational Research & Development
in Management
CSC Central Seed Committee
CSO Central Statistical Organisation
CSTLs Central Seed Testing Laboratories
CV Coefficient of Variation
CWWG Crop Weather Watch Group
DAAPs District Agriculture Action Plans
DAC Department of Agriculture and Cooperation
DAHDF Department of Animal Husbandry, Dairying &
Fisheries
DAP Di-ammonium Phosphate
DARE Department of Agricultural Research and Extension
DDP Desert Development Programme
DEDS Dairy Entrepreneurship Development Scheme
DES Directorate of Economics and Statistics
DFQF Duty Free Quota Free
DG Director General
DHA Docosahexaenoic Acid
DLC District Level committees
xv
Server-33832AGRIFinal Report SIA-PressIndex.......
DPAP Drought Prone Area Programme
DPPQ&S Directorate of Plant Protection, Quarantine & Storage
DPQS Production and Distribution of Quality Seeds
DSS Decision Support System
DVCF Dairy Venture Capital Fund
EAPs Externally Aided Projects
EDP Entrepreneurship Development Programmes
EFTA European Free Trade Agreement
EOU Export Oriented Unit
EPA Eicosapetaenoic Acid
EPCG Export Promotion Capital Goods Scheme
ERFS Extended Range Forecast System
ESVHD Establishment and Strengthening of existing
Veterinary Hospitals and Dispensaries
et al. et alia (and others)
ETT Embryo Transfer Technology
EXIM Export Import
F&V Fruit and Vegetables
FAO Food and Agriculture Organization
FASAL Forecasting Agricultural Output using Space, Agro
meteorology and Land based observations
FCO Fertilizer Control Order
FDI Foreign Direct Investment
Fe Ferous/Iron
FFDA Fish Farmers Development Authority
FFSs Farmers’ Field Schools
FI Financial Institution
Fig. Figure
FLD Frontline Demonstration
FM Frequency Modulation
FMD Foot & Mouth Disease
FPO Farmer Producer Organizations
FPTC Food Processing Training Centres
FQCL Fertilizer Quality Control Laboratories
FTAs Free Trade Agreements
xvi
Server-33832AGRIFinal Report SIA-PressIndex.......
FYM Farm Yard Manure
FYP Five Year Plan
GAPs Good Agricultural Practices
GCF Gross Capital Formation
GDP Gross Domestic Product
GHGs Green House Gases
GHP Good Horticultural Practice
GIS Geographical Information System
GM Genetically Modified
GMP Good Manufacturing Practice
GPS Ground Positioning System
GR Gypsum Requirement
GSDP Gross State Domestic Product
GTZ German Technical Cooperation
HACCP Hazard Analysis and Critical Control Points
HMNEHS Horticulture Mission for North East & Himalayan
States
HRD Human Resource Development
HYVs High Yielding Varieties
IBSA India, Brazil, South Africa
ICAR Indian Council of Agricultural Research
ICRISAT International Crops Research Institute for Semi-
Arid Tropics
ICT Information and Communication Technology
IDA International Development Agency
IDWG Inter-Departmental Working Group
IFAD International Fund for Agriculture Development
IGPB Indian Grape Processing Board
IICPT Indian Institute of Crop Processing Technology
IIPR Indian Institute of Pulses Research
IISS Indian Institute of Soil Science
IMD Indian Meteorological Department
IPM Integrated Pest Management
IPPC International Plant Protection Convention
IPRs Intellectual Property Rights
IRIWI International Research Initiative for Wheat
Improvement
xvii
Server-33832AGRIFinal Report SIA-PressIndex.......
ISO International Organisation of Standardisation
ISOPOM Integrated Scheme of Oilseeds, Pulses, Oil palm and
Maize
ITDP Institute of Transportation and Development Policy
IVR Interactive Voice Response
IWDP Integrated Wastelands Development Programme
IWMP Integrated Watershed Management Programme
JFMCs Joint Forest Management Committees
JICA Japan International Cooperation Agency
JRF Junior Research Fellowship
K Potassium
KCC Kisan Call Centre/ Kisan Credit Cards
kg kilogram
LPA Long Period Average
LWO Locust Warning Organization
MANAGE National Institute of Agricultural Extension
Management
MAS Molecular Marker-assisted Selection
MBM Meat-cum-Bone Meal
MEROCOSUR Mercado Comun del Cono Sur / is a Spanish
Acronym meaning Southern Common Market
MF Military Farms
MFPS Mega Food Parks Scheme
Mg Magnesium
MGNREGA Mahatma Gandhi National Rural Employment
Guarantee Act
mha Million hectares
MIP Market Intervention Price
MIS Market Intervention Scheme
MMA Macro Management of Agriculture
MNAIS Modified National Agricultural Insurance Scheme
Mo Molybdenum
MoA Ministry of Agriculture
MOETT Multi Ovulation Embryo Transfer Technology
MoFPI Ministry of Food Processing Industries
MOP Muriate of Potash
xviii
Server-33832AGRIFinal Report SIA-PressIndex.......
MRIN Market Research Information Network
MRP Mixed Recall Period
MSP Minimum Support Price
MTCs Model Training Courses
N Nitrogen
NAAS National Academy of Agricultural Sciences
NABARD National Bank for Agricultural and Rural
Development
NABL National Accreditation Board for Testing and
Calibration Laboratories
NADRS National Animal Disease Reporting System
NAFED National Agricultural Cooperative Marketing
Federation
NAIS National Agricultural Insurance Scheme
NAMA Non Agricultural Market Access
NAPCC National Action Plan on Climate Change
NARP National Agricultural Research Project
NBSSLUP National Bureau of Soil Survey and Land Use
Planning
NCAP National Centre for Agricultural Economics and
Policy Research
NCDC National Cooperative Development Corporation
NCIPM National Centre for Integrated Pest Management
NDC National Development Council
NDDB National Dairy Development Board
NeGP-A National e Governance Plan in Agriculture
NFSM National Food Security Mission
NHM National Horticulture Mission
NIC National Informatics Centre
NIFTEM National Institute of Food Technology,
Entrepreneurship & Management
NIPHM National Institute of Plant Health Management
NLAs National Level Agencies
NMAM National Mission on Agricultural Mechanisation
NMPPB National Meat and Poultry Processing Board
NMPS National Mission for Protein Supplements
xix
Server-33832AGRIFinal Report SIA-PressIndex.......
NMSA National Mission for Sustainable Agriculture
NPCBB National Project for Cattle and Buffalo Breeding
NPIL National Pesticides Investigational Laboratory
NPMSH&F National Project on Management of Soil Health &
Fertility
NPPTI National Plant Protection Training Institute
NPRR National Pesticide Reference Repository
NPSD New Policy on Seed Development
NRC National Research Centre
NRCE National Research Centre on Equines
NSC National Seeds Corporation
NSRTC National Seed Research and Training Centre
NSS National Sample Survey
NSSO National Sample Survey Office
NTIs Nodal Training Institutes
NWDPRA National Watershed Development Project for Rainfed
Areas
OECD Organization for Economic Cooperation and
Development
OFT On Farm Trial
OPAE Oil Palm Area Expansion
OPDP Oil Palm Development Programme
OPP Oilseeds Development Programme
OTS One Time Settlement
PACS Primary Agricultural Credit Societies
PCR Polymerase Chain Reaction
PDS Public Distribution System
PFDC Precision Farming Development Centre
PG Post Graduation
PHM Post Harvest Management
PHTM Post Harvest Technology and Management
PKS Polyketide Synthase
PMTs Project Management Teams
PPP Public Private Partnerships
PPR Peste des Petits Ruminants
PPV&FR Protection of Plant Varieties and Farmers’ Rights
xx
Server-33832AGRIFinal Report SIA-PressIndex.......
PQSs Plant Quarantine Stations
PSCs Phytosanitary Certificates
PSS Price Supports Scheme
PTAs Preferential Trading Agreements
PUFAs Polyunsaturated Fatty Acids
QTL Quantitative Trait Loci
R& D Research and Development
RADP Rainfed Area Development Programme
RBH Rural Business Hubs
RC Registration Committee
RDIMS RKVY Database and Management Information
System
RIDF Rural Infrastructure Development Fund
RKVY Rashtriya Krishi Vikas Yojna
RPQS Regional Plant Quarantine Stations
RPTLs Regional Pesticides Testing Laboratories
RRBs Regional Rural Banks
RSFP&D Regional Stations for Forage Production and
Demonstration
RTPCR Rapid or Real Time Polymerase Chain Reaction
RVP & FPR River Valley Project & Flood Prone River
SAARC South Asian Association for Regional Cooperation
SAMCs State Meteorological Centres
SAMETI State Agricultural Management & Extension Training
Institutes
SAUs State Agricultural Universities
SCH Single Cross Hybrids
SDA Scheduled Desert Area
Se Selenium
SEWP State Extension Work Plan
SFCI State Farms Corporation of India
SHPIs Self Help Promoting Institutions
Si Silicon
SLC State Level Committees
SLSC State Level Sanctioning Committee
SLUB State Land Use Board
SNPs Single Nucleotide Polymorphisms
SOC Soil Organic Carbon
xxi
Server-33832AGRIFinal Report SIA-PressIndex.......
SRF Senior Research Fellowship
SRR Seed Replacement Rates
SSCAs State Seed Certification Agencies
SSCs State Seed Corporations
SSGs States Specific Grants
SSM Special Safeguard Mechanism
STCCS Short Term Cooperative Credit Structure
STLs Soil Testing Laboratories/ Seed Testing Laboratories
SW South West
TAR Technology Assessment and Refinement
TERI The Energy & Resources Institute
TFGs Tenant Farmers Groups
TMNE Technology Mission for Integrated Development of
Horticulture in North Eastern States including
Sikkim
TMO Technology Mission on Oilseeds
TN Tamil Nadu
TPDS Targeted Public Distribution Scheme
TVEs Town and Village Enterprises
UG Under Graduate
UNESCAP United Nation Economic and Social Commision for
Asia and the Pacific
UP Uttar Pradesh
URP Uniform Recall Period
UT Union Territory
VAT Value Added Tax
WB West Bengal
WBCIS Weather Based Crop Insurance Scheme
WDPs Watershed Development Programmes
WDPSCA Watershed Development Project in Shifting
Cultivation Areas
WFP World Food Programme
WHO World Health Organisation
WPI Wholesale Price Index
WTO World Trade Organisation
SDR Special Drawing Rights
CHAPTER 1
Indian Agriculture: Performance and Challenges
1.1 Agriculture is a critical sector of the Indian economy. Though its contribution to the
overall Gross Domestic Product (GDP) of the country has fallen from about 30 percent
in 1990-91 to less than 15 percent in 2011-12, a trend that is expected in the development
process of any economy, agriculture yet forms the backbone of development. An average
Indian still spends almost half of his/her total expenditure on food, while roughly half
of India’s work force is still engaged in agriculture for its livelihood. Being both a source
of livelihood and food security for a vast majority of low income, poor and vulnerable
sections of society, its performance assumes greater significance in view of the proposed
National Food Security Bill and the ongoing Mahatma Gandhi National Rural
Employment Guarantee Act (MGNREGA) scheme. The experience from BRICS countries
indicates that a one percentage growth in agriculture is at least two to three times more
effective in reducing poverty than the same growth emanating from non-agriculture
sectors. Given that India is still home to the largest number of poor and malnourished
people in the world, a higher priority to agriculture will achieve the goals of reducing
poverty and malnutrition as well as of inclusive growth. Since agriculture forms the
resource base for a number of agro-based industries and agro-services, it would be more
meaningful to view agriculture not as farming alone but as a holistic value chain, which
includes farming, wholesaling, warehousing (including logistics), processing, and
retailing. Further, it may be noted that in the last two Five Year Plans, it is clearly
mentioned that for the economy to grow at 9 per cent, it is important that agriculture
should grow at least by 4 per cent per annum.
1.2 Achieving an 8-9 percent rate of growth in overall GDP may not deliver much in
terms of poverty reduction unless agricultural growth accelerates. At the same time
‘growth with inclusiveness’ can be achieved only when agriculture growth accelerates
and is also widely shared amongst people and regions of the country. All these factors
point to just one thing: that agriculture has to be kept at the centre of any reform agenda
or planning process, in order to make a significant dent on poverty and malnutrition,
and to ensure long-term food security for the people.
1.3 This chapter briefly reviews the status and performance of agriculture, especially
during the last two decades, and also presents what could be the way forward, given
our objectives of accelerated growth, inclusiveness and the reducing of poverty and
hunger.
Structure and Structural Transformation of Indian Agriculture
1.4 The agriculture sector in India has undergone significant structural changes in the
form of decrease in share of GDP from 30 percent in 1990-91 to 14.5 percent in 2010-11
2 State of Indian Agriculture
indicating a shift from the traditional agrarian economy towards a service dominated
one (Fig 1.1). This decrease in agriculture’s contribution to GDP has not been accompanied
by a matching reduction in the share of agriculture in employment. About 52% of the
total workforce is still employed by the farm sector which makes more than half of the
Indian population dependant on agriculture for sustenance (NSS 66th
Round). However,
within the rural economy, the share of income from non-farm activities has also increased.
Fig 1.1: Sectoral Composition of GDP
1.5 The average size of operational holdings in India has diminished progressively from
2.28 ha in 1970-71 to 1.55 ha in 1990-91 to 1.23 ha in 2005-06 (Fig. 1.2). As per Agriculture
Census 2005-06, the proportion of marginal holdings (area less than 1 ha) has increased
from 61.6 percent in 1995-96 to 64.8 percent in 2005-06. This is followed by about 18 percent
small holdings (1-2 ha.), about 16 percent medium holdings (more than 2 to less than 10 ha.)
and less than 1 percent large holdings (10 ha. and above).
Fig 1.2: Average size (ha) of holdings as per different Agriculture Census
(for all size groups)
Source: Department of Agriculture and Cooperation, Agricultural Census Division, Ministry of Agriculture.
Source: CSO
Indian Agriculture: Performance and Challenges 3
1.6 With the declining share of agriculture to GDP, the continuing high pressure of
population on agriculture and the increasing fragmentation of land holdings leading to
decreasing availability of cultivated land area per household, the agriculture sector
alone would hardly be in a position to create additional employment opportunities to
sustain the livelihood of the rural households. This calls for creation of additional
employment opportunities in the non-farm and manufacturing sector, especially in agro
based rural industries which have area specific comparative advantage in terms of
resources endowment and development possibilities. This would require suitable skill
development of the people so as to gainfully employ them in non-farm activities. This
alone would be able to make agriculture viable in a sustainable manner. In addition, by
creating more employment and absorbing some of the surplus labour in agriculture,
this will contribute to achieving our objective of inclusive growth.
1.7 Fragmentation of operational holdings has widened the base of the agrarian pyramid
in most states. Empirical studies have, however, demonstrated that agricultural
productivity is size neutral. Factors that determine productivity favourably include
among others an easy and reliable access to modern inputs, access to suitable technology
tailored for specific needs, the presence of support infrastructure and innovative
marketing systems to aggregate and market the output from such small holdings
efficiently and effectively. In agricultural technology, the use of high yielding varieties
as in the case of Bt cotton and maize, economy in input use, the availability of quality
seeds and farming techniques such as system of rice intensification enabled finally by
marketing links all have high potential to improve yield.
Growth Performance of Agriculture
Overall Growth
1.8 The growth performance of the agriculture sector has been fluctuating across the
plan periods (Fig 1.3). It witnessed a growth rate of 4.8 per cent during the Eighth plan
period (1992–97). However, the agrarian situation saw a downturn towards the beginning
of the Ninth plan period (1997–2002) and the Tenth plan period (2002–07), when the
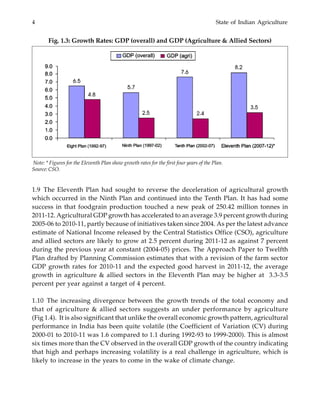
agricultural growth rate came down to 2.5 percent and 2.4 percent respectively. This
crippling growth rate of 2.4 percent in agriculture as against a robust annual average
overall growth rate of 7.6 per cent for the economy during the tenth plan period was
clearly a cause for concern. The trend rate of growth during the period 1992-93 to 2010-
11 is 2.8 percent while the average annual rate of growth in agriculture & allied sectors-
GDP during the same period is 3.2 percent.
4 State of Indian Agriculture
Fig. 1.3: Growth Rates: GDP (overall) and GDP (Agriculture & Allied Sectors)
1.9 The Eleventh Plan had sought to reverse the deceleration of agricultural growth
which occurred in the Ninth Plan and continued into the Tenth Plan. It has had some
success in that foodgrain production touched a new peak of 250.42 million tonnes in
2011-12. Agricultural GDP growth has accelerated to an average 3.9 percent growth during
2005-06 to 2010-11, partly because of initiatives taken since 2004. As per the latest advance
estimate of National Income released by the Central Statistics Office (CSO), agriculture
and allied sectors are likely to grow at 2.5 percent during 2011-12 as against 7 percent
during the previous year at constant (2004-05) prices. The Approach Paper to Twelfth
Plan drafted by Planning Commission estimates that with a revision of the farm sector
GDP growth rates for 2010-11 and the expected good harvest in 2011-12, the average
growth in agriculture & allied sectors in the Eleventh Plan may be higher at 3.3-3.5
percent per year against a target of 4 percent.
1.10 The increasing divergence between the growth trends of the total economy and
that of agriculture & allied sectors suggests an under performance by agriculture
(Fig 1.4). It is also significant that unlike the overall economic growth pattern, agricultural
performance in India has been quite volatile (the Coefficient of Variation (CV) during
2000-01 to 2010-11 was 1.6 compared to 1.1 during 1992-93 to 1999-2000). This is almost
six times more than the CV observed in the overall GDP growth of the country indicating
that high and perhaps increasing volatility is a real challenge in agriculture, which is
likely to increase in the years to come in the wake of climate change.
Note: * Figures for the Eleventh Plan show growth rates for the first four years of the Plan.
Source: CSO.
Indian Agriculture: Performance and Challenges 5
Fig 1.4: Comparative Performance of Growth of GDP and Agri-GDP
Regional Variations in Growth
1.11 The Indian agriculture growth pattern has been highly varied at the state level. Since
agriculture is a state subject, the overall performance of the agriculture sector in India largely
depends on what occurs at the state level. There is a wide variation in the performance of
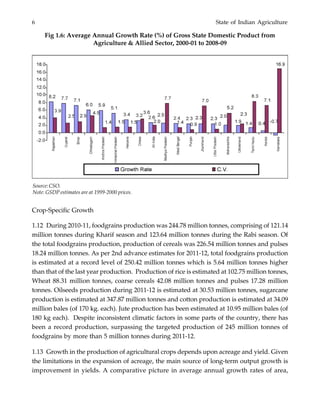
different states. During 2000-01 to 2008-09, the growth performance of agriculture in Rajasthan
(8.2%), Gujarat (7.7%) and Bihar (7.1%) was much higher than that of Uttar Pradesh (2.3%)
and West Bengal (2.4%). The recent dynamics of erstwhile poor performing states like Orissa,
Chhattisgarh and Himachal Pradesh showing strong growth in agriculture can be seen from
Fig. 1.5 & 1.6.
Fig. 1.5: Average Annual Growth Rate (%) of Gross State Domestic Product from
Agriculture & Allied Sector, 1994-95 to 1999-2000
Note: Figures are at 2004-05 prices.
Source: CSO.
Source: CSO.
Note: GSDP estimates are at 1993-94 prices.
6 State of Indian Agriculture
Fig 1.6: Average Annual Growth Rate (%) of Gross State Domestic Product from
Agriculture & Allied Sector, 2000-01 to 2008-09
Crop-Specific Growth
1.12 During 2010-11, foodgrains production was 244.78 million tonnes, comprising of 121.14
million tonnes during Kharif season and 123.64 million tonnes during the Rabi season. Of
the total foodgrains production, production of cereals was 226.54 million tonnes and pulses
18.24 million tonnes. As per 2nd advance estimates for 2011-12, total foodgrains production
is estimated at a record level of 250.42 million tonnes which is 5.64 million tonnes higher
than that of the last year production. Production of rice is estimated at 102.75 million tonnes,
Wheat 88.31 million tonnes, coarse cereals 42.08 million tonnes and pulses 17.28 million
tonnes. Oilseeds production during 2011-12 is estimated at 30.53 million tonnes, sugarcane
production is estimated at 347.87 million tonnes and cotton production is estimated at 34.09
million bales (of 170 kg. each). Jute production has been estimated at 10.95 million bales (of
180 kg each). Despite inconsistent climatic factors in some parts of the country, there has
been a record production, surpassing the targeted production of 245 million tonnes of
foodgrains by more than 5 million tonnes during 2011-12.
1.13 Growth in the production of agricultural crops depends upon acreage and yield. Given
the limitations in the expansion of acreage, the main source of long-term output growth is
improvement in yields. A comparative picture in average annual growth rates of area,
Source: CSO.
Note: GSDP estimates are at 1999-2000 prices.
Indian Agriculture: Performance and Challenges 7
production, and yield of different crops for two periods 1990-91 to 1999-2000 and 2000-01 to
2010-11 is given in Table 1.1. In the case of wheat, the growth in area and yield have been
marginal during 2000-01 to 2010-11 suggesting that the yield levels have plateaued for
this crop. This suggests the need for renewed research to boost production and
productivity.
1.14 All the major coarse cereals display a negative growth in area during both the periods
except for maize, which recorded an annual growth rate of 2.68 per cent in the 2000-01 to
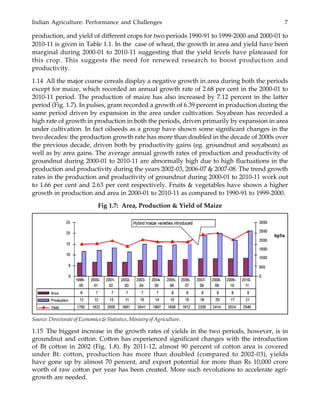
2010-11 period. The production of maize has also increased by 7.12 percent in the latter
period (Fig. 1.7). In pulses, gram recorded a growth of 6.39 percent in production during the
same period driven by expansion in the area under cultivation. Soyabean has recorded a
high rate of growth in production in both the periods, driven primarily by expansion in area
under cultivation. In fact oilseeds as a group have shown some significant changes in the
two decades: the production growth rate has more than doubled in the decade of 2000s over
the previous decade, driven both by productivity gains (eg. groundnut and soyabean) as
well as by area gains. The average annual growth rates of production and productivity of
groundnut during 2000-01 to 2010-11 are abnormally high due to high fluctuations in the
production and productivity during the years 2002-03, 2006-07 & 2007-08. The trend growth
rates in the production and productivity of groundnut during 2000-01 to 2010-11 work out
to 1.66 per cent and 2.63 per cent respectively. Fruits & vegetables have shown a higher
growth in production and area in 2000-01 to 2010-11 as compared to 1990-91 to 1999-2000.
Fig 1.7: Area, Production & Yield of Maize
1.15 The biggest increase in the growth rates of yields in the two periods, however, is in
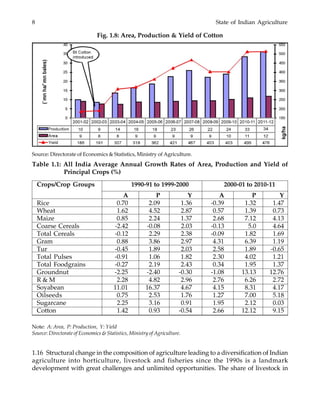
groundnut and cotton. Cotton has experienced significant changes with the introduction
of Bt cotton in 2002 (Fig. 1.8). By 2011-12, almost 90 percent of cotton area is covered
under Bt. cotton, production has more than doubled (compared to 2002-03), yields
have gone up by almost 70 percent, and export potential for more than Rs 10,000 crore
worth of raw cotton per year has been created. More such revolutions to accelerate agri-
growth are needed.
Source: Directorate of Economics & Statistics, Ministry of Agriculture.
8 State of Indian Agriculture
Fig. 1.8: Area, Production & Yield of Cotton
Table 1.1: All India Average Annual Growth Rates of Area, Production and Yield of
Principal Crops (%)
Crops/Crop Groups 1990-91 to 1999-2000 2000-01 to 2010-11
A P Y A P Y
Rice 0.70 2.09 1.36 -0.39 1.32 1.47
Wheat 1.62 4.52 2.87 0.57 1.39 0.73
Maize 0.85 2.24 1.37 2.68 7.12 4.13
Coarse Cereals -2.42 -0.08 2.03 -0.13 5.0 4.64
Total Cereals -0.12 2.29 2.38 -0.09 1.82 1.69
Gram 0.88 3.86 2.97 4.31 6.39 1.19
Tur -0.45 1.89 2.03 2.58 1.89 -0.65
Total Pulses -0.91 1.06 1.82 2.30 4.02 1.21
Total Foodgrains -0.27 2.19 2.43 0.34 1.95 1.37
Groundnut -2.25 -2.40 -0.30 -1.08 13.13 12.76
R & M 2.28 4.82 2.96 2.76 6.26 2.72
Soyabean 11.01 16.37 4.67 4.15 8.31 4.17
Oilseeds 0.75 2.53 1.76 1.27 7.00 5.18
Sugarcane 2.25 3.16 0.91 1.95 2.12 0.03
Cotton 1.42 0.93 -0.54 2.66 12.12 9.15
1.16 Structural change in the composition of agriculture leading to a diversification of Indian
agriculture into horticulture, livestock and fisheries since the 1990s is a landmark
development with great challenges and unlimited opportunities. The share of livestock in
Note: A: Area, P: Production, Y: Yield
Source: Directorate of Economics & Statistics, Ministry of Agriculture.
Indian Agriculture: Performance and Challenges 9
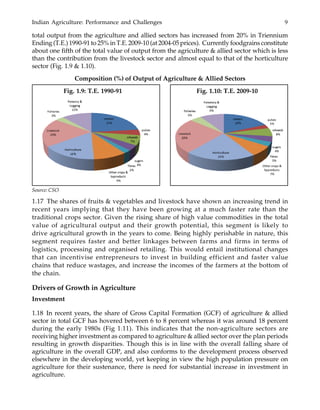
total output from the agriculture and allied sectors has increased from 20% in Triennium
Ending (T.E.) 1990-91 to 25% in T.E. 2009-10 (at 2004-05 prices). Currently foodgrains constitute
about one fifth of the total value of output from the agriculture & allied sector which is less
than the contribution from the livestock sector and almost equal to that of the horticulture
sector (Fig. 1.9 & 1.10).
Composition (%) of Output of Agriculture & Allied Sectors
Fig. 1.9: T.E. 1990-91 Fig. 1.10: T.E. 2009-10
1.17 The shares of fruits & vegetables and livestock have shown an increasing trend in
recent years implying that they have been growing at a much faster rate than the
traditional crops sector. Given the rising share of high value commodities in the total
value of agricultural output and their growth potential, this segment is likely to
drive agricultural growth in the years to come. Being highly perishable in nature, this
segment requires faster and better linkages between farms and firms in terms of
logistics, processing and organised retailing. This would entail institutional changes
that can incentivise entrepreneurs to invest in building efficient and faster value
chains that reduce wastages, and increase the incomes of the farmers at the bottom of
the chain.
Drivers of Growth in Agriculture
Investment
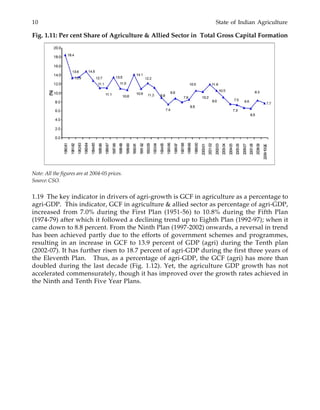
1.18 In recent years, the share of Gross Capital Formation (GCF) of agriculture & allied
sector in total GCF has hovered between 6 to 8 percent whereas it was around 18 percent
during the early 1980s (Fig 1.11). This indicates that the non-agriculture sectors are
receiving higher investment as compared to agriculture & allied sector over the plan periods
resulting in growth disparities. Though this is in line with the overall falling share of
agriculture in the overall GDP, and also conforms to the development process observed
elsewhere in the developing world, yet keeping in view the high population pressure on
agriculture for their sustenance, there is need for substantial increase in investment in
agriculture.
Source: CSO
10 State of Indian Agriculture
Fig. 1.11: Per cent Share of Agriculture & Allied Sector in Total Gross Capital Formation
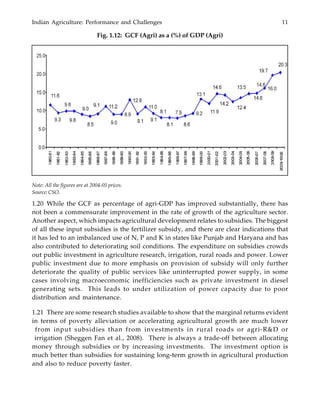
1.19 The key indicator in drivers of agri-growth is GCF in agriculture as a percentage to
agri-GDP. This indicator, GCF in agriculture & allied sector as percentage of agri-GDP,
increased from 7.0% during the First Plan (1951-56) to 10.8% during the Fifth Plan
(1974-79) after which it followed a declining trend up to Eighth Plan (1992-97); when it
came down to 8.8 percent. From the Ninth Plan (1997-2002) onwards, a reversal in trend
has been achieved partly due to the efforts of government schemes and programmes,
resulting in an increase in GCF to 13.9 percent of GDP (agri) during the Tenth plan
(2002-07). It has further risen to 18.7 percent of agri-GDP during the first three years of
the Eleventh Plan. Thus, as a percentage of agri-GDP, the GCF (agri) has more than
doubled during the last decade (Fig. 1.12). Yet, the agriculture GDP growth has not
accelerated commensurately, though it has improved over the growth rates achieved in
the Ninth and Tenth Five Year Plans.
Note: All the figures are at 2004-05 prices.
Source: CSO.
Indian Agriculture: Performance and Challenges 11
Fig. 1.12: GCF (Agri) as a (%) of GDP (Agri)
1.20 While the GCF as percentage of agri-GDP has improved substantially, there has
not been a commensurate improvement in the rate of growth of the agriculture sector.
Another aspect, which impacts agricultural development relates to subsidies. The biggest
of all these input subsidies is the fertilizer subsidy, and there are clear indications that
it has led to an imbalanced use of N, P and K in states like Punjab and Haryana and has
also contributed to deteriorating soil conditions. The expenditure on subsidies crowds
out public investment in agriculture research, irrigation, rural roads and power. Lower
public investment due to more emphasis on provision of subsidy will only further
deteriorate the quality of public services like uninterrupted power supply, in some
cases involving macroeconomic inefficiencies such as private investment in diesel
generating sets. This leads to under utilization of power capacity due to poor
distribution and maintenance.
1.21 There are some research studies available to show that the marginal returns evident
in terms of poverty alleviation or accelerating agricultural growth are much lower
from input subsidies than from investments in rural roads or agri-R&D or
irrigation (Sheggen Fan et al., 2008). There is always a trade-off between allocating
money through subsidies or by increasing investments. The investment option is
much better than subsidies for sustaining long-term growth in agricultural production
and also to reduce poverty faster.
Note: All the figures are at 2004-05 prices.
Source: CSO.
12 State of Indian Agriculture
Fig. 1.13: Share (%) of Public and Private Investment in Agriculture & Allied Sectors
1.22 It is interesting to note that while public investment in agriculture is critical and
important, in actual terms, it forms about 20 percent of the total investment in agriculture;
80 percent comes from the private sector (Fig. 1.13). In the early 1980s, for example, the share
of the public sector and private sector (including household sector) in gross capital formation
in agriculture was roughly equal, but by the early 2000s, the share of the private sector was
four times larger than the share of the public sector at 2004-05 prices. Moreover, the private
sector responds much better and faster to the incentive structures in agriculture. Hence,
along with bringing in greater public investment in agriculture, there is a need for bringing
in reforms in the incentive structure.
Irrigation, Seeds, Fertilizers and Credit
1.23 There is no doubt that the overall size, quality, and efficiency of investment are always
the key drivers of growth in any sector. In case of public investments in agriculture, as
defined in the National Accounts Statistics, more than 80 percent is accounted for major and
medium irrigation schemes. Even in the case of private investments in agriculture, almost
half is accounted for by irrigation (minor, primarily through groundwater, but also now
increasingly drip, etc.). So irrigation remains the most dominant component in the overall
investment in agriculture. Without proper use of water, it is difficult to get good returns on
better high yielding seeds and higher doses of fertilizers. Water will remain a critical input
for agriculture in the decades to come until science develops seeds that can thrive in dry
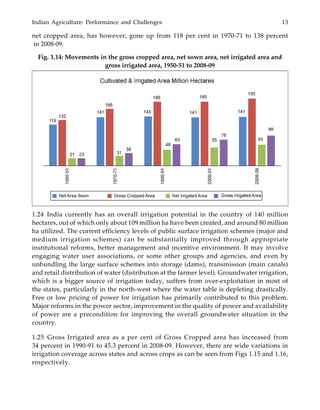
climate with very little water. The net sown area has remained around 141 million hectares
during the last 40 years. The cropping intensity, i.e., the ratio of gross cropped area to
Source: Directorate of Economics & Statistics, Ministry of Agriculture & CSO.
Indian Agriculture: Performance and Challenges 13
net cropped area, has however, gone up from 118 per cent in 1970-71 to 138 percent
in 2008-09.
Fig. 1.14: Movements in the gross cropped area, net sown area, net irrigated area and
gross irrigated area, 1950-51 to 2008-09
1.24 India currently has an overall irrigation potential in the country of 140 million
hectares, out of which only about 109 million ha have been created, and around 80 million
ha utilized. The current efficiency levels of public surface irrigation schemes (major and
medium irrigation schemes) can be substantially improved through appropriate
institutional reforms, better management and incentive environment. It may involve
engaging water user associations, or some other groups and agencies, and even by
unbundling the large surface schemes into storage (dams), transmission (main canals)
and retail distribution of water (distribution at the farmer level). Groundwater irrigation,
which is a bigger source of irrigation today, suffers from over-exploitation in most of
the states, particularly in the north-west where the water table is depleting drastically.
Free or low pricing of power for irrigation has primarily contributed to this problem.
Major reforms in the power sector, improvement in the quality of power and availability
of power are a precondition for improving the overall groundwater situation in the
country.
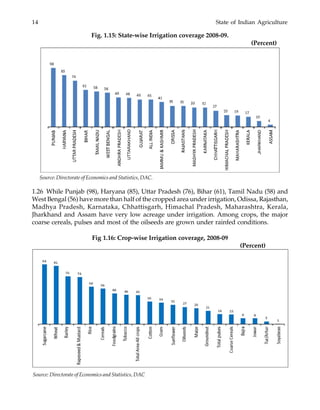
1.25 Gross Irrigated area as a per cent of Gross Cropped area has increased from
34 percent in 1990-91 to 45.3 percent in 2008-09. However, there are wide variations in
irrigation coverage across states and across crops as can be seen from Figs 1.15 and 1.16,
respectively.
63
88
14 State of Indian Agriculture
Fig. 1.15: State-wise Irrigation coverage 2008-09.
(Percent)
1.26 While Punjab (98), Haryana (85), Uttar Pradesh (76), Bihar (61), Tamil Nadu (58) and
West Bengal (56) have more than half of the cropped area under irrigation, Odissa, Rajasthan,
Madhya Pradesh, Karnataka, Chhattisgarh, Himachal Pradesh, Maharashtra, Kerala,
Jharkhand and Assam have very low acreage under irrigation. Among crops, the major
coarse cereals, pulses and most of the oilseeds are grown under rainfed conditions.
Fig 1.16: Crop-wise Irrigation coverage, 2008-09
(Percent)
Source: Directorate of Economics and Statistics, DAC.
Source: Directorate of Economics and Statistics, DAC
UTTARAKHAND
JHARKHAND
Indian Agriculture: Performance and Challenges 15
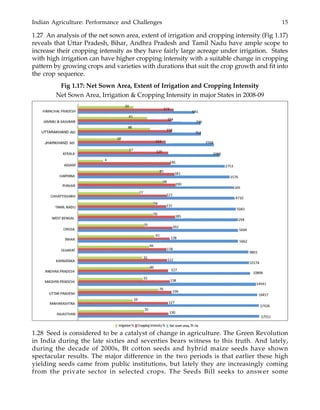
1.27 An analysis of the net sown area, extent of irrigation and cropping intensity (Fig 1.17)
reveals that Uttar Pradesh, Bihar, Andhra Pradesh and Tamil Nadu have ample scope to
increase their cropping intensity as they have fairly large acreage under irrigation. States
with high irrigation can have higher cropping intensity with a suitable change in cropping
pattern by growing crops and varieties with durations that suit the crop growth and fit into
the crop sequence.
Fig 1.17: Net Sown Area, Extent of Irrigation and Cropping Intensity
Net Sown Area, Irrigation & Cropping Intensity in major States in 2008-09
1.28 Seed is considered to be a catalyst of change in agriculture. The Green Revolution
in India during the late sixties and seventies bears witness to this truth. And lately,
during the decade of 2000s, Bt cotton seeds and hybrid maize seeds have shown
spectacular results. The major difference in the two periods is that earlier these high
yielding seeds came from public institutions, but lately they are increasingly coming
from the private sector in selected crops. The Seeds Bill seeks to answer some
UTTARAKHAND
JHARKHAND
16 State of Indian Agriculture
of these concerns, while increasing the level of public investment in domestic R&D,
along with institutional reforms that can deliver. Overall, the seed replacement rate has
been improving, but much more can be done in this regard to give a boost to productivity
through seed improvement.
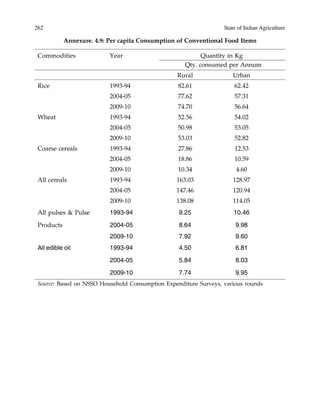
Fig. 1.18: Production and Distribution of Seeds in India
1.29 Fertilizer forms another important input in agriculture growth. While the overall
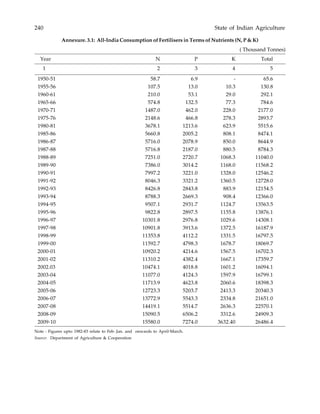
consumption of fertilizer has increased from 70 kg per ha in 1991-92 to 144 kg per ha by
2010-11, (Fig. 1.19 & 1.20) the N, P, K balance particularly, in high fertilizer use areas(e.g.
northwest) is seriously distorted. It is apparent that an integrated nutrient management
approach is required to enable a balanced use of fertilizers for optimum results. Also, the
setting up of adequate capacity for soil testing needs to be continued.
Fig. 1.19: Consumption of Fertilisers in India
Source: Directorate of Economics and Statistics, DAC.
Indian Agriculture: Performance and Challenges 17
Fig. 1.20: Share of Nitrogen, Phosphatic, and Potassic Fertilizers in total fertilizer
consumption during 2000-01 and 2010-11
1.30 Credit to buy modern inputs for farming operations, is a facilitator in this change.
While the overall credit to agriculture has been growing phenomenally during the last
five years or so, and the interest rates for farmers have also been reduced to 7 percent
(4 percent after taking into account the 3 percent subvention in interest for timely
repayment of crop loans), yet the biggest challenge remains in terms of increasing access to
credit, particularly for the bottom 40 percent. More innovative models are needed to
reach this category as they rely largely on the informal sector for credit with high rates of
interest.
Emerging Demand—Supply Imbalances
1.31 With the Indian economy growing at 8 percent and higher expenditure elasticity of
fruits & vegetables and livestock as compared to cereals, there is an increasing pressure on
the prices of such high value perishable commodities. The per capita monthly consumption
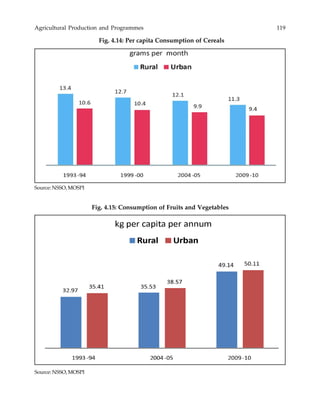
of cereals has declined from 14.80 kg in 1983-84 to 12.11 kg in 2004-05 and further to 11.35 kg
in 2009-10 in the rural areas. In the urban areas, it has declined from 11.30 kg in 1983-84 to
9.94 kg in 2004-05 and to 9.37kg. in 2009-10. The agricultural production basket is still not
fully aligned to the emerging demand patterns.
Trade in Agricultural Commodities
1.32 The policy reforms of the 1990s more or less eliminated the bias against agriculture by
lowering industrial tariffs and correcting for the overvalued exchange rates which lead to
an improvement in the terms of trade in favour of agriculture. This was followed by a
calibrated liberalization of agri- exports and imports. As a result, Indian agriculture has
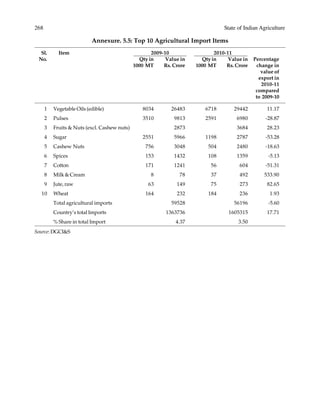
increasingly been opened to global agriculture with the ratio of agricultural exports and
imports as a percent of Agricultural GDP rising from 4.9 percent in 1990-91 to 12.7 percent in
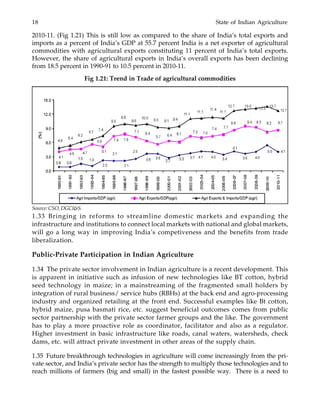
18 State of Indian Agriculture
2010-11. (Fig 1.21) This is still low as compared to the share of India’s total exports and
imports as a percent of India’s GDP at 55.7 percent India is a net exporter of agricultural
commodities with agricultural exports constituting 11 percent of India’s total exports.
However, the share of agricultural exports in India’s overall exports has been declining
from 18.5 percent in 1990-91 to 10.5 percent in 2010-11.
Fig 1.21: Trend in Trade of agricultural commodities
1.33 Bringing in reforms to streamline domestic markets and expanding the
infrastructure and institutions to connect local markets with national and global markets,
will go a long way in improving India’s competiveness and the benefits from trade
liberalization.
Public-Private Participation in Indian Agriculture
1.34 The private sector involvement in Indian agriculture is a recent development. This
is apparent in initiative such as infusion of new technologies like BT cotton, hybrid
seed technology in maize; in a mainstreaming of the fragmented small holders by
integration of rural business/ service hubs (RBHs) at the back end and agro-processing
industry and organized retailing at the front end. Successful examples like Bt cotton,
hybrid maize, pusa basmati rice, etc. suggest beneficial outcomes comes from public
sector partnership with the private sector farmer groups and the like. The government
has to play a more proactive role as coordinator, facilitator and also as a regulator.
Higher investment in basic infrastructure like roads, canal waters, watersheds, check
dams, etc. will attract private investment in other areas of the supply chain.
1.35 Future breakthrough technologies in agriculture will come increasingly from the pri-
vate sector, and India’s private sector has the strength to multiply those technologies and to
reach millions of farmers (big and small) in the fastest possible way. There is a need to
Source: CSO, DGCI&S.
Indian Agriculture: Performance and Challenges 19
channelize these sources in an orderly manner, so that in the process, apart from the private
sector profitability, the farming community is also benefited. This will assist in pushing
Indian agriculture to a higher and more sustainable growth which would be the most
powerful engine for poverty reduction. For areas where the private sector has not shown
much interest such as rainfed areas, tribal areas, natural resource management, pulses, mil-
lets, the role of public research system would continue to be critical.
Price Policy
1.36 Though with economic liberalization and gradual integration with the world economy,
relaxation of export controls on several agricultural products since 1991 have helped
agricultural exports, there are still occasional interventions by the government (for example,
export bans on wheat and rice, or limits on the stocking of grains by private trade that
dissuade the private sector players from investing in the agri-system. However, one of the
main government interventions in the agricultural markets currently is its policy of minimum
support prices (MSP) for agricultural commodities. For procurement of horticultural
commodities which are perishable in nature and not covered under the Price Support Scheme,
with a view to protect the growers of these commodities from making distress sale in the
event of bumper crop during the peak harvesting periods when the prices tend to fall below
the economic cost of production, a Market Intervention Scheme (MIS) is implemented on
the request of a State /UT Government which is ready to bear 50 percent loss (25 percent in
case of North-Eastern States), if any, incurred on its implementation.
Marketing and Warehouse Facilities
1.37 In the context of foodgrains policy, concern has been raised about simultaneous
occurrence of high food inflation and large foodgrains stocks in our granaries. It has been
argued (Kaushik Basu, 2011) that, in creating a better foodgrains policy, it is imperative that
the entire system of foodgrains production, procurement, release and distribution is looked
at. Besides improving storage facilities there is a need to redesign the mechanics of
procurement and release of foodgrains to the market to ensure that the impact on prices is
substantial in the desire direction. An improvement in marketing conditions and
encouragement to private sector participation can be achieved by reforming the Agricultural
Produce Marketing Committee (APMC) Acts. Appropriate changes in the APMC Acts can
boost private sector investment in developing regularized markets, logistics and warehouse
receipt systems, futures markets, and in infrastructure (such as cold storage facilities, quality
certification, etc.) for imports and exports. This is particularly relevant for the high value
segment that is currently hostage to high post-harvest losses and weak farm-firm linkages.
The introduction of the Model Act in 2003 was directed towards allowing private market
yards, direct buying and selling, and also to promote and regulate contract farming in
high value agriculture. Although many states have adopted the new Model Act,
with modifications, its impact on farmers in terms of better prices for their produce and a
reduction in the high differences between farm harvest prices and consumer prices is not
yet visible.
20 State of Indian Agriculture
Land and Credit Markets
1.38 The linking of small and fragmented farms with large-scale processors and retailers
remains a challenge in the high value sector, and restricted land (lease) markets tend to
compound the problem. Allaying the fears of a farmer regarding possible alienation from
his own land because of leasing it out to the retailer/processor require the freeing up of
land lease markets. Legalizing lease markets also protects the interests of the retailer/
processor, and enables him to undertake larger investments. In this context, it may be helpful
to ensure the registration of land deeds and the computerization of land records for bringing
about greater transparency and reliability. Some states have made a beginning in
computerizing the land records, but most others have a long way to go. The land and credit
markets are intricately linked, and improving the marketability of land will enhance access
of farmers to institutional credit that requires the pledging of collaterals.
The Way Forward
1.39 The significance of agriculture sector in India is not restricted to its contribution to
GDP, but that on account of its complementarity with other sectors. It has far reaching ability
to impact poverty alleviation and rural development. There are several areas of importance
for the agriculture sector growth. These include, among others, enhancing public sector
investment in research apart from effective transfer of technology along with institutional
reforms in the research set up to make it more accountable and geared towards delivery,
conservation of land, water and biological resources, the development of rainfed agriculture,
the development of minor irrigation, timely and adequate availability of inputs, support
for marketing infrastructure, an increase in flow of credit particularly to the small and
marginal farmers.
1.40 Achievement of food and nutrition security and alleviation of poverty and unemployment
on a sustainable basis depend on the efficient and judicious use of natural resources (land/
soil, water, agri-biodiversity and climate). Inefficient use and mismanagement of productive
resources, especially land, water, energy and agro-chemicals has vastly reduced fertility and
damaged the physical, chemical and biological properties of the soil. The limit of land
availability for agriculture has already reached. Our continued inability to judiciously use
these non-renewable natural resources can have serious implications.
1.41 The transition from traditional to high value agriculture will be primarily driven by
private investments, which are three fourths of total investments in agriculture. However,
to ensure that this happens smoothly and rapidly, government policy needs to act as a
catalyst by way of providing greater investments in R&D, roads and public irrigation.
1.42 A strategic vision for agriculture must factor in three important elements: (a) India’s
comparative advantage; (b) efficient markets at home and freer trade; and (c) environmental
sustainability. The agriculture sector calls for major reforms, from marketing to investment
and institutional change, especially in water management, new technologies, land markets
and creation of efficient value chains.
1.43 The subsequent chapters give in detail the progress made in each component and
various programmes of agriculture, and the way forward.
CHAPTER 2
Natural Resource Management
Land use
2.1 Changes in land use in India have intensified in the recent years under pressure of
population, economic forces, livestock pressure and weakening of various types of
institutions that regulate land use formally or informally. Natural factors have also
caused some change in the land use pattern. In the absence of any well thought out plan
and policy, indiscriminate change in land use has several implications that impinge
upon sustainable and optimum use and result in a haphazard development devoid of
economic, social, environmental and aesthetic sense.
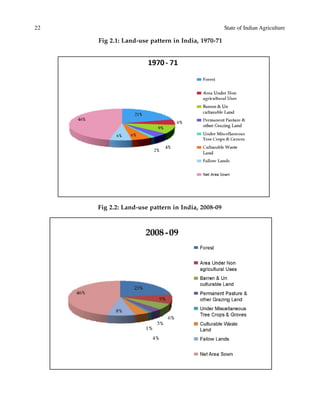
2.2 Land use classification based on different type of uses shows that of a total land
mass of 328.73 million ha in the country, the reported area for land utilization has been
306 million ha. This includes 141 million ha (about 46 percent of the reported area) net
sown area, 70 million ha (23 percent) under forest, 26 million ha under non-agricultural
uses, 25 million ha fallow land, 17 million ha barren and unculturable land, 13 million
ha culturable waste land, 10 million ha under permanent pasture and other grazing
land, and 3 million ha under miscellaneous tree crops and groves. Over the years there
has been a gradual increase in area put to non-agricultural uses. During the last forty
years (1970-71 to 2008-09) the net sown area has remained, by and large, constant at
141 million ha. Area under non-agricultural uses has increased from 16 million ha to
26 million ha, while the area under barren and unculturable land has come down from
28 million has in 1970-71 to 17 million ha in 2008-09. However, the gross cropped area
has increased from 166 million ha. in 1970-71 to 195 million ha in 2008-09. As a normal
process of urbanization and development, the area under non-agricultural uses is
increasing, but due to efforts of the government, land has been reclaimed for cultivation
from barren and culturable waste land category. The cropping intensity has increased
from 118 percent to 138 percent during the same period. Owing to a burgeoning
population, it is estimated that per capita total land availability which was 0.32 ha in
2001 against the world average of 2.19 ha will decrease to 0.23 ha in 2025 and 0.19 ha in
2050. Further, it is reported that about 120 million ha land is degraded in India, and
about 5334 million tonnes of soil is lost annually through soil erosion. Out of 120 million
ha degraded area, water erosion accounts for 68 per cent, chemical degradation
21 per cent, wind erosion 10 per cent and the rest physical degradation. Effective land
management policies are required to address these issues in addition to other concerns
such as small size and fragmented holdings, tenancy, ceiling limits, acquisition and
diversion of productive land, land records and inventories, climate change and land
use change.
22 State of Indian Agriculture
Fig 2.1: Land-use pattern in India, 1970-71
Fig 2.2: Land-use pattern in India, 2008-09
Natural Resource Management 23
Challenges
2.3 The scope to expand the area available for cultivation as the demand for
industrialization, urbanization, housing and infrastructure is forcing conversion of
agricultural land to non – agricultural uses is limited. With an increasing pressure of
population and a decreasing per capita availability of cultivable land, there is a need to
enhance cropping intensity without compromising land productivity. After
independence till the 1970s, Indian agriculture was characterized by intensive agriculture
practices in favorable ecologies through an integrated use of HYVs, irrigation, fertilizer,
pesticide use and technologies with mining of natural resources to meet the food security
needs. Since the 1980s, the adverse effects and limitations of the green revolution
technologies were realized and the emphasis shifted to appropriate/alternative and
sustainable land use systems and to improving the efficiency of resources and inputs.
The Way Forward
2.4 For achieving a sustainable land use in the agricultural sector the following initiatives
may be considered:
Plan and manage all resources including land in an integrated manner for
maximization of environmental, social and economic factors apart from ensuring
livelihood and equity;
Prepare comprehensive land inventories;
Prepare a perspective plan for treating degraded lands;
Develop infrastructural facilities and strengthen the technology support system;
Develop proper computerized, updated, on-line information system on land
records;
Develop and use advanced methodologies for land use planning;
Invest in capacity building, education and awareness on the importance of
conservation and optimum use of all natural resources;
Continuously monitor and assess the impact of climate change on land use and
take/suggest appropriate remedial measures.
Soil
2.5 The soil is a highly complex, multi-component system of water, air, rock strata and
living materials. Interactions among these determine properties of soil. They are
classified into types, orders, groups and sub-groups. It is reported that 90 percent of
soils are low to medium in nitrogen (N), 80 percent in phosphorus (P) and 50 percent in
potassium (K). Incidences of micronutrient deficiencies are also increasing. Soil health
from the agricultural point of view refers to the capacity of soil to ensure proper physical,
chemical and biological activities and processes for sustaining higher crop productivity.
24 State of Indian Agriculture
Good soil would ensure proper retention and release of water and nutrients, promote
and sustain root growth, maintain soil biotic habitat, respond to management and resist
degradation.
2.6 As land resources are stagnant, an increase in food production has to come from
increase in productivity. The quality of Indian soils is gradually deteriorating at the
farm and eco-system level. The major threats to soil quality come from a loss of organic
carbon, erosion, nutrient imbalance, compaction, salinization, water-logging, decline in
soil bio-diversity, urbanization, contamination with heavy metals and pesticides and
from an adverse impact of climate change.
2.7 The Department of Agriculture & Cooperation has introduced a new scheme namely
“National Project on Management of Soil Health & Fertility” (NPMSH&F) to promote a
soil test based balanced and judicious use of chemical fertilizers in conjunction with
organic manures like Farm Yard Manure (FYM), vermi compost and green manure to
maintain soil health and fertility. It also provides for the preparation of Geo-Referenced
Soil Fertility Maps including an interlinking of soil fertility status with Soil Test Crop
Response data to generate site- specific recommendations in 19 major States.
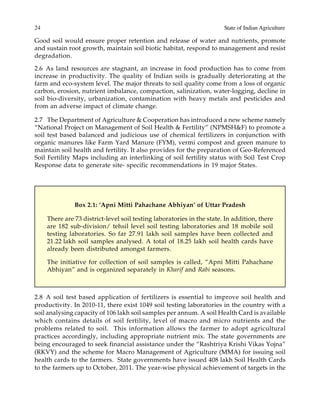
Box 2.1: ‘Apni Mitti Pahachane Abhiyan’ of Uttar Pradesh
There are 73 district-level soil testing laboratories in the state. In addition, there
are 182 sub-division/ tehsil level soil testing laboratories and 18 mobile soil
testing laboratories. So far 27.91 lakh soil samples have been collected and
21.22 lakh soil samples analysed. A total of 18.25 lakh soil health cards have
already been distributed amongst farmers.
The initiative for collection of soil samples is called, “Apni Mitti Pahachane
Abhiyan” and is organized separately in Kharif and Rabi seasons.
2.8 A soil test based application of fertilizers is essential to improve soil health and
productivity. In 2010-11, there exist 1049 soil testing laboratories in the country with a
soil analysing capacity of 106 lakh soil samples per annum. A soil Health Card is available
which contains details of soil fertility, level of macro and micro nutrients and the
problems related to soil. This information allows the farmer to adopt agricultural
practices accordingly, including appropriate nutrient mix. The state governments are
being encouraged to seek financial assistance under the “Rashtriya Krishi Vikas Yojna”
(RKVY) and the scheme for Macro Management of Agriculture (MMA) for issuing soil
health cards to the farmers. State governments have issued 408 lakh Soil Health Cards
to the farmers up to October, 2011. The year-wise physical achievement of targets in the
Natural Resource Management 25
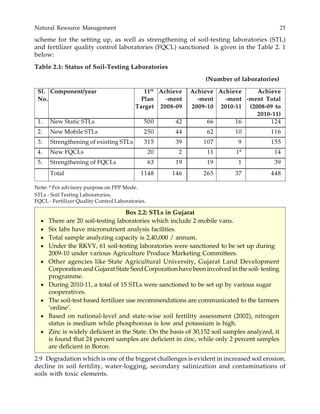
scheme for the setting up, as well as strengthening of soil-testing laboratories (STL)
and fertilizer quality control laboratories (FQCL) sanctioned is given in the Table 2. 1
below:
Table 2.1: Status of Soil-Testing Laboratories
(Number of laboratories)
Sl. Component/year 11th
Achieve Achieve Achieve Achieve
No. Plan -ment -ment -ment -ment Total
Target 2008-09 2009-10 2010-11 (2008-09 to
2010-11)
1. New Static STLs 500 42 66 16 124
2. New Mobile STLs 250 44 62 10 116
3. Strengthening of existing STLs 315 39 107 9 155
4. New FQCLs 20 2 11 1* 14
5. Strengthening of FQCLs 63 19 19 1 39
Total 1148 146 265 37 448
Note: * For advisory purpose on PPP Mode.
STLs - Soil Testing Laboratories.
FQCL - Fertilizer Quality Control Laboratories.
Box 2.2: STLs in Gujarat
• There are 20 soil-testing laboratories which include 2 mobile vans.
• Six labs have micronutrient analysis facilities.
• Total sample analyzing capacity is 2,40,000 / annum.
• Under the RKVY, 61 soil-testing laboratories were sanctioned to be set up during
2009-10 under various Agriculture Produce Marketing Committees.
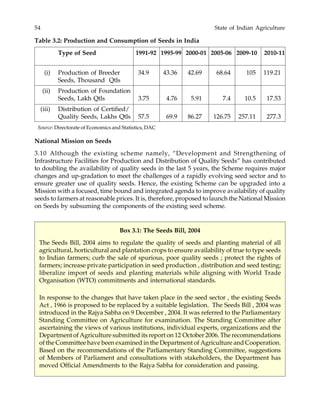
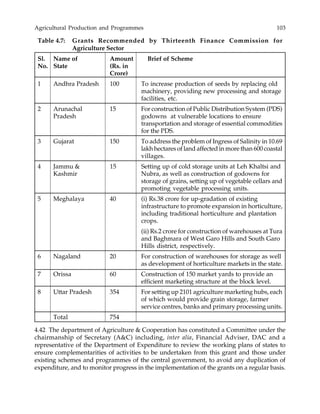
• Other agencies like State Agricultural University, Gujarat Land Development
Corporation and Gujarat State Seed Corporation have been involved in the soil- testing
programme.
• During 2010-11, a total of 15 STLs were sanctioned to be set up by various sugar
cooperatives.
• The soil-test based fertilizer use recommendations are communicated to the farmers
‘online’.
• Based on national-level and state-wise soil fertility assessment (2002), nitrogen
status is medium while phosphorous is low and potassium is high.
• Zinc is widely deficient in the State. On the basis of 30,152 soil samples analyzed, it
is found that 24 percent samples are deficient in zinc, while only 2 percent samples
are deficient in Boron.
2.9 Degradation which is one of the biggest challenges is evident in increased soil erosion,
decline in soil fertility, water-logging, secondary salinization and contaminations of
soils with toxic elements.
26 State of Indian Agriculture
Table 2.2: Degraded Lands in India
(Million ha)
S. Type of Degradation Arable land Open forest
No. (Mha) (<40percent
Canopy) ( Mha)
1. Water erosion (>10 t/ha/yr) 73.27 9.30
2. Wind erosion (Aeolian) 12.40 -
Sub Total 85.67 9.30
3. Chemical degradation 17.45 7.23
4. Physical degradation 1.16
Total 104.28 16.53
Grand total (Arable land and Open forest) 120.81
Source: National Bureau of Soil Survey and Land Use Planning 2008.
2.10 The organic carbon content of Indian soils is very low on account of removal of the
crop residues, low and imbalanced nutrient use and erosion. Most of the plant biomass
is removed from the field to be used as forage, fuel or building material and stubbles
are burnt to hasten land preparation for next crop. An estimated 29.4 million ha of Indian
soil is experiencing a decline in fertility which is likely to increase in future. Nutrient
imbalance and micronutrient deficiency is serious in our soils. The fertilizer use efficiency
is generally reported to be 50 percent for N; 30 percent for P; 50 percent for K and
20 percent for micronutrients even with best management practices. There is a decline
in soil bio-diversity, about 3.1 million ha of agricultural land is water logged (because
of improper drainage, imbalance in surface and ground water use, and seepage and
percolation from unlined channels) while about 4.1 million ha of agricultural land is
affected by salinity. Non-judicious use of pesticides, dumping of municipal solid and
industrial wastes containing large amounts of heavy metals and toxic substances affect
soil quality as also activities of the biological system in the soil. In the future, global
climate change will further lead to increase in temperature resulting in drier soils with
more irrigation demands, a lowering of the ground water table, salt accumulation in
upper soil layers, a rise in sea level, decrease in Soil Organic Carbon (SOC), etc. The
changes in rainfall volume and frequency, as well as wind velocity may alter the severity,
frequency, and extent of soil erosion.
2.11 The states in which more than half of the area is degraded due to soil erosion are
Chhattisgarh, Jharkhand, Madhya Pradesh, Uttar Pradesh, Uttarakhand and the North
Eastern Hill states. The area under very severe soil erosion (more than 40 tonnes per ha
per year) constituted about 11 percent. In quantitative terms, about 5.3 billion tonnes of
soil are eroded in India at an average rate of 16.3 tonnes per ha per annum. While
61 percent of eroded sediments get redistributed on the land, nearly 29 percent are lost
permanently to the sea. The remaining 10 percent are deposited in reservoirs reducing
Natural Resource Management 27
their holding capacity by 1 to 2 percent annually. About 8 million tonnes of plant nutrients
are also washed away along with eroded sediments.
2.12 The country also suffers from a heavy loss of rainfed agricultural produce grown
under the three major soil groups of alluvial, black and red soils due to erosion by
water. Thus, adoption of appropriate soil and water conservation measures following
the watershed approach is essential for protecting the lands from soil erosion in different
agro-ecological regions of the country. About 12 million ha area is waterlogged and
flood prone in India, wherein the productivity of arable crops is severely affected. In
Madhya Pradesh and Maharashtra, nearly 12 and 0.53 million ha of rainfed Vertisols,
respectively are left fallow due to temporary waterlogging during kharif and are cropped
only in the post rainy season. The waterlogged alluviums in eastern India have water
stagnating above the ground for over six months in a year. The adverse physical
conditions allow only one anaerobic paddy crop with a very low yield potential of less
than one tonne per ha. Integrated farming systems with better water productivity could
convert water abundance into greater opportunities of income generation, employment
enhancement and nutritional security in this region.
2.13 Salt affected soils are not fit for cultivation due to the prevalence of high sodicity
(pH > 9.5) and/or salinity. Application of gypsum as soil or water amendment along
with Farm Yard Manure (FYM) could alleviate the adverse effects of soil sodicity and
allow the growing of rice and wheat in these areas. Using sodicity tolerant rice and
wheat varieties, the rate of application of gypsum could be brought down to 25 percent
GR (Gypsum Requirement) without compromising the crop yield. For soil suffering
from salinity, leaching of salts with good quality water and disposal of drainage effluent
through a well laid out horizontal sub-surface drainage system and its integration with
bio-drainage could be beneficial. Acid soils are characterized by low P availability and
high P fixation capacity due to high exchangeable Aluminum (Al+++)
. Besides, these
soils are also deficient in molybdenum (Mo), nitrogen (N), calcium (Ca) & magnesium
(Mg). About 11 million ha of arable acidic soils with pH < 5.5 suffer from deficiencies as
well as toxicities of certain nutrients and have very low productivity. Liming at the rate
2 to 4 quintals per ha along with half of the recommended fertilizers raises the potential
to double the productivity especially for oilseeds and pulses in the acid soil regions of
the country. In the case of acid sulphate soils, application of limestone to neutralize all
the potential acidity will be very expensive. A more practical solution may be to
encourage the oxidation of pyrite followed by leaching of acids and then to counteract
the residual acidity through liming.
2.14 An inadequate and imbalanced nutrient use coupled with neglect of organic
manures has resulted in multi-nutrient deficiencies in Indian soils. These deficiencies
are becoming more critical for sulphur, zinc and boron. As the nutrient additions do not
keep pace with nutrient removal by the crops, the fertility status of Indian soils has
been declining fast under intensive agriculture and are now showing signs of fatigue,
especially in the Indo-Gangetic plain. The soils in India possesses having a net a negative
balance of about 8-10 million tonnes of NPK at the country level. The potassium (P) is
the most mined nutrient from soils with the rate of its removal being 7 metric tonne and
28 State of Indian Agriculture
in proportion to an addition of only one metric tonne. Sulphur deficiencies are also
showing up in all parts of the country being more rampant in the southern region. The
deficiencies could be assumed to be occurring in 40-45 percent of districts covering
about 60 million ha of net sown area. State – wise soil fertility status and extent of micro
nutrient deficiencies in Indian soils are given in Tables 2.3 and 2.4, respectively.
Table 2.3: State-wise Soil Fertility Status
Name of the State Category of Fertility Status
Nitrogen Phosphorus Potassium
East Zone
Assam Medium Medium Medium
Arunachal Pradesh High Low High
Manipur Low Low Medium
Meghalaya High Low Medium
Mzoram High Low Medium
Nagaland High Medium Low
Orissa Low Low Medium
Tripura Medium Medium Medium
West Bengal Medium Medium Medium
West Zone
Gujarat Medium Low High
Goa High Medium High
Madhya Pradesh Medium Medium High
Maharashtra Low Low High
North Zone
Haryana Low Low Medium
Himachal Pradesh High Medium Low
Jammu & Kashmir Medium Low Low
Punjab Medium Medium High
Uttar Pradesh Low Low Medium
South Zone
Andhra Pradesh Low Low High
Andaman & Nicobar Island Low Low Low
Karnataka Medium Medium High
Kerala Low Medium Medium
Pondicherry Low Low Medium
Tamil Nadu Low Medium High
All India Low Medium High
Source: Motsara, M.R.(2002), Available nitrogen, phosphorus, and potassium status of Indian Soil as depicted
by Soil Fertility Maps : Fertilizer News, Vol.47 (8), 2002.
Natural Resource Management 29
2.15 Zinc deficiency is recognized as a nutritional disorder in rice on sodic and calcareous
soils that have a high pH. The iron (Fe) deficiency has been noticed in rice on coarse-textured
soils. Similarly, the deficiency of manganese (Mn) is increasingly appearing in wheat when
it is grown after rice on coarse textured alkaline soil having low organic matter content, high
available P or silicion (Si) and high Mg:Ca ratio. Boron deficiency is becoming more
widespread in red and lateritic, acidic, coarse textured alluvial soil. The limiting nutrients
do not allow for the full expression of other nutrients, thereby, lowering the fertilizer
responses and crop productivity. Soil-test based balanced and integrated nutrient
management through conjunctive use of both inorganic and organic sources of plant nutrients
is the ideal solution to prevent such deterioration of soil health. In addition, split application,
placement of fertilizer, use of slow releasing N-fertilizers and nitrification inhibitors and
inclusion of leguminous crop in crop rotation are also advocated.
Table 2.4: Extent of Micronutrient Deficiency in Indian Soils
Name of No. of Percent Samples Deficient
State/Union samples Zinc Copper Ferus Manganese Boron Molybdenu
Territory (Zn) (Cu) (Fe) (Mn) (B) (Mo)
Andhra Pradesh 8,158 49 <1 3 1 - -
Assam 12,166 34 <1 2 20 - -
Bihar 19,214 54 3 6 2 38 -
Delhi 201 20 - - - - -
Gujarat 30,152 24 4 8 4 2 10
Haryana 21,648 60 2 20 4 0 28
Himachal Pradesh 155 42 0 27 5 - -
Jammu &Kashmir 93 12 - - - - -
Karnataka 27,860 73 5 35 17 32 -
Kerala 650 34 3 <1 0 - -
Madhya Pradesh 32,867 44 <1 7 1 22 18
Maharashtra 515 86 0 24 0 - -
Meghalaya 95 57 2 0 23 - -
Orissa 16,040 54 - 0 0 - -
Pondicherry 4,108 8 4 2 3 - -
Punjab 16,483 48 1 14 2 13 -
Rajasthan 183 21 - - - - -
Tamil Nadu 28,087 58 6 17 6 21 -
Uttar Pradesh 26,126 46 1 6 3 24 -
West Bengal 6,547 36 0 0 3 68 -
All India 2,51,547 48 3 12 5 33 13
Source: Project Report: Coordinated Micronutrient Research Project, Indian Institute of Soil Science (IISS),
Bhopal
GIS-based Soil Fertility Maps showing deficiency of nitrogen, phosphorous, potassium,
zinc and sulphur are given in Figs. 2.3, 2.4, 2.5, 2.6 & 2.7, respectively.
30 State of Indian Agriculture
Fig 2.3: GIS-based Soil Fertility Map of India showing Deficiency of Nitrogen
Natural Resource Management 31
Fig 2.4: GIS-based Soil Fertility Map of India showing Deficiency of Phosphorus
32 State of Indian Agriculture
Fig 2.5: GIS-based Soil Fertility Map of India showing Deficiency of Potassium
Natural Resource Management 33
Fig 2.6: GIS-based Soil Fertility Map of India showing Deficiency of Zinc
34 State of Indian Agriculture
Fig 2.7: GIS-based Soil Fertility Map of India showing Deficiency of Sulphur
Natural Resource Management 35
2.16 Soil organic carbon has a role in the carbon cycle, release of green house gases
(GHGs) in the atmosphere and in influencing the physico-chemical-biological
environment of the soils. The earlier generalization of reduction of productivity of the
rice-wheat system in the Indo-Gangetic Plain (IGP) was linked with declining soil
organic matter contents.
2.17 Arsenic contaminated soil receives its arsenic from geogenic sources. Oxygenated
decomposition of pyritic sediments containing high amounts of arsenic then release
sulphuric acid that solubilizes arsenic. The solution moves down to aquifers, polluting
the groundwater. As per World Health Organization (WHO) standards, an arsenic
concentration in ground water above 0.01 mg per litre is considered to be unsafe from
the health point of view. The pollutants enter the food chain and become a potential
health hazard to humans and animals. Selenium contaminated soil contain a selenium
content many times higher than the permissible limit of 5 mg selenium per kg of produce.
The intake of contaminated food causes chronic selenosis (selenium poisoning) in animals
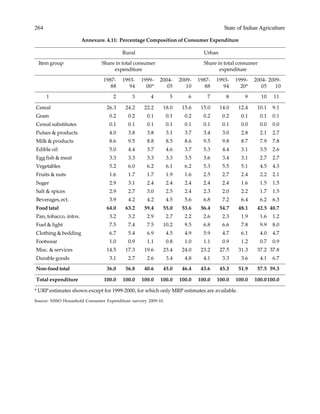
and human beings. The problem of selenium toxicity could be successfully tackled with
a one time application of gypsum of 0.8 tonne per ha to wheat in a wheat-rice sequence.
The other options could be to grow of selenium resistant crops and/or the adoption of
a maize-wheat cropping sequence instead of rice-wheat which requires lesser irrigation.
The Way Forward
2.18 Soil should be managed to optimize its multiple functions especially, related to
crop productivity and environmental protection on a sustainable basis. Conservation
agriculture, integrated nutrient management, carbon sequestration, erosion control, saline
and alkaline soils management, soil testing, legislation for soil protection, development
of remote sensing and Global Positioning System (GPS)-based Decision Support System
(DSS) and amelioration of polluted soil should be undertaken on a priority basis to
rejuvenate deteriorated soils.
Water
2.19 Freshwater resources are a critical input for agriculture as well as for many other
economic activities. It is estimated that about 3 million ha in the country are covered
under ponds, reservoirs, brackish water, lagoons, rivers and canals. Water shortage is
going to be a major problem in the coming years due to spatial and temporal variations,
high evaporation, continuous droughts and the competing demands of water among
different sectors coupled with climate change.
2.20 The National Water Development Agency has developed a plan for inter-basin
water transfer that comprises broadly: (i) the Himalayan component with 14 river links,
and (ii) the peninsular component with 16 links. About 141 Billion Cubic Metre (bcm)
can be transferred through the peninsular links and 33 bcm through the non-peninsular
36 State of Indian Agriculture
links. Much of the transfer in the Himalayan component is from the Ganga basin to
western India. The huge amounts of surplus flows in the Brahmaputra cannot, however,
be tapped, because of their lower elevation relative to the Ganga basin. The total
additional water resources available (174 bcm) by this is less than the combined water
that can be made available (about 300 bcm) through water conservation, groundwater
recharge and recycling.
2.21 It is estimated that by 2050, about 22 percent of the geographic area and 17 percent
of the population will be under absolute water scarcity. The per capita availability of
water which was about 1704 cubic metres in 2010 is projected to be 1235 cm in 2050.
Therefore priority to efforts is needed in water development as also management in
multiple areas as policy, governance, regulation as well as management with science
and technology backup. Of the total annual precipitation of 4000 bcm, the utilizable
water is only 1123 bcm (28 percent), after adjusting for evaporation and runoff. The
present water use is 634 bcm and the projected water by 2025 is 784-843 bcm. Owing to
increasing demand for industrial and drinking water and for the energy sector, there
will be a substantial fall in the availability for agriculture with serious implications for
meeting the food production targets. Further, water quality has been a serious concern
in the last two decades. Discharge of untreated municipal waste and industrial toxicants
is a major threat to the quality of surface water. Ground water quality is affected by
arsenic, iron, fluoride content, overdraft, fertilizers and pesticides use, and saline water
intrusion in the coastal regions.
2.22 A watershed development approach employing suitable soil and water
conservation measures has resulted in transforming agriculture production and
productivity in the semi-arid and rain fed areas of the country. Various Watershed
Development Programmes (WDPs) are being implemented by the Ministry of Agriculture
and Ministry of Rural Development for development of degraded lands. The Department
of Agriculture & Cooperation has been implementing programmes such as the National
Watershed Development Project for Rainfed Areas (NWDPRA), Soil Conservation in
the Catchments of River Valley Project & Flood Prone River (RVP & FPR) and Watershed
Development Project in Shifting Cultivation Areas (WDPSCA). Till the end of third year
of eleventh Plan, about 20.81 million ha area has been developed under these
programmes.
2.23 The Department of Land Resources has been implementing three area development
schemes viz., Drought Prone Areas Programme (DPAP), Desert Development Programme
(DDP) and Integrated Wastelands Development Programme (IWDP) on watershed basis
since 1995-96. Projects covering a total area of 32.31 million ha have been sanctioned
under these programmes. The DDP is being implemented in 235 blocks of 40 districts in
7 States. Since 1995-96, a total of 15746 projects covering 7.87 million ha have been
sanctioned, on a watershed basis under this programme. The DPAP is actively on the
Natural Resource Management 37
ground in 972 blocks of 195 districts in 16 states. Since 1995-96, a total number of 27,439
projects covering an area of 13.72 m ha have been sanctioned, on a watershed basis
under DPAP. The projects under IWDP are generally sanctioned in areas not covered
by the DDP and DPAP. The programme is being implemented in 470 districts in 28
States of the country. Under the programme, 1877 projects covering a total area of 10.72
million ha have been sanctioned on a watershed basis since 1995-96. To give enable
completion of these projects, no fresh projects under these programmes were sanctioned
from 2007-08.
Table 2.5: Programme-wise Number of Projects completed/closed under IWMP
Pre-IWMP No. of Projects Projects Project completed
Programmes sanctioned during completed/closed as Percentage of
1995-96 to 2005-06 2010-11 project sanctioned
DPAP 27,439 20,580 75.0
DDP 15,746 10,998 69.8
IWDP 1,877 917 48.9
Total 45,062 32,495 72.1
Source: Department of Land Resources
Fig. 2.8: Check Dams ; Watershed Harvesting Structure
38 State of Indian Agriculture
2.24 The Department has reviewed the ongoing pre-IWMP projects and has taken a
conscious decision to complete them by fixing timelines. The timeline for completion of
all pre-Hariyali projects sanctioned before 2003-04 was 31 March 2011. Accordingly, all
the pre-Hariyali projects have been completed or closed except for 326 projects being
implemented in snow-bound areas. All Hariyali projects sanctioned during 2003-04 to
2006-07 are to be completed by 31 December 2012, with the exception of projects located
in snow-bound areas where the actual working season is limited to three to four months
in a year. For these areas, a grace period of three years beyond the cut- off date would
be considered on furnishing a certificate to this effect by the state government.
Box 2.3: Parthasarathy Committee
The Ministry of Rural Development set up a Technical Committee on DPAP, DDP and
IWDP chaired by Shri S. Parthasarathy in 2005 to address all major issues in the
watershed programmes and to recommend viable strategies and mechanisms for
effective implementation of these programmes. The Parthasarathy Committee Report,
2006 analysed a wide range of statistics to show that dry land farming has suffered neglect,
even as irrigated agriculture appears to be hitting a plateau. The report concluded that
the productivity of dry land agriculture needs to be developed if food security demands
of the year 2020 are to be met. The report recommended that a greater focus of watershed
development programmes to increase productivity of lands in rain-fed areas might hold
the key to meet the challenge of food security in the years to come.
The other main recommendations of the Committee include - provision of dedicated
institutions to implement the watershed programmes; raising of cost norms; provision of
flexibility in project duration; implementation of the project in three phases i.e.,
(i) Preparatory Phase, (ii) Resource Augmentation and (iii) Institution Building Phase
and Sustainable Livelihoods and Productivity Enhancement Phase; separate budget
provision for monitoring and capacity building; provision for ensuring transparency and
accountability; provision for productivity enhancement and livelihoods; etc.
2.25 The provisions in the Common Guidelines and the observations of the Parthasarthy
Committee (Box 2.3) have necessitated modifications in the watershed schemes of the
Department of Land Resources. Accordingly, DPAP, DDP and IWDP of the Department
of Land Resources have been integrated and consolidated into a single modified
programme known as the Integrated Watershed Management Programme (IWMP) that
has come into being since 26 February 2009. This consolidation is for optimum use of
resources, sustainable outcomes and integrated planning.
Natural Resource Management 39
Box 2.4. IWMP Objectives
• to harvest rain water and recharge ground water table
• to prevent soil run-off
• to improve production systems (crops, livestock) through improved technologies
• to increase productivity of rainfed/ degraded land through the process of integrated
watershed management
• to promote livelihoods in watershed project areas
2.26 The salient features of IWMP include provisions of development of micro-
watersheds on a cluster basis; reduced number of installments; delegation of power to
the states; for sanction of projects; dedicated institutions; capacity building of
stakeholders; monitoring & evaluation; specific budget provision for detailed project
report preparation; livelihood for asset less people; and production system & micro-
enterprises. Projects under the IWMP are being implemented since 2009-10 in keeping
with the common guidelines for Watershed Development Projects, 2008 for treatment of
rainfed/ degraded areas.
2.27 A target of 22.65 million ha of new areas has been fixed under the watershed
development programmes by the Department of Land Resources during the 11th
Five
Year Plan period. During the first two years of the Plan no projects under IWMP were
sanctioned. Projects covering a total area of 15.13 million ha were sanctioned to 23 states
in the country during 2009-10 and 2010-11, as given below. A target for sanction of new
projects covering a total area of 25 million ha (5 million ha being added each year) has
been fixed under IWMP for the 12th
Plan.
Table 2.6: Physical Progress under IWMP during 11th
Plan period
Year Area to be taken up for development (m. ha.)
Target Achievement
2009-10 5.41 6.31
2010-11 8.5 8.82
2011-12 8.74 -
Total 22.65 15.13
2.28 To achieve these objectives, provisions for carrying out diverse activities, ranging
from institution building, human resource development, watershed development
activities, livelihood activities, coordination with other schemes and management of
already created assets after the withdrawal of the project from the area are embedded in
the guidelines governing IWMP.
40 State of Indian Agriculture
Box 2.5: Impact of Watershed Development Project- ICRISAT
A study on “Comprehensive Assessment of Watersheds programmes in India” during
2008 had been assigned to International Crops Research Institute for the Semi-Arid Tropics
(ICRISAT), Hyderabad to critically assess the impact of various watershed development
programmes in India and to identify the positive factors leading to a reduction of wastelands.
This study evaluated the impact of watershed programmes with the help of 636 micro-level
studies to get more authentic and realistic results. The study inter alia reported namely that:
• Soil loss of 1.1.tonne/ha/year was prevented due to interventions of the watershed
programme
• Additional water storage capacity of about 38 ha–metre was created in a 500 ha water-
shed as a result of the watershed programme.
• There was an increase of 52 percent in area under irrigation, while the cropping intensity
increased by 35.5 percent
• Benefits of the watershed programmes were more apparent in the low-income regions as
compared to high-income regions and also the benefits were more pronounced in the
rainfall regions ranging between 700 mm and 1000 mm with the available technologies
• Most of the watershed programmes were not sensitive to the needs of small & marginal
farmers, women & landless labourers and these were left out of the watershed-related
decision-making process
• There was lack of an appropriate institutional arrangement to attain the potential benefits
of the watershed programmes
• People’s participation is the key determinant in the success of the watershed programmes.
The benefit cost ratio was greater in watersheds where people’s participation was higher
• The macro-watershed (area more than 1000 ha) performed better than a micro-watershed
area below 500 ha
The results of the meta-analysis further revealed that the watershed programme is providing
multiple benefits in terms of augmenting rural employment, increasing crop yields, reducing
run-off (45 percent), augmenting groundwater, building social capital and reducing poverty.
2.29 Apart from the regular periodical monitoring mechanisms, the Department has
awarded a pilot project for technology support for developing GIS based monitoring
system to monitor the IWMP projects being implemented in Bhilwara District of
Rajasthan to Madhya Pradesh Forest Department (MPFD) during July 2010. The system
would enable the Department to monitor the watershed development projects on near
real time basis. The MPFD has developed useful GIS based monitoring system for the
pilot project in Bhilwara, Rajasthan. Looking at the success of GIS based monitoring
Natural Resource Management 41
system, the matter has been taken up with the MPFD to implement the system in Jaipur
District of Rajasthan and three Districts of Nagaland viz. Kohima, Dimapur and Peren
also.
Box 2.6: Watershed Projects Impact-TERI
The Energy & Resources Institute (TERI) prepared a compendium in 2004 which
summarizes the major impacts due to the intervention caused by watershed projects in
230 districts of 16 states by independent institutions and bodies. Some of the estimated
yields and economic implications as derived by TERI are:
• Overall improvement in land use - Increase in the net sown area, gross cropped area
and area sown more than once, Increase in the number of irrigation options in all the
areas of watershed projects
• Increase in fuel wood and fodder availability
• An increase in agriculture-related employment opportunities among beneficiaries
and in other sectors for non-beneficiaries — Emergence of fishery potential following
the development of tanks and other water bodies
• Marked preference for improved breeds after the project.
Challenges
2.30 The concerns for future trends and scenarios should centre on enhanced water
efficiency, sustainability of irrigated eco-systems, livelihood and intergenerational
equity. Several parts of India are already facing water shortages and the problem will
become acute by 2050 with nearly all the estimated available water put to use as a result
of increasing population and food demand.
2.31 Currently, reuse and recycling of wastewater is not practised on a large scale in
India, and there is a considerable scope to use this alternative. 'Reuse' applies to
wastewaters that are discharged from municipalities, industries and irrigation and then
withdrawn by users other than the dischargers.
2.32 Studies on the likely impacts of increased climate variability and climate change
on the water resources have been limited. Under a changed climatic scenario, a number
of chain events like the melting of glaciers, sea-level rise, submergence of islands and
coastal areas, and deviant rainfall patterns, are likely to occur. Their likely impacts would
include a greater annual variability in the precipitation levels, leading to some parts of
India getting wetter while others becoming drought-prone. Sea-level rise will increase
saline-intrusion of groundwater, rendering it unsuitable for use. All of these will have a
direct impact on surface and groundwater resources. Thus, the major water-related future
42 State of Indian Agriculture
challenges to Indian agriculture will include the growing menace of ground water
pollution, soil salinization and gradual decline in productivity especially in those areas,
which witnessed the green revolution.
The Way Forward
2.33 The availability and use of knowledge-based inputs need to be applied more
extensively to overcome these problems. Specifically for example
More rigorous understanding and integration of biophysical and socio-economic
processes involved in water-resources generation and agricultural production is
required. These include, climatic, hydrologic, hydraulic and soil-water processes,
ground recharge, crop growth, and economic processes at farm, regional and
global levels. Extensive field, laboratory and theoretical simulation research of
high precision is required to make forecasts or predictions that can be incorporated
into the resource management decision making processes.
Extensive data, information and knowledge systems at various spatial and
temporal scales need to be generated and shared among wide-and-diverse
networks.
Improved understanding of system behavior needs to be accompanied by efficient
methods of water control and application in the conveyance and field application
systems.
Coping strategies would be needed that consider social, economic, and
institutional factors to reduce vulnerability and to enhance adaptation to climate-
related developments and events in the water sector. Groundwater may play an
important role in ameliorating the worst effects of climate change on water
resources. However, it must be recognized that if groundwater quality is affected
(by sea water intrusion or for other reasons), recovering groundwater resources
would require vast amounts of funds and time.
Development of recharge measures and prudent use of efficient methods like
micro irrigation are important.
Weather and Climate
2.34 Weather and climate variability, covering the quantity and temporal and special
distribution of rainfall during June to September, are very important determinants of
agricultural performance during the kharif season. Indian agriculture benefitted from
favorable weather and climate conditions consecutively for about ten years during 1990
Natural Resource Management 43
to 2000. But in the last 10 years, weather and climate variability have increased. In 2009,
the nation had witnessed its driest monsoon season in over three decades. To reduce
the vulnerability of agriculture to increasing weather and climate variability, the
government has put in place since the 11th
Five Year Plan an Agro-Meteorological
Advisory Service (AAS) at the district level for weather proofing (enhancing adaptive
capacity and increasing resilience) of farm production. The main emphasis of the AAS
system is to collect and organize climate and weather, soil and crop, pest and disease
information and to amalgamate this with the weather forecast to assist farmers in taking
on farm strategic and tactical management decisions. Under the AAS, the weather
forecasts are made up to five days with the outlook for rainfall given for the remaining
two days of the week. The products comprise of quantitative forecasts for seven weather
parameters, namely, rainfall, maximum temperature, minimum temperature, wind
speed, wind direction, relative humidity and cloudiness. In addition, a weekly
cumulative rainfall forecast is also provided. Indian Meteorological Department (IMD)
generates these products using the Multi Model Ensemble Technique based on forecast
products available from a number of models in India and other countries. After adding
value to these products using a synoptic interpretation of model output, they are
communicated from the Regional Meteorological Centres and Meteorological Centres
of IMD in different States (SAMCs) to 130 Agro-Met Field Units (AMFUs) located at
State Agricultural University (SAUs) and Indian Council of Agricultural Research (ICAR)
Institutions on every Tuesday and Friday. The Agro-Met Advisory Bulletins are issued
at the district, state and national levels. The district-level bulletins issued by Agro-Met
Field Units (AMFUs) include location and crop specific advisories in the local language
on field crops, horticulture crops and livestock. Agricultural scientists at AMFUs have
started using crop simulation models as a decision support tool to make weather
forecasts. A broad spectrum of advisories include for example: weather sensitive farm
operations such as sowing and transplanting of crops; quantity and timing of fertilizer
application based on wind condition and intensity of rain; pest and disease control;
intercultural operations; quantity and timing of irrigation; timely harvest and post harvest
operations of crops; etc. These advisories suggest measures and practices to minimize
the losses and also, to optimize input in the form of irrigation, fertilizer or pesticides.
An inter-disciplinary group of agricultural and extension specialists at the AMFUs
formulate these advisories. (Fig. 2.9)
44 State of Indian Agriculture
2.35 At present, district-level bulletins are issued for 550 districts in the country. The
state-level bulletin is jointly prepared by SMCs of all the states with inputs from AMFUs
for use by the state government functionaries, fertilizer industry, pesticide industry,
irrigation department, Seed Corporation, transport organizations which provide critical
inputs to agriculture. This bulletin is a significant input to the state-level Crop Weather
Watch Group (CWWG) meeting. The National Agro-Met Advisory Bulletins are prepared
by National Agro-Met Advisory Service Centre and Division of Agricultural
Meteorology, IMD, Pune using inputs from various states. The Ministry of Agriculture,
GOI, uses these bulletins to take important decisions in CWWG meetings at the national
level. These services are provided in collaboration with a number of other organizations.
A collaborative programme sponsored by MOA on the development of Extended Range
Forecast System (ERFS) is being pursued jointly by IMD, Nation Centre for Medium
Range Forecast of Weather (NCMRFW), DAC, ICAR, SAC, IITD and IRI to provide
spatially and temporally differentiated weather information with a lead time of one
month for providing input support services to farmers.
2.36 Information on agro-advisory is disseminated through multi-modes of delivery
including mass and electronic media like AIR, television, print media, internet as well
Fig 2.9: Collaborating Organizations and their Linkages under Integrated Agro-met
Advisory Service
Natural Resource Management 45
as group and individual relationships through e-mail, telephone, SMS and IVR
(Interactive Voice Response Technology), etc. A number of private firms like Reuter
Market Light, Handygo, IFFCO Sanchar Limited, Nokia are disseminating the agro-met
advisories generated under the Agro-Meteorological Advisory Service (AAS) through
SMS and IVR in 15 states and in Maharashtra in collaboration with the State Department
of Agriculture, Government of Maharashtra.
2.37 The Agro meteorological Advisory Service (AAS) has demonstrated the critical role
of weather forecast in increasing the overall preparedness of farmers, leading to
substantially better outcomes. For more effective approaches to deliver climate and
weather information to farmers through a participatory, cross-disciplinary approach,
farmer’s awareness programmes also known as roving seminars are organized that bring
together research and development institutions, relevant disciplines, and farmers as
equal partners. They are jointly organized by IMD, ICAR, SAUs, local NGOs, and other
stake holders. In order to improve the linkage with the AAS system and develop a local
(village) level rain measuring network, 5 rain guages made of plastic were distributed
to the selected group of progressive farmers during the meeting. So far such seminars
have been organized at AMFUs. IMD in collaboration with partners has published an
Agromet Brochure providing all the details about AAS and its implementation by all
concerned.
2.38 In the year 2011-12, there was normal South-West monsoon rainfall (June-September)
in India. At the meteorological sub-division level, 33 out of 36 met sub-divisions received
excess or normal rainfall and three met sub-divisions namely, Assam & Meghalaya (-24
percent), Arunachal Pradesh (-32 percent) and NMMT (-27 percent) received deficit
rainfall during this period. The country as a whole received 899.9 mm of rainfall against
a normal rainfall of 887.5 mm which represents a deviation of 1 percent more than the
Long Period Average (LPA). Out of 603 districts for which rainfall data were available,
144 districts (24 percent) received excess rainfall, 315 districts (52 percent) received normal
rainfall, 137 districts (23 percent) deficit rainfall and only 7 districts (1 percent) received
scanty rainfall.
2.39 During the post-monsoon season (1 October to 7 December, 2011), the country
received 48 percent less rainfall than the LPA. Out of 36 meteorological sub-divisions,
one received excess rainfall, 05 received normal rainfall, 06 received deficient rainfall,
23 received scanty rainfall and one met sub-division received no rainfall. The Northeast
monsoon seasonal rainfall over the southern peninsula was 14 percent lesser than the
LPA. Rainfall in major met-sub-divisions covered by the North-East monsoon was
Coastal Andhra Pradesh (-46 percent), Telangana (-85 percent), Rayalseema (-22 percent),
Tamil Nadu & Pondicherry (25 percent), Coastal Karnataka (1 percent), North Interior
Karnataka (-43 percent), South Interior Karnataka (2 percent), and Kerala
(-9 percent).
46 State of Indian Agriculture
National Mission for Sustainable Agriculture
2.40 The National Mission for Sustainable Agriculture (NMSA) is one of the eight
Missions under the National Action Plan on Climate Change (NAPCC). It seeks to address
issues on ‘Sustainable Agriculture’ in the context of risks associated with climate change
by devising appropriate adaptation and mitigation strategies for ensuring food security,
enhancing livelihood opportunities and contributing to economic stability at the national
level.
2.41 NMSA acknowledges that risks to the Indian agriculture sector due to climatic
variabilities and extreme events would be felt at the levels of crop or livestock, farm or
cropping system and food system. Further, the adverse impact on agriculture production
is likely to be severe in the absence of appropriate adaptation and mitigation measures
with far reaching consequences in terms of shortage of food articles and rising prices
thereby endangering the food and livelihood security of our country.
2.42 This Mission, therefore, seeks to transform Indian agriculture into a climate resilient
production system through suitable adaptation and mitigation measures in the domains
of both crops and animal husbandry. These measures would be mainstreamed in research
and development activities, absorption of improved technology and best practices,
creation of physical and financial infrastructure and institutional framework, facilitating
access to information and promoting capacity building. While promotion of dryland
agriculture would receive prime importance by way of developing suitable drought
and pest resistant crop varieties and ensuing adequacy of institutional support, the
Mission for sustainable agriculture would also expand its coverage to rainfed areas for
integrating farming systems with livestock and fisheries, so that agricultural production
continues to grow in a sustainable manner.
2.43 The Department of Agriculture & Cooperation has already initiated the process for
incorporating and dovetailing NMSA interventions along with its physical deliverables
as well as financial outlays into the “intended XII Plan Schemes” of the Ministry. In the
meantime a Climate Change Cell has been set up in the Department to supervise and
monitor strategies in the context of climate change.
Challenges
2.44 Increase in the atmospheric temperature, due to a rise in greenhouse gas levels
such as carbon dioxide, methane and nitrous oxide, is the prime driver of climate change.
Climate change is likely to exacerbate the current stresses and increase the vulnerability
of food production and livelihoods of the farming community. Hence, the world
community, by and large, has agreed to reduce the levels of greenhouse gases in the
atmosphere in a time bound manner. Early signs of increasing climatic variability are
gradually becoming more visible in the form of an increasing melting of Himalayan
glaciers, flash floods, and intense rainfall over short periods. In the Indian context, climate
Natural Resource Management 47
change is likely to exacerbate the current stresses and increase the vulnerability of food
production and livelihoods of the farming community. The warming will be more
pronounced over land areas, with the maximum increase occurring over northern India.
Increase in sea and river water temperatures is likely to affect fish breeding, migration,
and harvests.
The Way Forward
2.45 These issues should be looked at in totality in totality to develop effective strategies
to increase our adaptive capacity. The capacity to withstand climatic extremes such as
drought by establishing buffer food and fodder stocks, strengthening the irrigation
infrastructure, and developing agricultural insurance schemes are some of the adaptive
strategies that need consideration. A key requirement is to substantially increase the
capital investment in agriculture, irrigation infrastructure, development of climate
resilient crop varieties and livestock breeds, forewarning systems, capacity building of
scientists and farmers and transfer of adaptive technologies.
2.46 The weather forecast has to be prepared at a level smaller than the district (block
level with village level outreach). The temporal range of weather forecast needs to be
extended along with aggressive extension, outreach, and agro-met advisory
dissemination system. In this context, there is a proposal to establish the Gramin Krishi
Mausam Sewa in the country during the 12th
FYP by setting up District Agromet Units in
the KVKs in the country. Dissemination of right information at the right time to each
and every farmer through Common Service Centres, NABARD, ITC e-Choupal, etc. is
also to be strengthened. All FM channels of AIR and news casting centres of Doordarshan
under Prasar Bharati would also be included in this effort.
Disaster and Calamity Management
2.47 Water, land and agro-biomass are the main natural resources for agriculture.
Precipitation influenced by climate is the ultimate source of water that decides the
aggregate agricultural production and biomass. The climate of the Indian sub-continent
is tropical monsoon and it is distinguished by the departure from normal rainfall both
in quantity and distribution. India’s climate is classified as being as varied its landscape
with its alpine conditions, arid deserts and tropical regions.
2.48 There are two types of monsoon systems operating in India namely, (a) South-
West or summer monsoon, (b) North-East or the winter monsoon. The South-West
monsoon accounts for around 70 percent of the annual rainfall in the country, but there
is a large variability in the monsoon rainfall on both space and time scales. The
precipitation variability in the four broader regions of the country namely, north, east &
north eastern, central and south peninsular results in drought or flood in some parts of
the country almost every year. While Orissa experiences more flood incidents, Gujarat
48 State of Indian Agriculture
and Rajasthan experience more drought like conditions. A good monsoon heralds a
bountiful harvest, food and financial security. But when the monsoon is in excess or
deficit, the human suffering and economic loss can be widespread as happened during
the drought of 2009. Varied climate is a source of both misery and prosperity for much
of rural India. India is already experiencing the effects of climate variability.
2.49 The Department of Agriculture and Cooperation is entrusted with the responsibility
of coordinating relief measures necessitated by drought, hailstorm and pest attacks.
The Department monitors the progress of the South-West Monsoon in the country in
close coordination with the India Meteorological Department and Central Water
Commission. It keeps a close watch on the signs of any deficit rainfall and hydrological
conditions. Though the primary responsibility for taking necessary measures in the wake
of drought is the domain of the state governments concerned, this department constantly
remains in touch with the States to alert and assist them in tiding over the situation.
2.50 The government of India has recognized the significance of climate variability
leading to frequent natural disaster and calamity events on the growth and development
of the nation and accordingly launched a range of programmes, policies and institutions
to moderate the impacts of climate-related risks. The long-term centrally sponsored
programmes have contributed much to enhance the development potential of agriculture
and have helped build resilience to climate shocks.
Fig 2.10: Rural Vulnerability to Disasters
Natural Resource Management 49
2.51 The government of India’s disaster management programme has been ranked among
the most comprehensive programmes in the world and has achieved considerable success
in countering the effects of severe and extreme events like the Tsunami of 2004, Cyclone
of 1999 and the droughts of 2002 and 2009. In the event of floods and droughts, the
elaborate relief machinery set up in various departments of the central and state
governments swing into operation with rapidly arranged protective policies and
programmes like employment schemes, food distribution, special schemes for vulnerable
sections of the society and emergency health care.
2.52 However, this extensive relief system comes at a substantial cost to the public
exchequer. The state governments affected by natural disasters spend a significantly
higher amount on relief and damages. With the forecast of increasing frequency of
extreme events on account of climate change, the ongoing relief measures and their
financing may not be adequate and sustainable, particularly if droughts and floods
concomitantly become more severe. Besides strengthening the existing relief efforts to
mitigate the impact of disasters, there is an imperative need for bolstering the fiscal
growth and development to strengthen the climate resilience of the rural economy by
addressing the root causes of vulnerability.
2.53 During 2009, the country faced a rainfall deficit in South-West monsoon leading to
drought or drought like conditions in 338 districts in 14 States. It affected agricultural
production in approximately 300 lakh ha across the country with widespread shortage
of drinking water, fodder, etc. Government also took many steps to counter the situation
by releasing additional funds under the flagship scheme – RKVY. Other steps were for
example special measures to ensure availability of seeds, implementing a diesel subsidy
scheme, providing additional credit and insurance cover, distribution of fertilizers,
ensuring power supply, supply of additional fodder to the animals, arranging alternative
employment opportunities and special package to Haryana & Punjab. All these steps
helped the government to minimize the adverse effects of drought.
Challenges
2.54 Agricultural production in India is dominated by small and marginal farmers and
rainfed conditions, and, therefore, is largely dependent on natural events mainly seasonal
and annual rainfall. Besides, pest attack also causes significant damage to agriculture
production. The frequency and intensity of extreme weather events like drought, flood,
heat or cold wave, cyclone, delayed or early onset of monsoon, long dry spells, early
withdrawal of monsoon, floods in drought-prone areas and drought in flood-prone areas
and increased pest attacks have increased during the last two decades due to the global
climate change effect caused by the warming of the earth. About 8 percent of the total
area in the country is prone to cyclones and 68 percent of the area is susceptible to
drought. Most of the drought prone areas lie in the arid (19.6 percent), semi-arid (37
percent) and sub-humid (21 percent) areas of the country that occupy 77.6 percent of its
total land area of 329 million has. It is estimated that the flood-affected area has more
50 State of Indian Agriculture
than doubled in size from about 5 percent (19 million has) to about 12 percent (40 million
has) in the past five decades. This has led to an increase in spending on varieties of
flood protection programmes.
The Way Forward
2.55 Each and every natural disaster affecting Indian agriculture requires special and
newer approaches. For instance:
• Advancing rabi sowing to offset kharif losses, additional power for supplementary
irrigation depending upon the requirement of states or even a diesel subsidy
scheme.
• Strengthening climate risk information and tools to match needs should be
accorded top priority to minimize the crop losses on account of disasters. This
would require building up the capacity of climate assessment agencies.
• An alternative mechanism is needed to deliver support to farmers more
effectively, with the resulting savings being used to increase public investment
in ways that reduce the exposure to climate risks.
• Convergence and synergy between the ongoing developmental programmes with
the various ministries / departments in government of India.
• Fine tuning of the Debt Relief policy of the government with alternatives like the
weather-based insurance schemes.
• Better water management approaches like water budgeting, water conservation,
artificial recharging of water, development of community ponds, etc.
• Positioning of inputs and review of its availability.
• To achieve targets in agricultural production, priority investments would be
required in building up climate resilience of vulnerable rural communities with
a portfolio of adaptation options that can address climate risks.
CHAPTER 3
Farm Inputs and Management
3.1 The phenomenal growth in agricultural production since independence has been
triggered by higher input use, particularly purchased inputs as well as technology induced
productivity enhancement. The key inputs which changed the complexion of agriculture
include HYV (High Yielding Variety) seeds, chemical fertilizers, irrigation, pesticides, farm
machinery and equipments, credit and labor.
Seeds/Planting/ Breeding Material
3.2 Seed is a critical and basic input for enhancing agricultural production and productivity
in different agro-climatic regions. Efficacy of other agricultural inputs such as fertilizers,
pesticides and irrigation is largely determined by the quality of seed. Seed quality is
estimated to account for 20-25percent of productivity. It is, therefore, important that quality
seeds are made available to the farmers.
3.3 The Indian seed programme largely adheres to a limited generation system for seed
multiplication in a phased manner. The system recognizes three generations, namely breeder,
foundation and certified seeds and provides adequate safeguards for quality assurance in
the seed multiplication chain. The Indian seed programme includes the participation of
Central and State Governments, the Indian Council of Agricultural Research (ICAR), State
Agricultural Universities (SAUs), public sector, co-operative sector and private sector
institutions. The seed sector in India consists of two national- level corporations i.e. National
Seeds Corporation (NSC) and State Farms Corporation of India (SFCI). At the State level,
there are State Seed Corporations (SSCs). Besides, there are private seed companies. The
Seeds Act, 1966; Seeds Rule, 1968; Seed Control, 1983; National Seeds Policy, 2002; and New
Policy on Seed Development, 1988 provide the framework for seed development . The Central
Seed Committee (CSC), Central Seed Certification Board are apex agencies set up under the
Seed Act. Under the Act, State Seed Certification Agencies (SSCs),State Seed Testing
Laboratories (STLs),Central Seed Testing Laboratories (CSTLs), Seed Law Enforcement
Authorities (at the state level) and National Seed Research and Training Centre (NSRTC)
have been set up to deal with all matters relating to quality regulation of seeds. In recent
years, the private sector has started to play a significant role in the production and
distribution of seeds. The organized sector (including both private and public sector
companies) account for about 15 to 20 percent of the total seed distributed in the country.
The unorganized sector comprising mainly of farm- saved seeds accounts for the remaining
portion. New opportunities have opened up for export of seeds of several varieties of crops,
particularly those varieties in which India has a competitive edge.
Protection of Plant Varieties and Farmers’ Rights Authority (PPV&FR)
3.4 Varieties of crops can have proprietary or Intellectual Property Rights (IPRs) on them
through either patent or plant variety protection or a combination of both. Legislation for
Protection of Plant Varieties and Farmers’ Rights was enacted in 2001. The legislation provides
52 State of Indian Agriculture
for the establishment of a sui generis and an effective system for both the protection of plant
varieties, the rights of farmers and plant breeders on the one hand and to encourage the
development of new varieties of plants on the other. The PPV&FR Authority registers plant
varieties to protect plant breeder’s rights, thereby stimulating R&D investment in
development of new plant varieties. It also protects the rights of the farmers in respect of
their contribution made at any time in conserving, improving and making available plant
genetic resources. A total number of 54 crops have, so far, been notified for registration
purposes of the Authority.
New Policy on Seed Development (NPSD)
3.5 New Policy on Seed Development (NPSD), 1988 was formulated with a view to provide
the best planting material available abroad to Indian farmers. The policy has, over the years
facilitated import of seeds under various categories such as coarse cereals, pulses, seeds of
vegetables, flowers, etc. to improve agricultural production and productivity. The policy
permits an initial import of small quantity of cereals, oilseeds, pulses, etc. for in-house trial
by importer and multi location testing under All India Coordinated Trials of ICAR. Based
on satisfactory result of multi location trials, importers are permitted for bulk imports.
National Seeds Policy, 2002
3.6 The National Seeds Policy, 2002 was formulated keeping in view the rapid changes that
had been taking place in the national economic as well as agricultural sector and also the
changes in the international markets. The policy aims at enhancing food production targets
achievable by enhancing significantly, the Seed Replacement Rates (SRR). Hence, while a
boost is to be given to the private seed industry, the public sector also needed to be
strengthened. The policy aims at creating an enabling climate for growth of a competitive
and vibrant seed industry, encouraging import of useful germplasm and boosting exports.
The thrust areas are varietal development and plant variety protection, seed production,
quality assurance, creation of infrastructure for seeds, transgenics, import of planting material,
export of seeds and promotion of domestic seed industry. The policy also aims at removing
unnecessary regulations while ensuring that gullible farmers are not exploited by
unscrupulous elements.
Amendment to NPSD
3.7 In order to harmonize NPSD, 1988 with the National Seed Policy, 2002, the former, has
been revised in 2011 to streamline the procedures for import of seeds and planting material.
The amended policy allows import of wheat and paddy seeds under prescribed conditions.
A need was felt to achieve a quantum increase in the production and productivity of wheat
and paddy and thereby move towards food security of the country. As per the revised
policy, now a small quantity of wheat or paddy seeds can be imported into the country for
trials under ICAR or on such farms which are accredited by the ICAR. After trial and
evaluation for one crop season and satisfactory results therein, the importer can apply for
bulk import of such seeds. The policy has also been revised with regard to coarse cereals,
Farm Inputs and Management 53
pulses and oilseeds. Under the changed scenario, trial and evaluation can also be done on
farms operated by the importer provided they follow the procedure and protocol developed
by ICAR, and is under ICAR monitoring and supervision. The above mentioned revisions
in NPSD, 1988 will usher in an enabling environment for speedy trial and evaluation of
seeds, thereby facilitating timely imports
OECD Seed Scheme
3.8 The objective of the Organization for Economic Cooperation and Development (OECD)
Seeds Scheme is to encourage use of seeds of consistently high quality in participating
countries. The scheme authorizes the use of labels and certificates for the seed produced
and processed for international trade according to OECD guidelines. India’s participation
in the OECD Seed Scheme was accepted by the OECD in 2008 in respect of five seed schemes
viz. (i) Grasses and Legumes ;(ii) Cereals;(iii) Crucifers and other oil and fiber species,
(iv) Maize and Sorghum and (v) Vegetables. Ten Designated Authorities have been selected
representing the State Seed Certification Agencies of Maharashtra, Tamil Nadu, Uttarakhand,
Uttar Pradesh, Haryana, Bihar, Assam, Andhra Pradesh, Karnataka and Rajasthan. The paddy
basic seed programme has already been registered under the OECD Seed Scheme in Bihar.
3.9 Since 2005-2006, the Department of Agriculture and Cooperation is implementing a
Central Sector Scheme known as ‘Development and Strengthening of Infrastructure Facilities
for Production and Distribution of Quality Seeds’ (DPQS) to address the gaps in infrastructure
and to increase availability of quality seeds for different crops through various interventions.
The objective of the scheme is to ensure production and multiplication of high yielding
certified and quality seeds of all crops in sufficient quantities and to make the seeds available
to farmers, including those living in remote areas, not easily accessible by rail or road on
time and at affordable prices. The requirement and availability of certified seeds during the
last seven years is given in the following Table 3.1 below:
Table 3.1: Requirement & Availability of Seeds in India
(Quantity in lakh quintal)
Year Requirement Availability Surplus (+)/Deficient (-)
2004-2005 110.83 132.27 +21.44
2005-2006 107.08 140.51 +33.43
2006-2007 128.76 148.18 +19.42
2007-2008 180.74 194.31 +13.57
2008-2009 207.28 250.35 +43.07
2009-2010 249.12 279.72 +30.60
2010-2011 290.76 321.36 +30.60
2011-2012 330.41 353.62 +23.21
Source: DAC, Seeds Division
54 State of Indian Agriculture
Table 3.2: Production and Consumption of Seeds in India
Type of Seed 1991-92 1995-99 2000-01 2005-06 2009-10 2010-11
(i) Production of Breeder 34.9 43.36 42.69 68.64 105 119.21
Seeds, Thousand Qtls
(ii) Production of Foundation
Seeds, Lakh Qtls 3.75 4.76 5.91 7.4 10.5 17.53
(iii) Distribution of Certified/
Quality Seeds, Lakhs Qtls 57.5 69.9 86.27 126.75 257.11 277.3
Source: Directorate of Economics and Statistics, DAC
National Mission on Seeds
3.10 Although the existing scheme namely, “Development and Strengthening of
Infrastructure Facilities for Production and Distribution of Quality Seeds” has contributed
to doubling the availability of quality seeds in the last 5 years, the Scheme requires major
changes and up-gradation to meet the challenges of a rapidly evolving seed sector and to
ensure greater use of quality seeds. Hence, the existing Scheme can be upgraded into a
Mission with a focused, time bound and integrated agenda to improve availability of quality
seeds to farmers at reasonable prices. It is, therefore, proposed to launch the National Mission
on Seeds by subsuming the components of the existing seed scheme.
Box 3.1: The Seeds Bill, 2004
The Seeds Bill, 2004 aims to regulate the quality of seeds and planting material of all
agricultural, horticultural and plantation crops to ensure availability of true to type seeds
to Indian farmers; curb the sale of spurious, poor quality seeds ; protect the rights of
farmers; increase private participation in seed production , distribution and seed testing;
liberalize import of seeds and planting materials while aligning with World Trade
Organisation (WTO) commitments and international standards.
In response to the changes that have taken place in the seed sector , the existing Seeds
Act , 1966 is proposed to be replaced by a suitable legislation. The Seeds Bill , 2004 was
introduced in the Rajya Sabha on 9 December , 2004. It was referred to the Parliamentary
Standing Committee on Agriculture for examination. The Standing Committee after
ascertaining the views of various institutions, individual experts, organizations and the
Department of Agriculture submitted its report on 12 October 2006. The recommendations
of the Committee have been examined in the Department of Agriculture and Cooperation.
Based on the recommendations of the Parliamentary Standing Committee, suggestions
of Members of Parliament and consultations with stakeholders, the Department has
moved Official Amendments to the Rajya Sabha for consideration and passing.
Farm Inputs and Management 55
Challenges
3.11 There is a mismatch between the seed multiplication ratio from breeder seed to
foundation seed and from foundation seed to certified seed, which needs to be addressed.
The unorganized sector comprising a source mainly of farm-saved seeds accounts for nearly
80 percent of this seed supply. This requires attention. Comprehensive and authentic
databases on seed production and trade in India by public and private sectors as required
under the seed and plant variety laws need to be built up. The seed chain and the norms for
quality control should be followed without any compromises or shortcuts. For horticulture
crops which have a long gestation period , it is imperative to ensure that only such varieties
are imported that are suited to Indian conditions . A number of transgenics particularly in
cotton and vegetable crops, are sought to be introduced into the country. The potential loss
of production on account of non introduction of transgenics has to be carefully balanced
against the dangers that transgenics may pose to ecology. However if a crop is safe for
environmental release and beneficial to the farmers, such transgenics may need to be taken
up in order to ensure that food security in the country is achieved and maintained.
The Way Forward
3.12 Farmers will need a genetically diverse portfolio of improved crop varieties that are
suited to a range of agro-ecosystems and farming practices, and resilient to climate change.
Genetically improved cereal varieties accounted for some 50 percent of the increase in yields
over the past few decades. Plant breeders must achieve similar results in the future. However,
timely delivery to farmers of high-yielding varieties requires big improvements in the system
that connects plant germplasm collections, plant breeding and seed delivery. Increased
support to plant genetic material collection, conservation and utilization is crucial. Funding
is also needed to revitalize public plant breeding programmes. Policies should help to link
formal and farmer-saved seed systems, and foster the emergence of local seed enterprises.
3.13 Some important measures to strengthen the seed sector include, improving policies
and legislation for variety development and release as well as seed supply; enactment of
flexible variety release legislation, strengthening capacity by creating a new generation of
skilled practitioners to support enhanced breeding; working with farmers to explore the
ways in which crops and varieties contribute to successful intensification; revitalizing the
public sector and expanding its role in developing new crop varieties; supporting the
emergence of local, private sector seed enterprises through an integrated approach involving
producer organizations; linkages to markets and value addition, etc.
Fertilizers and Manures
3.14 Fertilizer use was started in the country with the initiation of the planning process in
the early fifties. However, only small quantities were consumed during the initial years.
This changed during the green revolution era when the high yielding variety of seeds,
irrigation, fertilizer and credit brought about increased food production. Consumption of
nitrogenous (N), phosphatic (P) potassic (K) fertilizers has increased from 1.1 million tonnes
in 1966-67, the year preceding the green revolution to 28.2 million tonnes in 2010-11, while
the food grain production increased from 74 million tonnes in 1966-67 to 241.56 million
tonnes in 2010-11.
56 State of Indian Agriculture
3.15 India at present is the second largest producer of fertilizer-nitrogen in the world, and
enjoys the third position for phosphate fertilizers. However, potash is totally imported.
India is second only to China in nitrogen and phosphorus consumption. The consumption
of chemical fertilizers (in terms of nutrients) during 2010-11 has been 282 lakh tonnes
comprising of 166 lakh tonnes of Nitrogen, 81 lakh tonnes of phosphatic and 35 lakh tones of
potassic fertilizer. The all-India average consumption of fertilizers has increased from
95 kg per ha in 2004-05 to 144 kg per ha in 2010-11. Very high variability has however, been
observed in fertilizer consumption among the states. While per hectare consumption is
237.1 kg in Punjab and 225.7 kg in Andhra Pradesh, it is comparatively low in MP (81 kg/
ha), Orissa (58 kg/ha), Rajasthan (48.3 kg/ha) and Himachal Pradesh (54.8kg/ha) and below
5kg/ha in some of the North Eastern States.
Table 3.3: Production and Consumption of Fertilizers in India
1991-92 1995-96 2000-01 2005-06 2009-10 2010-11
1. Consumption of Fertilisers,
Lakh tonnes
Nitrogenous (N) 80.46 98.23 109.2 127.23 155.8 165.58
Phosphatic (P) 33.21 28.98 42.15 52.04 72.74 80.5
Potassic (K) 13.61 11.56 15.67 24.13 36.32 35.14
Total (N+P+K) 127.28 138.77 167.02 203.4 264.86 281.22
2. Consumption of 69.84 74.02 89.63 105.5 135.76 144.14
Fertiliser, Kg / Ha.
Source: Directorate of Economics and Statistics, DAC
3.16 To ensure adequate availability of fertilizers, the Department of Agriculture and
Cooperation (DAC) makes an assessment of the requirement for major fertilizers namely,
Urea, DAP, MOP and Complex fertilizers before each cropping season viz. Kharif (1 April to
30 September) and Rabi season (1 October to 31 March) in consultation with all the states and
concerned agencies. Further, to ensure the availability of an adequate quality to farmers,
fertilizer was declared as an Essential Commodity and the Fertilizer (Control) Order (FCO)
was promulgated to regulate the price, quality and distribution of fertilizers in the country.
The FCO provides for compulsory registration of fertilizer manufacturers, importers and
dealers; the specification of all fertilizers manufactured or imported and sold in the country;
regulation of the manufacture of fertilizer mixtures; packing and marking on the fertilizer
bags; appointment of enforcement agencies; setting up of quality control laboratories and
prohibition on the manufacture and import and sale of non-standard or spurious or
adulterated fertilizers.
Farm Inputs and Management 57
(Lakh tonnes)
Fig 3.1: Consumption, Production and Imports of Fertilizers in India
3.17 During 2010-11, the fertilizer inspectors of the central government inspected 1,254 ships
of Urea, MOP, DAP and 100 percent water soluble Complex fertilizers and found 6 ships
containing non-standard fertilizers. Presently there are 74 laboratories in the country
(including 4 Central Government Laboratories) with a total annual fertilizer analyzing
capacity of 1.31 lakh samples.
Box 3.2: Changes in Fertilizer (Control) Order, 1985
In recent years, measures have been taken to render FCO into a more dynamic
instrument of nutrient management policy. Clause 20B has been added to allow for
customized fertilizers in the interest of site-specific nutrient management.
Customized fertilizers of 36 grades of have been included in FCO. To promote
secondary and micro nutrients on a large scale, 9 fortified fertilizers have been
included in the FCO and the procedure for their inclusion simplified. Procedure for
inclusion of new fertilizers in the FCO has also been simplified by dispensing with
the requirement of multi-location trials if the product is one of the variants of the
products already included in FCO. Five bio-fertilizers (rhizobium, azotobacter,
azospirillum, phosphate solubilizing bacteria and mycorrhizae) and three organic
fertilizers (city waste compost, vermi-compost and castor de-oiled cake) have been
included in the FCO to facilitate their use.
3.18 Intensive agriculture, while increasing food production, has at the same time caused
second generation problems in respect of nutrient imbalance including greater mining of
Source : DAC
58 State of Indian Agriculture
soil nutrients depletion of soil fertility, emerging deficiencies of secondary and
micronutrients, decline of the water table and quality of water, decreasing organic carbon
content, and overall deterioration in soil health. Indian soils not only show a deficiency of
primary nutrients (Nitrogen, Phosphorous and Potassium) but also of secondary nutrients
(Sulphur, Calcium and Magnesium) and micro nutrients (Boron, Zinc, Copper and Iron etc.)
in most parts of the country. Besides the three primary nutrients (N, P, K), deficiency of
Sulphur and micro nutrients like Zinc and Boron in many of the states, and of Iron,
Manganese and Molybdenum in some States, has become a limiting factor in increasing
food productivity. In a comprehensive study carried out by ICAR through their Coordinated
Research Project on Micronutrients, Toxic and Heavy Metals, based on an analysis of 2,51,547
soil samples from different states, it was found that 48 percent of these samples were deficient
in Zinc, 33 percent in boron, 13 percent in Molybdenum, 12 percent in Iron, 5 percent in
Manganese and 3 percent in Copper. Under micronutrient deficient situations, the application
of major nutrients alone does not give expected results. During the eleventh Five Year
Plan, a National Project on Management of Soil Health and Fertility (NPMSHF) was approved
and was initiated in 2008-09. The scheme, provides for the setting up of new soil testing
laboratories and a strengthening of the existing labs with micronutrient testing facilities.
Apart from this project, assistance for soil testing laboratories is also being provided to
states/UTs under the Rashtriya Krishi Vikas Yojana (RKVY). The number of soil testing
labs in the country increased to 1,049 with an annual analyzing capacity of 10.7 million
samples as on 31 March 2011. Based on the soil analysis, state governments have issued 408
lakh soil health cards upto October, 2011.
3.19 The National Academy of Agricultural Sciences has estimated (2009) that for meeting
the food needs of the country by 2025, India may have to increase its plant nutrient supply
to over 45 million tonnes from a current level of 25 million tonnes in 2008-09 through NPK
fertilizers and from 4 to 6 million tonnes through organic manures. Out of this, 35 million
tonnes should come from chemical fertilizer sources and the remaining 10 million tonnes
from organic sources. According to ICAR estimates, there is a big gap of 10 million tonnes
of nutrients annually added and drained from the soil by crop removal and erosion. However,
average consumption of fertilizers in the country is low and, currently at 144 kg per hectare
of arable land (2010-11). This is below countries such as Bangladesh (149.8 kg per hectare in
2008), Chile (269 kg per hectare), China (395.1 kg per hectare), Egypt (388.1 kg per hectare),
Pakistan (174.1 kg per hectare) and Vietnam (195.5 kg per hectare).
3.20 The recent decisions by the central government on fertilizer policy have resulted in
brought in major policy changes. These include for instance: (i) nutrient-based pricing and
subsidy, (ii) allowing additional cost of fortification and coating on approved subsidized
fertilizers to manufacturers (5-10 per cent above the MRP), (iii) paying freight subsidy for
all subsidized fertilizers on an actual basis instead of uniform basis, and (iv) allowing higher
rate of concession to single superphosphate (SSP) fertilizer to revive the SSP industry.
The Way Forward
3.21 Considering that an imbalanced use of fertilizers is seen as the main reason for a decline
in the crop response ratio, soil test-based site-specific nutrient management is a way forward.
Farm Inputs and Management 59
Therefore, initiatives on the setting up of adequate capacity for soil testing and for the
adoption of information technology based systems to generate and communicate suitable
advisories based on soil test crop response data to farmers in the country.
3.22 In order to meet the projected requirement of agricultural production, an increase in
consumption of fertilizers would be combined with the integrated nutrient management
approach. An emphasis on a balanced use of fertilizers for optimum results would
simultaneously be promoted.
3.23 Increasing consumption of fertilizers would require suitable arrangements to secure
supplies of fertilizers. There has been no significant addition to the urea production capacity
in the last 10 years. While the requirement of di-ammonium phosphate (DAP) is met largely
by imports, that of the muriate of potash (MOP) is met entirely by imports. With increasing
consumption, the quantum of fertilizer imports has also been increasing. During 2010-11,
India imported 66 lakh tonnes of urea, 74 lakh tonnes of DAP and 64 lakh tonnes of MOP.
Instability in international prices of fertilizers with steep increases are a cause for concern.
Measures to increase the domestic production of fertilizers as well as secure imports at
stable prices are important.
Pesticides
3.24 In well managed farming systems, crop losses to insects can often be kept to an
acceptable minimum by deploying resistant varieties, conserving predators and managing
crop nutrient levels to reduce insect reproduction. Recommended measures against diseases
include use of clean planting material, crop rotations to suppress pathogens, and eliminating
infected host plants. Effective weed management entails timely manual weeding, minimized
tillage and the use of surface residues. When necessary, lower risk synthetic pesticides
should be used for targetted control, in the right quantity and at the right time. Integrated
pest management can be promoted through farmer field schools, local production of
biocontrol agents, strict pesticide regulations, and a removal of pesticide subsidies. With
liberalization of trade, the threat of increased risk of introduction of exotic pests and weeds
in the country with the potential to cause serious economic loss has to be countered effectively
by the plant quarantine system.
3.25 Crop losses in the country due to various pests range from 10 to 30 percent each year
depending upon the severity of pest attack. Pesticides play an important role in sustaining
agricultural production of the country by protecting crops from pest attacks and by keeping
the pest population under control. Availability of safe and efficacious pesticides and their
judicious use by the farming community is critical to a sustained increase in agricultural
production and productivity. Pesticides are also useful in health programmes for controlling
vectors responsible for diseases like malaria. Per hectare consumption of pesticide in India
is 381 g which is low as compared to the world average of 500 g. A low consumption in
India can be attributed to the existence of fragmented land holdings, dependence on
monsoons, insufficient awareness among farmers, etc. Only 25-30 percent of the total
cultivated area in the country is under pesticide cover. India’s consumption of pesticides is
only 2 percent of the total world consumption.
60 State of Indian Agriculture
Table 3.4: Consumption of Pesticides in India
1991-92 1995-96 2000-01 2005-06 2009-10 2010-11
Consumption of Pesticides, Th Tonnes 72.13 61.26 43.58 39.77 41.82 55.54
Source: Directorate of Economics and Statistics, DAC
3.26 Pesticides have toxic properties and, therefore, need to be regulated. India has an
established system to regulate the use of insecticides under the Insecticides Act, 1968. The
import, manufacture, sale, transport, distribution and use of pesticides are regulated under
the Insecticides Act and the Rules framed thereunder with a view to prevent risks to human
beings and animals. Under the Insecticides Act, 1968, a Registration Committee (RC) has
been constituted which registers pesticides for import and manufacture in the country.
Presently, 230 insecticides stand registered for use in the country.
Box 3.3: Computerized Online Pesticide Registration System
A computerized online pesticide registration system was introduced in July 2008 in the
Secretariat of Central Insecticides Board & Registration Committee (CIB&RC), Faridabad.
The system enables pesticide companies to apply for registration of pesticide products
and receive any query about deficiencies online. The status of the application is also
visbile to the applicant online. The system is designed to increase efficiency and reduce
transaction cost with greater transparency.
3.27 Quality of pesticides is monitored by the central and state insecticide inspectors who
draw samples of insecticides from the market for analysis in the 68 State Pesticide Testing
Laboratories (SPTLs) that have a total annual capacity of 68,110 samples in 23 States and one
Union Territory. For the states which do not have facilities for testing pesticides, the facilities
of testing samples are available at two Regional Pesticides Testing Laboratories (RPTLs),
set up by the Central Government at Chandigarh and Kanpur. In case of disputes, the samples
are referred to the Central Insecticides Laboratory (CIL), Faridabad.
Box 3.4: Accreditation of Pesticide Analysis Laboratories
To ensure greater quality assurance in the pesticide analysis by notified laboratories under
the Insecticides Act, 1968, the Central Insecticides Laboratory and both Regional Pesticides
Testing Laboratories have obtained accreditation from the National Accreditation Board
for Testing and Calibration Laboratories (NABL). The State Governments have also initiated
efforts to obtain NABL accreditation for State Pesticide Testing Laboratories.
Box 3.5: Strict Regulatory Regime
There are serious implications of pesticide use on safety as well as crop protection, therefore
is a need for strict enforcement of pesticide regulations. The Pesticides Management Bill
incorporates provisions for more effective regulation with punishment commensurate
with the severity of offence. However, the Department of Agriculture and Cooperation
has taken action against domestic as well as multi-national companies found flouting the
existing regulations governing registration, import, manufacture and sale of pesticides,
by cancelling certificates of registration of the products in question.
Farm Inputs and Management 61
3.28 Pesticide residues in food commodities is an important food safety issue. To monitor
pesticide residues in agricultural commodities for consumption, a central sector scheme
entitled “Monitoring of Pesticide Residues at National Level” in food commodities and
environmental samples has been in operation since October, 2006 with the participation of
21 laboratories functioning under the following: the Ministry of Agriculture, Indian Council
of Agricultural Research, Ministry of Health and Family Welfare, Ministry of Environment
and Forests, Council of Scientific and Industrial Research, Ministry of Chemicals and Fertilizer,
Ministry of Commerce & Industry and State Agricultural Universities across the country.
Under the scheme, participating laboratories collect samples of food commodities from
various Agriculture Produce Marketing Committee (APMC) markets, the Public Distribution
System (PDS) and irrigated water and soil samples from intensive agricultural fields across
various parts of the country. The samples are analyzed for presence of pesticide residues in
various food commodities such as vegetables, fruits, cereals, spices, pulses, milk, butter,
fish, meat, tea etc. The reports are shared with state governments and the concerned
Ministries and Organizations to take necessary action including intensifying promotion of
an integrated pest management approach, which emphasizes a safe and judicious use of
pesticides.
3.29 The government is promoting Integrated Pest Management (IPM) as the main plank of
a plant protection strategy for safe and judicious use of pesticides. IPM involves use of
cultural, mechanical, biological methods and the use of pesticides as a last resort for
controlling insects-pests, diseases and weeds. Under a scheme titled “Strengthening &
Modernization of Pest Management Approach in India”, 31 Central IPM centres (CIPMCs)
located across the country have the mandate under the Directorate of Plant Protection,
Quarantine & Storage (DPPQ&S), Faridabad for pest and disease monitoring, production
and release of bio-control agents and bio-pesticides, conservation of bio-control agents and
human resource development in IPM by organizing Farmers’ Field Schools (FFSs).
Box 3.6: Intensive Pest Surveillance and Management
In response to major pest attacks in recent years, some states have implemented intensive
pest surveillance and management systems for major crops vulnerable to pests and
diseases under Rashtriya Krishi Vikas Yojana (RKVY), e.g., Maharashtra in 2009 (for
soybean and pulses) and Orissa in 2010 (for rice). The new strategy has proved to be
effective and has been advocated for other States by the National Centre for Integrated
Pest Management (NCIPM), New Delhi of ICAR.
Box 3.7: Capacity Building - National Institute of Plant Health Management
Capacity building is an important area in plant protection. The National Plant Protection
Training Institute (NPPTI), Hyderabad was converted into a society in 2008 to give it
more autonomy for human resource development in bio-security. The institute, renamed
as the National Institute of Plant Health Management (NIPHM), is headed by a Director
General. Its facilities are being upgraded and the faculty expanded for augmenting capacity
for training in plant health management. NIPHM is being developed as the premier
institution for capacity building in the country as well as internationally.
62 State of Indian Agriculture
3.30 Monitoring and control of locusts in 2 lakh sq. km of the Scheduled Desert Area (SDA)
in parts of Rajasthan, Gujarat and Haryana is undertaken by the Locust Warning Organization
(LWO) under DPPQ&S that has its Field Headquarter located in Jodhpur and a Central
Headquarter at Faridabad. Wireless communication between Jodhpur (India) and Karachi
(Pakistan) is also maintained every year from June to November for exchanging locust
intelligence between the two countries and meetings on the border are held at regular
intervals.
3.31 The objective of plant quarantine is primarily to prevent the introduction of exotic
pests, diseases and weeds through imports of agricultural commodities or plant material
into India and similarly, prevent introduction of indigenous pests, diseases and weeds in
other countries through exports. The Plant Quarantine (Regulation of Import into India)
Order, 2003 issued under the provisions of the Destructive Insects and Pests Act, 1914 (DIP
Act) regulates imports. Post entry quarantine inspection is undertaken in case of propagation
of plant material. Phytosanitary certificates (PSCs) are issued for exports as per the
International Plant Protection Convention (IPPC), 1951 of the Food and Agriculture
Organization (FAO). These functions are being discharged by 35 Plant Quarantine Stations
(PQSs) functioning under DPPQ&S at various international airports, seaports and land
customs stations across the country to facilitate international trade in agriculture products.
3.32 The existing legislation governing regulation of pesticide is old and needs to be replaced
by new laws providing a more effective regulatory framework. The Pesticides Management
Bill, which is intended to replace the Insecticides Act, 1968, has been introduced in the
Parliament. New and emerging factors including globalization, genetic engineering, climate
change, bio-terrorism and transboundary diseases have profound implications on plant
and animal health as well as environment and possessing strong connections with human
health. To counter these threats, a strengthening of existing the systems is required. Efforts
to upgrade capacity in plant protection need to be continued.
Box No 3.8: Upgrading Plant Quarantine Services
Upgradation of the plant protection regulatory framework is required to meet the emerging
challenges of safeguarding the country’s bio-security. As part of these efforts, the following
major initiatives have been taken:
• Online plant quarantine services have been introduced in January 2011 to enable exporters
to apply for a phytosanitary certificate and importers to apply for import permit and
release order online. Of the plant quarantine work, 93 percent is now being conducted
online.
• Round the clock (24x7) plant quarantine services have been introduced at Chennai, Mumbai
and New Delhi.
• Phytosanitary certificates with standard format and enhanced security features have been
introduced to prevent fraud.
• Five major Regional Plant Quarantine Stations (RPQS) located at Amritsar, Chennai,
Kolkata, Mumbai and New Delhi have secured ISO 9001:2000 certification, an international
standard for an organization’s quality management system.
Farm Inputs and Management 63
The Way Forward
3.33 Enactment of new legislation on pesticide management would provide more effective
regulation of pesticides in the future.
3.34 An Agricultural Biosecurity Bill is being prepared to replace the Destructive Insects
and Pests Act, 1914 and for enabling together plant, animal and marine protection and
quarantine set ups under a high powered body with adequate powers to safeguard the
country’s agricultural biosecurity.
3.35 Establishment of a National Pesticide Reference Repository (NPRR) to address the
issues of supply of reference standards and variation in analysis of pesticide samples is
planned. Further, for detecting the presence of chemical pesticides in microbial bio-pesticides
and products, the setting up of a new laboratory at the national level namely, the National
Pesticides Investigational Laboratory (NPIL) is planned. This laboratory will also have a
Technical Audit Division to the monitor work of the pesticides testing laboratories. NPRR
and NPIL, alongwith accreditation of laboratories would help bring about a distinct change
in the standard of testing of pesticides.
3.36 Intensive pest surveillance and management systems for major crops vulnerable to
pests and diseases would have to be adopted by states taking advantage of the funding
available under the Rashtriya Krishi Vikas Yojana.
3.37 The National Institute of Plant Health Management, Hyderabad would be developed
further to assist in upgradation of capacity in plant health management as well as biosecurity
not only in the country but also internationally.
Farm Machinery and Equipment
3.38 Farm mechanization saves time and labor, cuts down crop production costs in the long
run, reduces post-harvest losses and boosts crop output and farm income. Empirical evidence
confirms that there is a strong correlation between farm mechanization and agricultural
productivity. States with a greater availability of farm power show higher productivity as
compared to others.
Table 3.5: Level of Mechanization of Different Operations in Indian agriculture
Operation Percentage
Soil working and seed bed preparation 40
Seeding and planting 29
Plant protection 34
Irrigation 37
Harvesting and threshing 60-70 percent for wheat and rice and
<5percent for others
Source: Singh et al.
64 State of Indian Agriculture
3.39 Currently increasing the threat to natural resources, notably land and water, has further
necessitated a switching over to machine assisted resource-conservation techniques such as
zero-tillage, raised-bed planting, precision farming, drip or sprinkler irrigation, etc. Farm
mechanization has now become more relevant in mitigating the effect of climate change by
readjusting crop sowing schedules. For example, the climate change-driven early onset of
summers in the northern states has often resulted in wheat yield dropping by 1.5 quintal
per hectare with every one week’s delay in its planting after mid-November. This loss can
be averted by sowing wheat early, which is possible only if the previous paddy crop is
harvested mechanically and wheat is planted with zero-till seed drills that do not require
ploughing the land. A greater degree of farm mechanization can also address the issues of
scarcity of farm labor during peak agricultural seasons of sowing and harvesting with the
implementation of the Mahatma Gandhi National Rural Employment Guarantee Act
(MGNREGA).
3.40 More recently, the financial reforms in the 1990s, easy availability of institutional
financing and capital subsidy especially on tractors initially propelled growth in farm
mechanization. However, since 2007-08, there has been a slowdown, which many believe is
due to financial institutions becoming cautious and adopting more stringent lending norms.
The reason for increasing defaults on such loans, among others, is the ‘unviable’ nature of
individual ownership of ‘high value agriculture equipment’ like tractors, power tillers, etc.
Structural issues like high procurement cost, adverse economies of scale, lower credit
worthiness, etc. have resulted in an automatic ‘exclusion’ of the majority of small and marginal
farmers in India from the benefit of farm mechanization. As a result, farm mechanization has
developed a stronger bias towards larger land holdings (NSSO 2005).
3.41 Presently, India is the largest manufacturer of tractors in the world, accounting for
about one-third of the global production. Power tillers are becoming popular in lowland
flooded rice fields and hilly terrains. Steady growth was observed in manually operated
tools, animal operated implements, and equipments operated by mechanical and electrical
power sources. In manually operated equipment, the number of sprayers has almost doubled
since 1992. After liberalization and with development of prototypes of machines,
manufacturing got a big boost particularly in Haryana, Punjab, Rajasthan, Madhya Pradesh
and Uttar Pradesh. About 700-800 combines are sold annually. Tractor operated combine
harvester, costing only 25-30 percent of the self propelled combine, has been a good
innovation by manufacturers of Punjab; and this machine can be owned individually by
farmers. The self propelled combines are largely owned by custom-hiring contractors.
Standardization and quality of implement manufacturing is ensured mainly by BIS and
over 500 standards on agricultural machinery are prescribed. Since the early seventies, the
composition of the relative share of different sources of power for farming operations has
undergone significant change as can be seen from Table 3.6. According to a study (Singh
et al.), the share of agricultural workers and draught animals have come down from 63.5
percent in 1971-72 to 13.67 percent in 2009-10 whereas that of tractors, power tillers and
diesel engines and electric motors has gone up from 36.51 percent to 86.33 percent during
the same period.
Farm Inputs and Management 65
Table 3.6: Percentage share of different farm power sources in Indian agriculture
Year Agricultural Draught Tractors Power Diesel Electric Power,
workers animals tillers engines motors kW/ha
1971-72 10.64 52.86 8.45 0.11 17.16 10.79 0.424
1981-82 9.20 33.55 18.46 0.11 22.85 15.82 0.592
1991-92 7.22 20.50 26.14 0.16 21.14 24.84 0.907
2001-02 5.70 11.76 36.77 0.36 19.10 26.31 1.352
2005-06 5.39 9.97 38.45 0.44 20.09 25.66 1.498
2009-10 5.12 8.55 41.67 0.52 19.01 25.13 1.658
Source : Singh et al.
3.42 The Department of Agriculture and Cooperation, Ministry of Agriculture, has been
providing financial assistance on agricultural equipment and implements to all categories
of farmers under its various Central Sector Schemes. This has been instrumental in bringing
level of farm power from 1.35 Kw per ha from beginning of Tenth Five year plan to 1.66 Kw
per ha by the end of 2009-2010. Simultaneously, the farm equipment industry has also
witnessed robust sales growth in tractors and power tillers (Table 3.7)
Table 3.7: Sales of Tractors and Power Tillers in India
Year Tractors Sales Power Tillers Sales
(Nos.) (Nos.)
2004-05 2,47,531 17,481
2005-06 2,96,080 22,303
2006-07 3,52,835 24,791
2007-08 3,46,501 26,135
2008-09 3,42,836 35,294
2009-10 3,93,836 38,794
2010-11 5,45,109 55,000
2011-12 (Upto December 2011) 4,19,270 39,900
Source: Department of Agriculture and Cooperation
3.43 Concerted efforts of state and central government have seen greater adoption of
mechanization in land preparation or tilling, harvesting and rice transplantation. Some of
the agricultural equipments/farm machinery which are gradually becoming popular are
given in Fig 3.2.
66 State of Indian Agriculture
Fig 3.2: Popular Agricultural Equipments
Farm Inputs and Management 67
Challenges
3.44 Farm mechanization in India, was able to achieve a meagre growth rate of less than 5
percent in last two decades. The average farm power availability in the country is at a low
level compared to other countries like China and Korea. Farm Mechanization in India is
still in its early stages. Farm mechanization has become a dire necessity in view of significant
reduction in supply of labor for agricultural operations in recent years.
3.45 Mechanizing small and non-contiguous group of lands is against ‘economies of scale’
especially in operations like land preparation and harvesting. With continued shrinkage in
average farm size, more and more farms will fall into the adverse category thereby making
individual ownership of agricultural machinery progressively more uneconomical.
Moreover, farm mechanization is capital intensive and thus it remains beyond the reach of
small and marginal farmers. Custom Hiring Centres could have been an alternate option.
But, these centres need a minimum scale for efficient operation as the activity is capital
intensive. They also have a longer gestation period due to lower asset utilization on account
of the seasonal nature of agriculture demand.
3.46 Higher risk due to ‘uncertain demand’ and ‘immature market’ has barred seasoned
business entities from entering this segment. First generation entrepreneurs willing to
establish these centres face a significant ‘entry barrier’ on account of non availability of
financing either in the form of venture capital or institutional loans. With the level of Non-
Performing Assets (NPAs) continuing to remain significant, it is unlikely that the risk
perception of financial institutions will change in the near future. Further, non-availability
of the much needed technical and institutional support and after sales has further prevented
this segment from developing and maturing. Small or first generation entrepreneurs even
if they are enterprising enough to establish custom hiring centres, do not usually qualify for
bank loans for want of collaterals or credit guarantees. As a result, there is virtually a
‘complete market failure’ in this segment. Intensive research on farm mechanization is also
not adequate as it is a very capital intensive activity.
The Way forward
3.47 Recognizing the need to spread the benefits of farm mechanization among all strata of
farmers especially small and marginal farmers, the Department of Agriculture & Cooperation
(DAC) proposes to formulate one integrated National Mission on Agricultural Mechanization
(NMAM).
National Mission on Agricultural Mechanization (NMAM)
3.48 NMAM will put ‘Small and Marginal Farmers’ at the core of the interventions with a
special emphasis on ‘reaching the unreached’, i.e. bringing farm mechanization to those
villages where the technologies deployed are decades old. Besides, the Mission also proposes
to cater to ‘adverse economies of scale’ by promoting ‘Custom Hiring Services’ through ‘the
rural entrepreneurship’ model.
68 State of Indian Agriculture
3.49 The Mission will aim at catalyzing an accelerated but inclusive growth of agricultural
mechanization in India by way of the following:
Increasing the reach of farm mechanization to small and marginal farmers and
to the regions where availability of farm power is lower;
Offsetting adverse ‘economies of scale’ and ‘higher cost of ownership’ of high
value farm equipments by promoting ‘Custom Hiring Centres’ for agricultural
machinery;
Passing on the benefit of hi-tech, high value and hi-productive agricultural
machinery to farmers through creation of hubs for such farm equipments;
Promoting farm mechanization by creating awareness among stakeholders
through demonstration and capacity building activities; and
Ensuring quality control of newly-developed agricultural machinery through
performance evaluation and certification at designated testing centres located
all over the country.
3.50 The following components are envisaged in the Mission for accelerated and inclusive
growth of farm mechanization in India:
Promotion and strengthening of Agricultural Mechanisation through Training,
Testing and Demonstration;
Post Harvest Technology and Management (PHTM);
Financial Assistance or Procurement Subsidy for Agriculture Machinery and
Equipments;
Establishment of Farm Machinery Banks for Custom Hiring;
Establishing a Hi-Tech, High Productive Equipment Hub for Custom Hiring;
Enhancing Farm Productivity at the village level by introducing appropriate
farm mechanisation in selected villages; and
Creating ownership of appropriate farm equipment among Small and Marginal
farmers in the eastern/north eastern region:
Irrigation
3.51 In about five decades of Independence, the major controls on management of water
resources have changed hands from communities (tanks and small water structures) to
government (major and medium irrigation projects) to the private domain (ground water).
Additional net irrigated area (approximately 84 percent in the past two decades) has come
from private groundwater development, the net area irrigated by private tube wells is double
than that by canals (NAAS, 2009). Groundwater provides about 70 percent of irrigation and
80 percent of the drinking water supplies. The ultimate irrigation potential in the country is
estimated at about 140 million hectares. Of this, about 58.5 million ha is from major and
Farm Inputs and Management 69
medium irrigation sources, and 81.5 million ha is from minor irrigation sources (about 64.1
million ha from groundwater irrigation and 17.4 million ha from surface water).
Challenges
3.52 Across all states, there is a persistent gap between the assessed ultimate irrigation
potential and the actual potential that has been put to use. Water scarcity will intensify in
future with increase in population and demand for food, and the current water use practices
cannot be sustained over the longrun. Inefficient water use in irrigation is also leading to
environmental degradation via waterlogging and induced salinity.
3.53 The irrigation efficiency in the systems needs to be upgraded from the present level of
35 percent to about 60 percent in the surface water system and from 65 percent to 75 percent
in the groundwater system. Even a rise of 5 percent irrigation efficiency can increase the
irrigation potential by 10-15 million ha. New micro-irrigation technologies include drip
and trickle systems, surface and subsurface drip tapes, micro-sprinklers, sprayers, microjets,
spinners, rotors, bubblers, etc. Despite wide promotion, only about 0.5 million ha currently
are under micro-irrigation (NAAS 2009).
The Way Forward
3.54 Irrigation has been an integral part of our monsoon-dependent agriculture and the
aggravating groundwater crisis in many States has resulted in the government adopting
measures to control it. Modern techniques such as micro-irrigation, watershed management,
rainwater harvesting and groundwater recharging will be vital in utilizing the existing
resources and expanding irrigation in a viable manner. The public sector has been spending
funds to increase the net irrigated area without commensurate success. This indicates the
need for demand and supply oriented reform measures to ensure an equitable distribution
and efficient use of the available water resources. For this, a major exercise involving reform
in water management (especially demand side), in the pricing of water and power, and
institutional aspects related to farmer participation are important. Major investments in
research and development that enhance water use efficiency will be required to grow the
right quality and quantity of agricultural produce. Extension services that reach out to
farmers will help boost the speed of technology-adoption as well as develop specialized
skills and knowledge related to water application and high value agriculture.
Labour and Agricultural Wages
3.55 At the all-India level, approximately 60 percent of the rural labour force and 45 percent
of the urban labour force is self-employed. Rural casual labour constitutes the single largest
segment of the total workforce in India. Among rural casual labourers, agricultural labourers
occupy a predominant position. Most of the workers engaged in agriculture are highly
under-employed with very low levels of income. Agricultural Wages reflect the well being
of labour in rural India. The rural agricultural wage rate, hence, is considered as one of the
most robust indicators of economic well-being, not only of agricultural labourers, but also
of the overall rural population.
70 State of Indian Agriculture
3.56 Agriculture is a labour intensive activity. Cost of cultivation data shows that labor
accounts for more than 40 percent of the total variable cost of production in most cases.
Therefore, availability of labour to work in agriculture is crucial in sustaining agricultural
production. Raising the wage levels of casual workers both in agriculture and non-agriculture
sectors needs adequate policy attention. In this regard, stricter implementation of the
Minimum Wages Act, 1948 and targeted employment generation programmes are important.
3.57 NREGA, renamed as Mahatma Gandhi National Rural Employment Guarantee Act
(MGNREGA), enacted on September, 2005 provides for the enhancement of livelihood
security of the households in rural areas of the country by providing at least one hundred
days of guaranteed wage employment in every financial year to every household whose
adult members volunteer to do unskilled manual work. A very significant feature of this
Act is that if a worker who has applied for work under MGNREGA is not provided
employment within 15 days from the date on which work is requested, an unemployment
allowance shall be payable by the state government at the rate prescribed in the Act. The
Scheme is working as a social safety net. It has prevented distress migration and helped in
empowerment of women. Some studies carried out in recent years have shown that while
MGNREGS has assisted in renovation of ponds and canals, water conservation and water
harvesting structures, drought proofing and tree plantation, flood control, micro and minor
irrigation works and land development which will have a positive impact on agricultural
productivity, it has also led to a substantial increases in the wage rates of agricultural and
non-agricultural laborers, reduced the availability of labour for agricultural operations and
increased the cost of cultivation.
3.58 Agricultural wages have been traditionally low due to low productivity, large disguised
unemployment in agriculture due to lack of sufficient employment opportunities elsewhere.
However, in recent years there is a perceptible change in this trend due to rapid economic
growth and adoption of policies for employment generation including promotion of self
employment opportunities. Major policy measures influencing the wage increase are
MNREGA and Minimum Wages Act implemented by the government.
3.59 There is a steady increase of agricultural wages in all major the states of India in recent
years. The annual average wage in Andhra Pradesh for unskilled agricultural labor has
increased by 28.6 percent in 2009 compared to 2008 and further increased by 22.5 percent in
2010. Similarly in Orissa the wage increase has been 20 percent in 2009 over 2008 and 30.7
percent in 2010 over 2009. In Punjab the increase has been 22.2 percent in 2009 and 20.3
percent in 2010. In Tamil Nadu the increase has been 20.4 percent and 27.6 percent,
respectively, in 2009 and 2010 in comparison to the respective previous years. Similar trend
has prevailed in all the other States with double digit growth in wages even exceeding the
rate of inflation that prevailed during this period. Rural wages in Kerala were the highest
in the country in the range of Rs.216-305 during 2008-10, followed by Tamil Nadu, Andhra
Pradesh and Karnataka in that order in the Southern Region. In the Northern region, Haryana
recorded the highest agricultural wages in the range of Rs.121-182 during 2008-10 period
followed by Punjab in the range of Rs 110-162, and Rajasthan in the range of Rs.105-139.
West Bengal and Uttar Pradesh followed in that order.
Farm Inputs and Management 71
3.60 Employment opportunities under MGNREGA have made a significant impact in the
rural areas by providing assured minimum employment and increasing the rural wages.
Wages for rural households under the MGNREGA have increased in Maharashtra from
Rs.47 to Rs.72, in Uttar Pradesh from Rs.58 to Rs.100, in Bihar from Rs.68 to Rs.100, in West
Bengal from Rs. 64 to Rs. 100, in Madhya Pradesh from Rs.58 to Rs.100, in Jammu & Kashmir
from Rs.45 to Rs.100 and in Chhattisgarh from Rs.58 to Rs.100 to name a few states during
2007-10. At the national level, the average wages paid under the MGNREGA have increased
from Rs.75 in 2007-08 to Rs.93 in 2009-10. In order to optimize synergies to bring convergence
between MGNREGA and schemes of Ministry of Agriculture guidance have been issued to
all State Governments.
Credit and Insurance
3.61 Agriculture credit plays an important role in maintaining agricultural production by
allowing producers to meet their credit need during the entire cycle of crop production and
at the same time provides funds for investment purposes. With increased commercialization
of agriculture and increase in the use of modern inputs, the amount and share of purchased
inputs in the total production is increasing rapidly. Besides, private investment in different
types of assets like irrigation equipments, farm machinery, and land improvements are
required for efficient production and for maintaining faster agricultural output growth.
Farmers have to avail credit either from institutional sources or from non- institutional
sources like private money lenders. Loans from non-institutional sources though very
common, are often exploitative, with very high interest rate, and from such sources the
borrowers often fall into debt trap. Realizing these difficulties, the government has initiated
several measures to galvanize the institutional credit system to make it more responsive to
the needs of farmers.
3.62 The objective of the Agricultural Credit Policy in India since Independence has been
gradual replacement of moneylenders by institutional sources and a lowering of interest
rates. Until banks were nationalized, cooperative institutions were the only source of
institutional credit in rural areas. Since nationalization, scheduled commercial banks and
regional rural banks (RRBs) have also been part of the formal credit system. The share of
commercial banks has substantially increased from 53 percent in 2000-01 to 74.5 percent in
2010-11 (Fig 3.3) As percentage of agricultural GDP, institutional credit to agriculture has
increased from 2.56 percent in 1970–1971 to 7.11 percent in 1980–1981 to 11.47 percent in
2000–2001, and 32.21 percent in 2010-11, although studies do suggest asymmetries in
distribution of credit across farm size and across regions. But small farmers continue to
resort to informal lenders (despite Kisan credit cards), as the current system of institutional
credit to farmers suffers from non-farmer friendly practices, delays in credit delivery and
collateral problems.
3.63 Keeping in view the importance of flow of credit to agriculture, in particular to the
smaller borrowers who may not have the necessary assets as collateral, the banks have been
advised to waive margin and security requirements for agricultural loans up to Rs.100, 000.
72 State of Indian Agriculture
The “No Due Certificate” for small loans to SF/MF, share croppers, etc. have been dispensed
with and instead banks have been instructed to obtain self declaration from the borrowers.
3.64 One of the major challenges in the sector has been ensuring the provision of timely and
adequate credit to the farmers. An innovative strategy conceived in 1999 by the GOI created
the Kisan Credit Cards (KCC) through which farmers could avail short-term loans for crops
from banks. The scheme was initiated in consultation with the Reserve Bank of India and
National Bank for Agricultural and Rural Development (NABARD) and by the end of October,
2011, 10.78 crore KCC were issued to eligible farmers all over India. All cooperative banks,
scheduled commercial banks and regional rural banks were given annual targets and their
progress was monitored at every step by NABARD.
3.65 The Kisan credit card is essentially a type of revolving cash credit facility with
withdrawals and repayments to meet the production credit needs, cultivation expenses and
the contingency expenses of the farmers. Recently, banks have also extended credit towards
working capital requirements for other activities such as cattle breeding and poultry farming
through this scheme. Each farmer is given a passbook and is sanctioned a credit limit, which
can be modified depending on his performance and repayment record, thereby maintaining
a working relationship between him and the bank. While the limit of credit is decided on
the basis of operational landholding, cropping pattern and scale of operations, the full year's
credit requirement of the borrower is taken care of and each card is valid upto five years.
With minimum paper work and simplification of documentation for withdrawal of funds
from the bank, not only has availability of credit been made easier but the system has also
been made straightforward to operate and farmers have been given sufficient freedom to
Fig 3.3: Sources of Institutional Agricultural Credit
Percentage
Source: Department of Agriculture and Cooperation
Farm Inputs and Management 73
decide how to use their credit. The card also carries some insurance cover at a nominal
premium.
3.66 The implementation of the scheme has resulted in an increase in the flow of credit to
the agriculture sector and a substantial reduction in borrowing from the informal sector for
short-term needs. The programme has benefited both farmers and bankers as there has been
a significant saving in time and cost of credit delivery, reduction in transaction costs, better
recoveries and reduction in the workload of bank branches. However, the sanctioning of
lower credit limits, low awareness levels about insurance features and the tendency to treat
the card as a term loan facility rather than as a cash credit facility still remain areas of concern.
3.67 Banks have now begun taking advantage of the popularity of the cards by enhancing
the features of the card in making the card ATM-compatible, issuing chip-based smart cards
which will contain embedded information pertaining to land records, limit sanctioned,
amount withdrawn against bank account, etc. With near-universal coverage, the Kisan credit
card has met all its objectives and is on its way to becoming a powerful tool in consolidating
the banker-farmer relationship.
3.68 NABARD has formulated a scheme to provide loans to tenant farmers and oral
lessees for raising crops. NABARD would facilitate the formation and financing of
groups of Tenant Farmers by organizing them into Tenant Farmers Groups (TFGs). The
objective of the scheme is to provide crop loans through institutional agencies to Tenant
Farmers, Oral Lessees and share croppers, who are not being extended credit support
due to their inability to provide tangible securities and/ or are unable to produce the
documents regarding their rights on the land. NABARD would extend refinance support
to RRBs and State Cooperative Banks (SCBs)/ District Central Cooperative Banks DCCBs
to the extent of 100 percent of the loans provided by the banks to the TFGs. NABARD is
facilitating implementation of SHG-Bank Linkage Programme through Commercial
Banks, RRBs, Cooperative Banks and Self Help Promoting Institutions (SHPIs), like
NGOs, State Government departments, Farmers Clubs, Individual Rural Volunteers,
etc since 1992 onwards. The programme basically aims at linking the self help groups
with the formal banking structure in the country to obtain the credit for meeting their
emergent production and consumption needs. On the basis of recommendations made
by the Vaidyanathan Committee Task Force, the government of India had approved a
Revival Package for Short Term Cooperative Credit Structure (STCCS) aimed at making
it a well managed and vibrant structure to best serve the credit needs of Rural India.
The revival Package envisages an outlay of Rs.13, 597 crore for recapitalization of STCCS,
capacity building & training and computerization subject to legal reforms by the State
Governments. The Revival Package seeks namely, to (i) provide financial assistance to
bring the system to an acceptable level of health; (ii) introduce legal and institutional
reforms necessary for their democratic, self-reliant and efficient functioning; and (iii)
take measures to improve the quality of management as an integrated package. As on
May, 2011 an amount of Rs.8993.08 crore has been released by NABARD as Government
74 State of Indian Agriculture
of India share for recapitalization of 53,026 Primary Agricultural Credit Societies
(PACS).
3.69 The Government of India's Agricultural Debt Waiver and Debt Relief Scheme
(ADWDRS), 2008 aimed at de-clogging the lines of credit that were choked due to the
debt burden on the farmers and to entitle these farmers for fresh credit. All agricultural
loans disbused by Public Sector Banks, Private Sector Banks, Cooperative Banks, Local
Area Banks and Regional Rural Banks between 1 April, 1997 to 31 March, 2007 to farmers,
overdue as on 31 December, 2007 and remaining unpaid upto 28 February, 2008 were
eligible for Debt Waiver Debt Relief. For marginal farmers (i.e., holding upto 1 hectare)
and small farmers (1-2 hectare), there was complete waiver of all loans that were overdue
on 31 December, 2007 and which remained unpaid until 29 February, 2008. In respect of
other farmers, there was a provision for One Time Settlement (OTS) scheme for all loans
that were overdue on December 31, 2007 and which remained unpaid until February
29, 2008. Under the OTS, a rebate of 25 per cent has been given against payment of the
balance of 75 percent. In case of the revenue districts covered under DPAP, DDP and
PM special relief package, other farmers were given an OTS rebate of 25 percent of the
eligible amount or Rs.20,000 whichever is higher subject to the condition that the farmer
pays the balance of the eligible amount. Debt Waiver portion of the Scheme was closed
on 30 June 2008.
3.70 As per the provisional figures, a total of 3.01 crore small and marginal farmers and
67 lakh 'other farmers' have benefited from the Scheme involving debt waiver and debt
relief of Rs. 65,318.33 crore. Against this, the total amount of claims eligible for
reimbursement from the government after the permitted inclusions and exclusions in
the Guidelines is expected to be about 15 percent lower than the above figure because
lending institutions were neither to claim from the central government, nor recover from
the farmer for instance (i) interest in excess of the principal amount, (ii)unapplied interest,
(iii) penal interest,(iv) legal charges, (v) inspection charges and (vi) miscellaneous
charges, etc. All such interest/charges will be borne by the lending institutions. As on
31 August 2011, the Government of India (Gol) has released an amount of Rs.51,340.47
crore to the lending institutions as reimbursement under the Scheme.
3.71 As a result of various steps taken by the government the flow of institutional credit
to agricultural sector has recorded a tremendous growth especially after 2000-01. Short-
term institutional credit met about two-thirds of total cost of inputs (excluding labor)
used in agriculture during 2005-06. During the same year, the level of production credit
exceeded 15 percent of the value of agricultural output while term credit reached a
level of 11 percent of the output. On 18 June, 2004, GOI announced a comprehensive
farm credit package which, inter-alia, envisaged doubling of farm credit flow in three
years with 2003-04 as the base year. The flow of agriculture credit since 2004-05 has
consistently exceeded the target (Fig 3.4). Against a credit flow target of Rs.3, 25, 000
crore during 2009-10, the achievement was Rs.3, 84, 514 crore forming 118 percent of the
Farm Inputs and Management 75
target. The target for 2010-11 was Rs.3,75,000 crore while the achievement on March,
2011 is Rs.4,46,779 crore. The agriculture credit flow target for 2011-12 has been set at
Rs.4,75, 000 crore and the achievement as on 30 September 2011 is Rs. 2,23,380 crore.
Fig 3.4: Target and Achievement of Agricultural Credit from 2004-05 to 2011-12
3.72 Since Kharif 2006-07, farmers are receiving crop loans upto a principal amount of
Rs. 3 lakh at 7 percent rate of interest. During 2010-11, Government provided an additional
2 percent interest subvention as incentive to those farmers who repay short- term crop loans
as per schedule. The government has raised this subvention for timely repayment of crop
loans from 2 percent to 3 percent from the year 2011-12. Thus the effective rate of interest for
such farmers will be 4 percent in the year 2011-12.
3.73 Agricultural production and income from farming is highly risky on account of natural
disasters like droughts, floods, cyclones, uncertain rainfall, temperature variations, attack
of pests and diseases, fire, sale of spurious seeds, fertilizers and pesticides, and market
failures. With the growing commercialization of agriculture, the magnitude of risks and
loss is increasing. Agricultural insurance is a step to protect farmers by minimizing the
impact of such losses. But agricultural insurance has not made much headway in India as
yet.
3.74 Agricultural insurance is primarily covered under the National Agricultural Insurance
Scheme (NAIS) implemented by the Agricultural Insurance Company (AIC) of India Ltd.
This scheme is available to both loanees and non-loanees. During 2010-11, the Crop Insurance
Schemes covered about 25 percent farmers and crop area in the country. Further, there is a
heavy regional and crop bias in its coverage. Since the beginning of the scheme in 1999, till
the rabi season of 2010-11, 176 million farmers were extended insurance cover. Out of these,
15.90 percent were in Maharashtra, 14.20 percent in Andhra Pradesh, 12.5 percent in Madhya
Pradesh, 10.60 percent in Uttar Pradesh, 8.55 percent in Rajasthan, 6.5 percent in Orissa, 6.30
percent in Gujarat and 6.25 percent in Karnataka. These eight States accounted for 76 percent
76 State of Indian Agriculture
of the total insurance claims, and 80 percent of insured area under the NAIS. The private
sector has come out with financially viable insurance products in agriculture based on
weather parameters such as the weather index. One such product is the rainfall insurance
which has been developed by the ICICI- Lombard General Insurance Company and by the
IFFCO- Tokio General Insurance Company.
3.75 Efforts have been made to bring more farmers under the fold of Crop Insurance by
introducing a Weather-based Crop Insurance Scheme (WBCIS) from the Kharif, 2007 season
in selected areas on a pilot basis. WBCIS is intended to provide insurance protection to the
farmers against adverse weather incidence, such as deficit and excess rainfall, high or low
temperature, humidity, etc. which are deemed to impact adversely the crop production. It
has the advantage of settling the claims within the shortest possible time. Apart from
Agricultural Insurance Company (AIC) of India Ltd. the private insurance companies with
experience in rural insurance and possesing good infrastructure have been allowed to
undertake Pilot WBCIS. Since the Kharif 2007 season, 13 million farmers have been covered
under the Scheme.
3.76 A Joint Group was constituted to study the improvements required in the existing
crop insurance schemes and to develop broad parameters of an appropriate and farmer
friendly crop insurance scheme. The Group made an indepth study of crop insurance and
risk mitigation programmes and submitted its report in December, 2004. Based on the
recommendations of the Joint Group and views and comments of various stake-holders, a
Modified National Agricultural Insurance Scheme (MNAIS) has been approved by the
government of India for implementation on a pilot basis in 50 districts during the remaining
two years of the 11th five year plan from the Rabi 2010-11 season. It has improved features
over NAIS as for example: actuarial premium with subsidy in premium ranging from
40 percent to 75 percent offered to all farmers; only upfront premium subsidy being shared
by the central and state governments on a 50 : 50 basis; all claims liability to be on the
insurance companies; unit area of insurance reduced to village and village panchayat level
for major crops; indemnity for prevented sowing and planting risk & for post harvest losses
due to cyclone; on account payment up to 25 percent advance of likely claims as immediate
relief; more proficient basis for calculation of threshold yield; minimum indemnity level of
70 percent instead of 60 percent; underwriting by private insurance companies along with
AIC.
Challenges
3.77 Despite the increase in supply of institutional credit, its share in total credit for cultivator
household was only 61 percent in 2002. This shows that the cultivator households are not
able to come out of the clutches of money lenders and other non-institutional sources. It is
also reported that only 27 percent of the total number of cultivator households received
credit from formal sources while 22 percent dependent on informal sources. The remaining
households, comprising mainly small and marginal farmers, had no credit outstanding.
This calls for initiating measures to check the financial exclusion of large segment of small
and marginal farmers from the institutional financial system. Another issue with institutional
finance is that the flow of agricultural credit is skewed across states and regions. Even within
Farm Inputs and Management 77
states, there are sharp differences in credit flow to developed regions, regions with greater
access to physical infrastructure and regions closer to urban centres as compared to under-
developed districts or regions. Despite various agricultural insurance schemes launched
from time to time in the country, these have served in a limited way. The coverage in terms
of area, number of farmers and value of agricultural output is very small and most of the
schemes are yet to prove their viability.
The Way Forward
3.78 Comprehensive new measures are needed in terms of innovative products and services
to increase access to institutional credit. Complex documentation processes and high
transaction cost in taking loans require attention. It is highly desirable to provide a KCC to
all farmers in the country and to raise credit the limit, from time to time as needed.
CHAPTER 4
Agricultural Production and Programmes
4.1 Increasing agricultural production for achieving food security for all has been the central
focus of India’s agricultural development strategy since independence. Food security will
always remain a very sensitive issue in India as the country has the largest concentration of
poor in the world. Food security implies food as well as nutrition security. A food and
nutritional security scenario may be analyzed under four perspectives namely, food
availability, economic access, absorption and stability in food systems. Food production is
a direct mandate of the Ministry of Agriculture whereas providing economic access through
Public Distribution System (PDS) and stability in supply through provision of buffer stocks
is the direct mandate of Department of Food and Public Distribution. Absorption or provision
of nutrition through mid-day meals and Integrated Child Development Scheme (ICDS), etc
come within the purview of the Ministry of Women and Child Development and Ministry
of Health. After achieving near self sufficiency in staple food, the Indian government has
launched a number of programmes for increasing production (supply side) through the
Department of Agriculture and Cooperation as also distribution and consumption (demand
side) through the Department of Food and Public Distribution. Currently, around half of
India’s population is covered by one or other scheme of the public distribution system, in
which subsidized staple food is made available to the people.
4.2 Over the years, there have been significant dietary changes leading to diversification
in food towards fruit and vegetables (F&V), milk, meat, egg and fish. This diversified food
basket has led to more diversification at the farm level. India has made considerable headway
in improving food security at all levels. Economists have analyzed price inflation in terms
of primary food articles such as cereals, pulses, F&Vs, milk, meat, fish, spices etc., and
manufactured food articles like sugar, dairy products, vegetable oils, prepared food stuff
and other processed products. The fast growth in F&Vs, milk, meat, egg and fish have filled
the demand gap to some extent in these commodities. But in recent months, soaring prices
in these food articles have been a major concern of the government. Application of modern
agricultural technology combined with hard work by farmers and supportive policies and
special programmes of the government (popularly called green revolution) have provided
the much needed strength to minimize the adverse impact of rainfall and Indian agriculture
has attained some degree of resilience.
FoodSupply
4.3 Due to the challenge of feeding our vast population soon after independence and the
experience of food shortages in the pre-independence era, 'self reliance' in food grains has
been the cornerstone of our policies in the last 60 years. Food grains dominate the share of
total crop output though their relative share has decreased from 42 percent in TE 1990-1991
to 34 per cent in TE 2009-2010. India has made substantial progress in terms of overcoming
national food insecurity by giving priority to self-sufficiency in food grain production by
following an agricultural strategy well known by the name ‘green revolution’. As a result of
the new strategy, the food grain production increased from 82.02 million tonnes in 1960-61
to 250.42 million tonnes (2nd advance estimate) in 2011-12.
Agricultural Production and Programmes 79
4.4 The horticulture sector comprises of fruits, vegetables, potato, onion, other tuber crops,
ornamental crops, medicinal and aromatic crops, spices and plantation crops. New
enterprises like mushroom, bamboo and bee-keeping are added to further expand the scope
of horticulture. Horticulture has emerged as an indispensable part of agriculture, offering
a wide range of choices to the farmers for crop diversification and much needed nutrition to
the people. It also provides ample opportunities for sustaining a large number of agro-
industries which generate substantial employment opportunities. Changing dietary habits
of the Indian population with an improved standard of living has increased the demand for
horticultural products. Gross returns per unit of area from fruits, vegetables and flowers are
much higher than for most of the other crop groups. Growth in the horticulture sector has
facilitated crop diversification, even in small farmer holdings during the last decade. A
huge growth potential in horticulture has attracted corporate houses to venture into the
sector by developing innovative models, linking farm to fork. Livestock and fisheries are an
integrated part of the food supply system. These are discussed separately in Chapter 7.
Foodgrains
4.5 By the end of the Tenth Plan, India could achieve a total foodgrains production of 217.28
million tonnes. As a result of good monsoon performance for four consecutive years 2005-
06 to 2008-09 and focused promotional efforts backed by remunerative price policy support,
foodgrains production recorded an increasing trend touching a record level of 234.47 million
tonnes in 2008-09. In 2009-10, due to severe drought in various parts of the country, the total
foodgrains production sharply declined to 218.11 million tonnes. However, during 2010-
11, the food grain production has increased to 244.78 million tonnes and during 2011-12 it is
estimated at 250.42 million tonnes, an all time high so far. Krishi Karman awards were
given to the states (Box 4.1) in recognition of their meritorious work in achieving the record
production in 2010-11.
Box 4.1: Krishi Karman Awards
State Governments were recognized for the meritorious work in achieving their highest ever production
of foodgrains for the year 2010-11 through Krishi Karman Awards. These awards were instituted for the
first time by the Ministry of Agriculture in different categories – Total Foodgrains for big, medium and
small States, Wheat, Rice, Coarse Cereals and Pulses. They carried a cash award, trophy and a citation.
Following awards were presented on 16th July, 2011 by the Prime Minister of India
Krishi Karman Award for the total food grains production
Big State category – Punjab and Uttar Pradesh
Medium State Category – Orissa and Assam
Small State Category - Tripura
Krishi Karman Award for the Rice Crop - Chhattisgarh
Krishi Karman Award for the Wheat Crop - Haryana
Krishi Karman Award for the Pulses Crops – Maharashtra and Rajasthan
Krishi Karman Award for the Coarse cereals crops - Karnataka