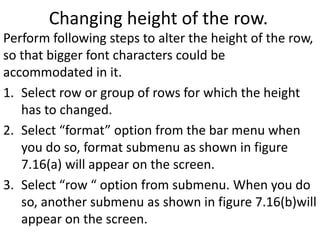
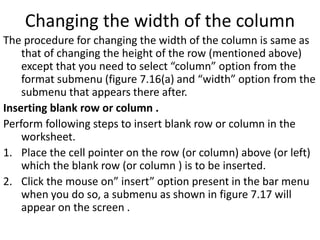
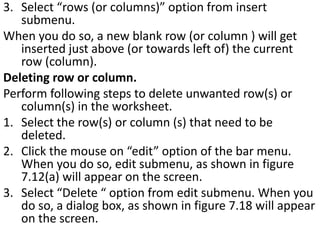
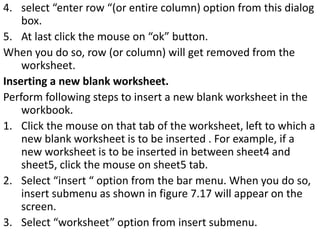
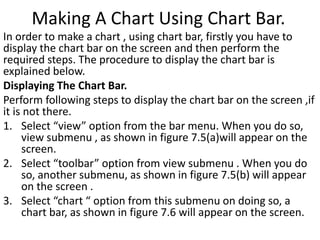
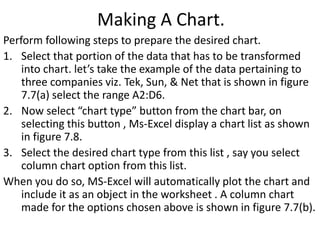
SlideShare a Scribd company logo
1 of 18
Lecture:Barkhad mohamed
omar{suldaan}
Book:-Introduction to Computer.
Faculty: ________________________
Lecture hours:2hrs
Before lecture quiz 10 minutes .
Changing height of the row.
Perform following steps to alter the height of the row,
so that bigger font characters could be
accommodated in it.
1. Select row or group of rows for which the height
has to changed.
2. Select “format” option from the bar menu when
you do so, format submenu as shown in figure
7.16(a) will appear on the screen.
3. Select “row “ option from submenu. When you do
so, another submenu as shown in figure 7.16(b)will
appear on the screen.
4. Select “height “ option from this submenu when
you do so, , a dialog box as shown in figure
7.16©will appear on the screen.
5. Now enter the desired height in “row height” text
box of this dialog box .
6. At last click the mouse “ok” button.
When you do so, the height of selected rows will
change.
Changing the width of the column
The procedure for changing the width of the column is same as
that of changing the height of the row (mentioned above)
except that you need to select “column” option from the
format submenu (figure 7.16(a) and “width” option from the
submenu that appears there after.
Inserting blank row or column .
Perform following steps to insert blank row or column in the
worksheet.
1. Place the cell pointer on the row (or column) above (or left)
which the blank row (or column ) is to be inserted.
2. Click the mouse on” insert” option present in the bar menu
when you do so, a submenu as shown in figure 7.17 will
appear on the screen .
3. Select “rows (or columns)” option from insert
submenu.
When you do so, a new blank row (or column ) will get
inserted just above (or towards left of) the current
row (column).
Deleting row or column.
Perform following steps to delete unwanted row(s) or
column(s) in the worksheet.
1. Select the row(s) or column (s) that need to be
deleted.
2. Click the mouse on “edit” option of the bar menu.
When you do so, edit submenu, as shown in figure
7.12(a) will appear on the screen.
3. Select “Delete “ option from edit submenu. When you
do so, a dialog box, as shown in figure 7.18 will appear
on the screen.
4. select “enter row “(or entire column) option from this dialog
box.
5. At last click the mouse on “ok” button.
When you do so, row (or column) will get removed from the
worksheet.
Inserting a new blank worksheet.
Perform following steps to insert a new blank worksheet in the
workbook.
1. Click the mouse on that tab of the worksheet, left to which a
new blank worksheet is to be inserted . For example, if a
new worksheet is to be inserted in between sheet4 and
sheet5, click the mouse on sheet5 tab.
2. Select “insert “ option from the bar menu. When you do so,
insert submenu as shown in figure 7.17 will appear on the
screen.
3. Select “worksheet” option from insert submenu.
When you do so, a blank worksheet will get inserted in
the workbook.
Renaming the worksheet.
Recall that the worksheets of the workbook are named as
sheet1, sheet1, sheet2,sheet3, etc perform following
steps to rename any worksheet.
1. Right click the mouse on that name (sheet tab) which
is to be changed for example, if fifth worksheet is to
be renamed, click the mouse on the tab named
sheet5. when you do so, a popup menu, as shown in
figure 7.19 will appear on the screen.
2. Select “rename “ option from this submenu . When
you do so, the sheet name will get highlighted.
3. Type the new name and press enter key.
When you do so, the name of the worksheet will change.
Deleting A worksheet.
Perform following steps to remove any worksheet from the
figure 7.19 workbook:
1. Select the worksheet, which is to be deleted by clicking the
mouse on its sheet tab for example if fifth worksheet is to be
deleted, click the mouse sheet5 tab.
2. Click the mouse on ”edit” option of the bar menu . When
you do so, edit submenu as shown in figure 7.12 (a) will
appear on the screen.
3. Select “delete sheet” option from edit submenu . When you
do so, an alert box, as shown in figure 7.20 will appear on
the screen.
4. Click the mouse on “ok” button.
When you do so, current worksheet will get removed from the
workbook.
MS-Excel Chart.
Introduction.
Representing data in the form of chart is one of the most
popular methods, which is used, for the purpose of data
analysis, excel provides many tools and facilities , using which
you can transform the data into charts, in this chapter we will
mainly deal with charting capabilities of MS-Excel .
1. Maximum sale has been made by the company NET, which
paid the lowest tax.
2. Highest expenditure has been made by the company sun,
which has paid the highest tax.
3. The company TEK has made a loss while the other
companies have incurred a profit.
What is chart ?
Chart is graphical representation of data, data values are
represented in terms of bars , lines, columns , pie, slice etc.
Chapter 7
No A B C D E
1
Sales and Expenditure figure.
2
3 TEK SUN NET
4 SALES 1000 15000 20000
5 EXPND 4000 8000 7000
6 TAX 2000 4000 1000
Introduction To MS-Excel Charts.
Excel supports 18 different types of charts to represent the data in
different forms different parts of the chart can also be labeled .
Which type of chart will suit best , for the given data will depend
upon what the data pertains to and what type of analysis is to be
done.
Before we go into the operational aspects of drawing the chart , let’s
first get introduced to different types of charts that can be generated
in MS-Excel.
Types of charts.
1. Area chart and 3-D- area chart.
2. Bar chart and 3-D –area chart .
3. Column chart and 3-D –columns chart.
4. Line chart and 3-D –line chart.
5. Pie chart and 3-D –pie chart.
6. Doughout chart and
7. Xy scatter chart.
Making A Chart Using Chart Bar.
In order to make a chart , using chart bar, firstly you have to
display the chart bar on the screen and then perform the
required steps. The procedure to display the chart bar is
explained below.
Displaying The Chart Bar.
Perform following steps to display the chart bar on the screen ,if
it is not there.
1. Select “view” option from the bar menu. When you do so,
view submenu , as shown in figure 7.5(a)will appear on the
screen.
2. Select “toolbar” option from view submenu . When you do
so, another submenu, as shown in figure 7.5(b) will appear
on the screen .
3. Select “chart “ option from this submenu on doing so, a
chart bar, as shown in figure 7.6 will appear on the screen.
Making A Chart.
Perform following steps to prepare the desired chart.
1. Select that portion of the data that has to be transformed
into chart. let’s take the example of the data pertaining to
three companies viz. Tek, Sun, & Net that is shown in figure
7.7(a) select the range A2:D6.
2. Now select “chart type” button from the chart bar, on
selecting this button , Ms-Excel display a chart list as shown
in figure 7.8.
3. Select the desired chart type from this list , say you select
column chart option from this list.
When you do so, MS-Excel will automatically plot the chart and
include it as an object in the worksheet . A column chart
made for the options chosen above is shown in figure 7.7(b).
Selecting Item in A Chart.
Perform following steps to select an item of the chart.
1. Select the chart by clicking the mouse on the chart.
2. Now click the mouse on the item that you want to select.
For example , if you wish to select the legend of the chart , first
select the chart by clicking the mouse on it and then click it
on the legend . When you click the mouse on the item it gets
surrounded with a border with handles , which indicates
that this components of the chart has been selected for
modification.
Cancelling The Selection.
To cancel the selection press Esc (escape) key or click the mouse
on any blank space of the worksheet.
Deleting A Chart.
To delete a chart , first select the chart and then press (Del) key
of the keyboard .
Moving The Chart.
To move the chart from one location to another ,
simply select the chart and drag the mouse to the
new location. As you drag the mouse , chart will also
move along with the mouse pointer , when you
release the mouse button the chart will get located at
new location .
Sizing The Chart.
To change the size of the chart (increase/decrease)
first select the chart and then place the mouse
pointer at any handle. The mouse pointer will change
to a double-headed arrow pointer. Now drag the
mouse , dragging the mouse will change the size of
the chart.
Changing The Title In The Chart.
Perform following steps to make changes in the title.
1. First select the title that needs to be altered.
2. Now select “chart” option from the bar menu . When you do
so, submenu , as shown in figure 7.10 will appear on the
screen.
3. Now select “chart option” option from this submenu . When
you do so , a dialog box , as shown in figure 7.11 will appear
on screen.
4. Click the mouse in “chart title “ text box and enter the title ,
if you wish to change the title of the chart . If you wish to
make changes in x axis title or y axis title select
corresponding text boxes and enter new title in the desired
text box .
5. At last , click the mouse on “ok” button .
When you do so, selected chart will get updated automatically.
Lecture 10: introduction to computer

More Related Content

What's hot

SAP2000 Piperack Tutorial 2010.pdf
SAP2000 Piperack Tutorial 2010.pdfSAP2000 Piperack Tutorial 2010.pdf
SAP2000 Piperack Tutorial 2010.pdfsdads1
 
Workbench tutorial airfoil
Workbench tutorial airfoilWorkbench tutorial airfoil
Workbench tutorial airfoilApriansyah Azis
 
Statistics Level 3
Statistics Level 3Statistics Level 3
Statistics Level 3Jacqui Sharp
 
Creating charts and graphics
Creating charts and graphicsCreating charts and graphics
Creating charts and graphicsum5ashm
 
Intro to AutoCAD
Intro to AutoCADIntro to AutoCAD
Intro to AutoCADDUSPviz
 
Spreadsheets Introduction using RM Number Magic
Spreadsheets Introduction using RM Number MagicSpreadsheets Introduction using RM Number Magic
Spreadsheets Introduction using RM Number MagicMalcolm Wilson
 
Workshop10 creep-jop
Workshop10 creep-jopWorkshop10 creep-jop
Workshop10 creep-jopmmd110
 
Gl13 m6-c4-presentation
Gl13 m6-c4-presentationGl13 m6-c4-presentation
Gl13 m6-c4-presentationTracie King
 
Data presentation and reporting cognos tm1
Data presentation and reporting cognos tm1Data presentation and reporting cognos tm1
Data presentation and reporting cognos tm1veeracynixit
 
Photoshop CS5 Tutorial
Photoshop CS5 TutorialPhotoshop CS5 Tutorial
Photoshop CS5 TutorialZaxapias
 
Excel 2003 tutorial 2
Excel 2003 tutorial 2Excel 2003 tutorial 2
Excel 2003 tutorial 2catacata1976
 
InDesign CS5 Tutorial
InDesign CS5 TutorialInDesign CS5 Tutorial
InDesign CS5 TutorialZaxapias
 
Excel 2007 create a chart
Excel 2007    create a chartExcel 2007    create a chart
Excel 2007 create a chartrezaulslide
 
Excel 2007 create a chart
Excel 2007    create a chartExcel 2007    create a chart
Excel 2007 create a chartkhankamrul
 
Creating graphs in excel
Creating graphs in excelCreating graphs in excel
Creating graphs in excelclynnc
 
Charts in excel 2007
Charts in excel 2007Charts in excel 2007
Charts in excel 2007bloftinsaisd
 

What's hot (20)

SAP2000 Piperack Tutorial 2010.pdf
SAP2000 Piperack Tutorial 2010.pdfSAP2000 Piperack Tutorial 2010.pdf
SAP2000 Piperack Tutorial 2010.pdf
 
Libre Office Calc Lesson 5: Working with Data
Libre Office Calc Lesson 5: Working with DataLibre Office Calc Lesson 5: Working with Data
Libre Office Calc Lesson 5: Working with Data
 
Workbench tutorial airfoil
Workbench tutorial airfoilWorkbench tutorial airfoil
Workbench tutorial airfoil
 
Statistics Level 3
Statistics Level 3Statistics Level 3
Statistics Level 3
 
Creating charts and graphics
Creating charts and graphicsCreating charts and graphics
Creating charts and graphics
 
Intro to AutoCAD
Intro to AutoCADIntro to AutoCAD
Intro to AutoCAD
 
Spreadsheets Introduction using RM Number Magic
Spreadsheets Introduction using RM Number MagicSpreadsheets Introduction using RM Number Magic
Spreadsheets Introduction using RM Number Magic
 
2 d autocad_2009
2 d autocad_20092 d autocad_2009
2 d autocad_2009
 
Workshop10 creep-jop
Workshop10 creep-jopWorkshop10 creep-jop
Workshop10 creep-jop
 
Gl13 m6-c4-presentation
Gl13 m6-c4-presentationGl13 m6-c4-presentation
Gl13 m6-c4-presentation
 
Data presentation and reporting cognos tm1
Data presentation and reporting cognos tm1Data presentation and reporting cognos tm1
Data presentation and reporting cognos tm1
 
3 d autocad_2009
3 d autocad_20093 d autocad_2009
3 d autocad_2009
 
Axis vm stepbystep
Axis vm stepbystepAxis vm stepbystep
Axis vm stepbystep
 
Photoshop CS5 Tutorial
Photoshop CS5 TutorialPhotoshop CS5 Tutorial
Photoshop CS5 Tutorial
 
Excel 2003 tutorial 2
Excel 2003 tutorial 2Excel 2003 tutorial 2
Excel 2003 tutorial 2
 
InDesign CS5 Tutorial
InDesign CS5 TutorialInDesign CS5 Tutorial
InDesign CS5 Tutorial
 
Excel 2007 create a chart
Excel 2007    create a chartExcel 2007    create a chart
Excel 2007 create a chart
 
Excel 2007 create a chart
Excel 2007    create a chartExcel 2007    create a chart
Excel 2007 create a chart
 
Creating graphs in excel
Creating graphs in excelCreating graphs in excel
Creating graphs in excel
 
Charts in excel 2007
Charts in excel 2007Charts in excel 2007
Charts in excel 2007
 

Similar to Lecture 10: introduction to computer

Making a Chart Using Excel
Making a Chart Using ExcelMaking a Chart Using Excel
Making a Chart Using Excelrebelbrindley
 
Module 6 component of excel chart
Module 6 component of excel chartModule 6 component of excel chart
Module 6 component of excel chartDr. Shalini Pandey
 
Introduction to Excel
Introduction to ExcelIntroduction to Excel
Introduction to ExcelNajma Alam
 
Excel Graphs Charts
Excel Graphs ChartsExcel Graphs Charts
Excel Graphs Chartssimply_coool
 
Sample Training Ppt Excel Basics
Sample Training Ppt Excel BasicsSample Training Ppt Excel Basics
Sample Training Ppt Excel BasicsAudreyMc
 
Pivot-Table-Handout1-projectcubicle lecture notes
Pivot-Table-Handout1-projectcubicle lecture notesPivot-Table-Handout1-projectcubicle lecture notes
Pivot-Table-Handout1-projectcubicle lecture notesProject Cubicle
 
How to make Gantt chart in Excel
How to make Gantt chart in ExcelHow to make Gantt chart in Excel
How to make Gantt chart in ExcelNavjyotsinh Jadeja
 
Lesson 11 working with charts
Lesson 11   working with chartsLesson 11   working with charts
Lesson 11 working with chartsguevarra_2000
 
Lesson 10 working with charts
Lesson 10   working with chartsLesson 10   working with charts
Lesson 10 working with chartsguevarra_2000
 
1 Mashing Up Data with PowerPivot When Filter, .docx
1 Mashing Up Data with PowerPivot  When Filter, .docx1 Mashing Up Data with PowerPivot  When Filter, .docx
1 Mashing Up Data with PowerPivot When Filter, .docxkarisariddell
 
Pivot tableinfo
Pivot tableinfoPivot tableinfo
Pivot tableinfoKA25EE855
 
Lecture 9: introduction to computer
Lecture 9: introduction to computerLecture 9: introduction to computer
Lecture 9: introduction to computerSultan Omar Shige
 

Similar to Lecture 10: introduction to computer (20)

Microsoft excel part 2
Microsoft excel part 2Microsoft excel part 2
Microsoft excel part 2
 
Making a Chart Using Excel
Making a Chart Using ExcelMaking a Chart Using Excel
Making a Chart Using Excel
 
Advanced excel
Advanced excelAdvanced excel
Advanced excel
 
Module 6 component of excel chart
Module 6 component of excel chartModule 6 component of excel chart
Module 6 component of excel chart
 
Introduction to Excel
Introduction to ExcelIntroduction to Excel
Introduction to Excel
 
excell.pdf
excell.pdfexcell.pdf
excell.pdf
 
ms_excel.pdf
ms_excel.pdfms_excel.pdf
ms_excel.pdf
 
Microsoft Excel Tutorial
Microsoft Excel TutorialMicrosoft Excel Tutorial
Microsoft Excel Tutorial
 
Excel Graphs Charts
Excel Graphs ChartsExcel Graphs Charts
Excel Graphs Charts
 
Sample Training Ppt Excel Basics
Sample Training Ppt Excel BasicsSample Training Ppt Excel Basics
Sample Training Ppt Excel Basics
 
Pivot-Table-Handout1-projectcubicle lecture notes
Pivot-Table-Handout1-projectcubicle lecture notesPivot-Table-Handout1-projectcubicle lecture notes
Pivot-Table-Handout1-projectcubicle lecture notes
 
How to make Gantt chart in Excel
How to make Gantt chart in ExcelHow to make Gantt chart in Excel
How to make Gantt chart in Excel
 
Lesson 11 working with charts
Lesson 11   working with chartsLesson 11   working with charts
Lesson 11 working with charts
 
Lesson 10 working with charts
Lesson 10   working with chartsLesson 10   working with charts
Lesson 10 working with charts
 
1 Mashing Up Data with PowerPivot When Filter, .docx
1 Mashing Up Data with PowerPivot  When Filter, .docx1 Mashing Up Data with PowerPivot  When Filter, .docx
1 Mashing Up Data with PowerPivot When Filter, .docx
 
Excel training create a chart
Excel training create a chartExcel training create a chart
Excel training create a chart
 
Excel 2007 - Create a chart
Excel 2007 - Create a chartExcel 2007 - Create a chart
Excel 2007 - Create a chart
 
Pivot tableinfo
Pivot tableinfoPivot tableinfo
Pivot tableinfo
 
Tech training workshop 3 final 090810
Tech training   workshop 3 final 090810Tech training   workshop 3 final 090810
Tech training workshop 3 final 090810
 
Lecture 9: introduction to computer
Lecture 9: introduction to computerLecture 9: introduction to computer
Lecture 9: introduction to computer
 

More from Sultan Omar Shige

Lecture 7: introduction to computer
Lecture 7: introduction to computerLecture 7: introduction to computer
Lecture 7: introduction to computerSultan Omar Shige
 
Lecture 6: introduction to computer
Lecture 6: introduction to computerLecture 6: introduction to computer
Lecture 6: introduction to computerSultan Omar Shige
 
Lecture 5 introduction to computer
Lecture 5 introduction to computerLecture 5 introduction to computer
Lecture 5 introduction to computerSultan Omar Shige
 
Lecture 4 introduction to computer
Lecture 4 introduction to computerLecture 4 introduction to computer
Lecture 4 introduction to computerSultan Omar Shige
 
Lecture 3 INTRODUCTION TO COMPUTER
Lecture 3 INTRODUCTION TO COMPUTERLecture 3 INTRODUCTION TO COMPUTER
Lecture 3 INTRODUCTION TO COMPUTERSultan Omar Shige
 
Lecture 2 introduction to computer
Lecture 2 introduction to computerLecture 2 introduction to computer
Lecture 2 introduction to computerSultan Omar Shige
 
Lecture 1 :introduction to computer
Lecture 1 :introduction to computerLecture 1 :introduction to computer
Lecture 1 :introduction to computerSultan Omar Shige
 

More from Sultan Omar Shige (8)

Lecture 7: introduction to computer
Lecture 7: introduction to computerLecture 7: introduction to computer
Lecture 7: introduction to computer
 
Lecture 6: introduction to computer
Lecture 6: introduction to computerLecture 6: introduction to computer
Lecture 6: introduction to computer
 
Lecture 5 introduction to computer
Lecture 5 introduction to computerLecture 5 introduction to computer
Lecture 5 introduction to computer
 
Lecture 4 introduction to computer
Lecture 4 introduction to computerLecture 4 introduction to computer
Lecture 4 introduction to computer
 
Lecture 3 INTRODUCTION TO COMPUTER
Lecture 3 INTRODUCTION TO COMPUTERLecture 3 INTRODUCTION TO COMPUTER
Lecture 3 INTRODUCTION TO COMPUTER
 
Lecture 2 introduction to computer
Lecture 2 introduction to computerLecture 2 introduction to computer
Lecture 2 introduction to computer
 
Lecture 4 telecommunication
Lecture 4 telecommunicationLecture 4 telecommunication
Lecture 4 telecommunication
 
Lecture 1 :introduction to computer
Lecture 1 :introduction to computerLecture 1 :introduction to computer
Lecture 1 :introduction to computer
 

Recently uploaded

Azure Monitor & Application Insight to monitor Infrastructure & Application
Azure Monitor & Application Insight to monitor Infrastructure & ApplicationAzure Monitor & Application Insight to monitor Infrastructure & Application
Azure Monitor & Application Insight to monitor Infrastructure & ApplicationAndikSusilo4
 
The Codex of Business Writing Software for Real-World Solutions 2.pptx
The Codex of Business Writing Software for Real-World Solutions 2.pptxThe Codex of Business Writing Software for Real-World Solutions 2.pptx
The Codex of Business Writing Software for Real-World Solutions 2.pptxMalak Abu Hammad
 
Presentation on how to chat with PDF using ChatGPT code interpreter
Presentation on how to chat with PDF using ChatGPT code interpreterPresentation on how to chat with PDF using ChatGPT code interpreter
Presentation on how to chat with PDF using ChatGPT code interpreternaman860154
 
The 7 Things I Know About Cyber Security After 25 Years | April 2024
The 7 Things I Know About Cyber Security After 25 Years | April 2024The 7 Things I Know About Cyber Security After 25 Years | April 2024
The 7 Things I Know About Cyber Security After 25 Years | April 2024Rafal Los
 
FULL ENJOY 🔝 8264348440 🔝 Call Girls in Diplomatic Enclave | Delhi
FULL ENJOY 🔝 8264348440 🔝 Call Girls in Diplomatic Enclave | DelhiFULL ENJOY 🔝 8264348440 🔝 Call Girls in Diplomatic Enclave | Delhi
FULL ENJOY 🔝 8264348440 🔝 Call Girls in Diplomatic Enclave | Delhisoniya singh
 
Human Factors of XR: Using Human Factors to Design XR Systems
Human Factors of XR: Using Human Factors to Design XR SystemsHuman Factors of XR: Using Human Factors to Design XR Systems
Human Factors of XR: Using Human Factors to Design XR SystemsMark Billinghurst
 
[2024]Digital Global Overview Report 2024 Meltwater.pdf
[2024]Digital Global Overview Report 2024 Meltwater.pdf[2024]Digital Global Overview Report 2024 Meltwater.pdf
[2024]Digital Global Overview Report 2024 Meltwater.pdfhans926745
 
Pigging Solutions in Pet Food Manufacturing
Pigging Solutions in Pet Food ManufacturingPigging Solutions in Pet Food Manufacturing
Pigging Solutions in Pet Food ManufacturingPigging Solutions
 
Install Stable Diffusion in windows machine
Install Stable Diffusion in windows machineInstall Stable Diffusion in windows machine
Install Stable Diffusion in windows machinePadma Pradeep
 
Swan(sea) Song – personal research during my six years at Swansea ... and bey...
Swan(sea) Song – personal research during my six years at Swansea ... and bey...Swan(sea) Song – personal research during my six years at Swansea ... and bey...
Swan(sea) Song – personal research during my six years at Swansea ... and bey...Alan Dix
 
08448380779 Call Girls In Friends Colony Women Seeking Men
08448380779 Call Girls In Friends Colony Women Seeking Men08448380779 Call Girls In Friends Colony Women Seeking Men
08448380779 Call Girls In Friends Colony Women Seeking MenDelhi Call girls
 
04-2024-HHUG-Sales-and-Marketing-Alignment.pptx
04-2024-HHUG-Sales-and-Marketing-Alignment.pptx04-2024-HHUG-Sales-and-Marketing-Alignment.pptx
04-2024-HHUG-Sales-and-Marketing-Alignment.pptxHampshireHUG
 
Salesforce Community Group Quito, Salesforce 101
Salesforce Community Group Quito, Salesforce 101Salesforce Community Group Quito, Salesforce 101
Salesforce Community Group Quito, Salesforce 101Paola De la Torre
 
A Domino Admins Adventures (Engage 2024)
A Domino Admins Adventures (Engage 2024)A Domino Admins Adventures (Engage 2024)
A Domino Admins Adventures (Engage 2024)Gabriella Davis
 
Beyond Boundaries: Leveraging No-Code Solutions for Industry Innovation
Beyond Boundaries: Leveraging No-Code Solutions for Industry InnovationBeyond Boundaries: Leveraging No-Code Solutions for Industry Innovation
Beyond Boundaries: Leveraging No-Code Solutions for Industry InnovationSafe Software
 
Tech-Forward - Achieving Business Readiness For Copilot in Microsoft 365
Tech-Forward - Achieving Business Readiness For Copilot in Microsoft 365Tech-Forward - Achieving Business Readiness For Copilot in Microsoft 365
Tech-Forward - Achieving Business Readiness For Copilot in Microsoft 3652toLead Limited
 
My Hashitalk Indonesia April 2024 Presentation
My Hashitalk Indonesia April 2024 PresentationMy Hashitalk Indonesia April 2024 Presentation
My Hashitalk Indonesia April 2024 PresentationRidwan Fadjar
 
Unblocking The Main Thread Solving ANRs and Frozen Frames
Unblocking The Main Thread Solving ANRs and Frozen FramesUnblocking The Main Thread Solving ANRs and Frozen Frames
Unblocking The Main Thread Solving ANRs and Frozen FramesSinan KOZAK
 
How to Troubleshoot Apps for the Modern Connected Worker
How to Troubleshoot Apps for the Modern Connected WorkerHow to Troubleshoot Apps for the Modern Connected Worker
How to Troubleshoot Apps for the Modern Connected WorkerThousandEyes
 
Automating Business Process via MuleSoft Composer | Bangalore MuleSoft Meetup...
Automating Business Process via MuleSoft Composer | Bangalore MuleSoft Meetup...Automating Business Process via MuleSoft Composer | Bangalore MuleSoft Meetup...
Automating Business Process via MuleSoft Composer | Bangalore MuleSoft Meetup...shyamraj55
 

Recently uploaded (20)

Azure Monitor & Application Insight to monitor Infrastructure & Application
Azure Monitor & Application Insight to monitor Infrastructure & ApplicationAzure Monitor & Application Insight to monitor Infrastructure & Application
Azure Monitor & Application Insight to monitor Infrastructure & Application
 
The Codex of Business Writing Software for Real-World Solutions 2.pptx
The Codex of Business Writing Software for Real-World Solutions 2.pptxThe Codex of Business Writing Software for Real-World Solutions 2.pptx
The Codex of Business Writing Software for Real-World Solutions 2.pptx
 
Presentation on how to chat with PDF using ChatGPT code interpreter
Presentation on how to chat with PDF using ChatGPT code interpreterPresentation on how to chat with PDF using ChatGPT code interpreter
Presentation on how to chat with PDF using ChatGPT code interpreter
 
The 7 Things I Know About Cyber Security After 25 Years | April 2024
The 7 Things I Know About Cyber Security After 25 Years | April 2024The 7 Things I Know About Cyber Security After 25 Years | April 2024
The 7 Things I Know About Cyber Security After 25 Years | April 2024
 
FULL ENJOY 🔝 8264348440 🔝 Call Girls in Diplomatic Enclave | Delhi
FULL ENJOY 🔝 8264348440 🔝 Call Girls in Diplomatic Enclave | DelhiFULL ENJOY 🔝 8264348440 🔝 Call Girls in Diplomatic Enclave | Delhi
FULL ENJOY 🔝 8264348440 🔝 Call Girls in Diplomatic Enclave | Delhi
 
Human Factors of XR: Using Human Factors to Design XR Systems
Human Factors of XR: Using Human Factors to Design XR SystemsHuman Factors of XR: Using Human Factors to Design XR Systems
Human Factors of XR: Using Human Factors to Design XR Systems
 
[2024]Digital Global Overview Report 2024 Meltwater.pdf
[2024]Digital Global Overview Report 2024 Meltwater.pdf[2024]Digital Global Overview Report 2024 Meltwater.pdf
[2024]Digital Global Overview Report 2024 Meltwater.pdf
 
Pigging Solutions in Pet Food Manufacturing
Pigging Solutions in Pet Food ManufacturingPigging Solutions in Pet Food Manufacturing
Pigging Solutions in Pet Food Manufacturing
 
Install Stable Diffusion in windows machine
Install Stable Diffusion in windows machineInstall Stable Diffusion in windows machine
Install Stable Diffusion in windows machine
 
Swan(sea) Song – personal research during my six years at Swansea ... and bey...
Swan(sea) Song – personal research during my six years at Swansea ... and bey...Swan(sea) Song – personal research during my six years at Swansea ... and bey...
Swan(sea) Song – personal research during my six years at Swansea ... and bey...
 
08448380779 Call Girls In Friends Colony Women Seeking Men
08448380779 Call Girls In Friends Colony Women Seeking Men08448380779 Call Girls In Friends Colony Women Seeking Men
08448380779 Call Girls In Friends Colony Women Seeking Men
 
04-2024-HHUG-Sales-and-Marketing-Alignment.pptx
04-2024-HHUG-Sales-and-Marketing-Alignment.pptx04-2024-HHUG-Sales-and-Marketing-Alignment.pptx
04-2024-HHUG-Sales-and-Marketing-Alignment.pptx
 
Salesforce Community Group Quito, Salesforce 101
Salesforce Community Group Quito, Salesforce 101Salesforce Community Group Quito, Salesforce 101
Salesforce Community Group Quito, Salesforce 101
 
A Domino Admins Adventures (Engage 2024)
A Domino Admins Adventures (Engage 2024)A Domino Admins Adventures (Engage 2024)
A Domino Admins Adventures (Engage 2024)
 
Beyond Boundaries: Leveraging No-Code Solutions for Industry Innovation
Beyond Boundaries: Leveraging No-Code Solutions for Industry InnovationBeyond Boundaries: Leveraging No-Code Solutions for Industry Innovation
Beyond Boundaries: Leveraging No-Code Solutions for Industry Innovation
 
Tech-Forward - Achieving Business Readiness For Copilot in Microsoft 365
Tech-Forward - Achieving Business Readiness For Copilot in Microsoft 365Tech-Forward - Achieving Business Readiness For Copilot in Microsoft 365
Tech-Forward - Achieving Business Readiness For Copilot in Microsoft 365
 
My Hashitalk Indonesia April 2024 Presentation
My Hashitalk Indonesia April 2024 PresentationMy Hashitalk Indonesia April 2024 Presentation
My Hashitalk Indonesia April 2024 Presentation
 
Unblocking The Main Thread Solving ANRs and Frozen Frames
Unblocking The Main Thread Solving ANRs and Frozen FramesUnblocking The Main Thread Solving ANRs and Frozen Frames
Unblocking The Main Thread Solving ANRs and Frozen Frames
 
How to Troubleshoot Apps for the Modern Connected Worker
How to Troubleshoot Apps for the Modern Connected WorkerHow to Troubleshoot Apps for the Modern Connected Worker
How to Troubleshoot Apps for the Modern Connected Worker
 
Automating Business Process via MuleSoft Composer | Bangalore MuleSoft Meetup...
Automating Business Process via MuleSoft Composer | Bangalore MuleSoft Meetup...Automating Business Process via MuleSoft Composer | Bangalore MuleSoft Meetup...
Automating Business Process via MuleSoft Composer | Bangalore MuleSoft Meetup...
 

Lecture 10: introduction to computer

  • 1. Lecture:Barkhad mohamed omar{suldaan} Book:-Introduction to Computer. Faculty: ________________________ Lecture hours:2hrs Before lecture quiz 10 minutes .
  • 2. Changing height of the row. Perform following steps to alter the height of the row, so that bigger font characters could be accommodated in it. 1. Select row or group of rows for which the height has to changed. 2. Select “format” option from the bar menu when you do so, format submenu as shown in figure 7.16(a) will appear on the screen. 3. Select “row “ option from submenu. When you do so, another submenu as shown in figure 7.16(b)will appear on the screen.
  • 3. 4. Select “height “ option from this submenu when you do so, , a dialog box as shown in figure 7.16©will appear on the screen. 5. Now enter the desired height in “row height” text box of this dialog box . 6. At last click the mouse “ok” button. When you do so, the height of selected rows will change.
  • 4. Changing the width of the column The procedure for changing the width of the column is same as that of changing the height of the row (mentioned above) except that you need to select “column” option from the format submenu (figure 7.16(a) and “width” option from the submenu that appears there after. Inserting blank row or column . Perform following steps to insert blank row or column in the worksheet. 1. Place the cell pointer on the row (or column) above (or left) which the blank row (or column ) is to be inserted. 2. Click the mouse on” insert” option present in the bar menu when you do so, a submenu as shown in figure 7.17 will appear on the screen .
  • 5. 3. Select “rows (or columns)” option from insert submenu. When you do so, a new blank row (or column ) will get inserted just above (or towards left of) the current row (column). Deleting row or column. Perform following steps to delete unwanted row(s) or column(s) in the worksheet. 1. Select the row(s) or column (s) that need to be deleted. 2. Click the mouse on “edit” option of the bar menu. When you do so, edit submenu, as shown in figure 7.12(a) will appear on the screen. 3. Select “Delete “ option from edit submenu. When you do so, a dialog box, as shown in figure 7.18 will appear on the screen.
  • 6. 4. select “enter row “(or entire column) option from this dialog box. 5. At last click the mouse on “ok” button. When you do so, row (or column) will get removed from the worksheet. Inserting a new blank worksheet. Perform following steps to insert a new blank worksheet in the workbook. 1. Click the mouse on that tab of the worksheet, left to which a new blank worksheet is to be inserted . For example, if a new worksheet is to be inserted in between sheet4 and sheet5, click the mouse on sheet5 tab. 2. Select “insert “ option from the bar menu. When you do so, insert submenu as shown in figure 7.17 will appear on the screen. 3. Select “worksheet” option from insert submenu.
  • 7. When you do so, a blank worksheet will get inserted in the workbook. Renaming the worksheet. Recall that the worksheets of the workbook are named as sheet1, sheet1, sheet2,sheet3, etc perform following steps to rename any worksheet. 1. Right click the mouse on that name (sheet tab) which is to be changed for example, if fifth worksheet is to be renamed, click the mouse on the tab named sheet5. when you do so, a popup menu, as shown in figure 7.19 will appear on the screen. 2. Select “rename “ option from this submenu . When you do so, the sheet name will get highlighted. 3. Type the new name and press enter key. When you do so, the name of the worksheet will change.
  • 8. Deleting A worksheet. Perform following steps to remove any worksheet from the figure 7.19 workbook: 1. Select the worksheet, which is to be deleted by clicking the mouse on its sheet tab for example if fifth worksheet is to be deleted, click the mouse sheet5 tab. 2. Click the mouse on ”edit” option of the bar menu . When you do so, edit submenu as shown in figure 7.12 (a) will appear on the screen. 3. Select “delete sheet” option from edit submenu . When you do so, an alert box, as shown in figure 7.20 will appear on the screen. 4. Click the mouse on “ok” button. When you do so, current worksheet will get removed from the workbook.
  • 9. MS-Excel Chart. Introduction. Representing data in the form of chart is one of the most popular methods, which is used, for the purpose of data analysis, excel provides many tools and facilities , using which you can transform the data into charts, in this chapter we will mainly deal with charting capabilities of MS-Excel . 1. Maximum sale has been made by the company NET, which paid the lowest tax. 2. Highest expenditure has been made by the company sun, which has paid the highest tax. 3. The company TEK has made a loss while the other companies have incurred a profit. What is chart ? Chart is graphical representation of data, data values are represented in terms of bars , lines, columns , pie, slice etc. Chapter 7
  • 10. No A B C D E 1 Sales and Expenditure figure. 2 3 TEK SUN NET 4 SALES 1000 15000 20000 5 EXPND 4000 8000 7000 6 TAX 2000 4000 1000
  • 11. Introduction To MS-Excel Charts. Excel supports 18 different types of charts to represent the data in different forms different parts of the chart can also be labeled . Which type of chart will suit best , for the given data will depend upon what the data pertains to and what type of analysis is to be done. Before we go into the operational aspects of drawing the chart , let’s first get introduced to different types of charts that can be generated in MS-Excel. Types of charts. 1. Area chart and 3-D- area chart. 2. Bar chart and 3-D –area chart . 3. Column chart and 3-D –columns chart. 4. Line chart and 3-D –line chart. 5. Pie chart and 3-D –pie chart. 6. Doughout chart and 7. Xy scatter chart.
  • 12.
  • 13. Making A Chart Using Chart Bar. In order to make a chart , using chart bar, firstly you have to display the chart bar on the screen and then perform the required steps. The procedure to display the chart bar is explained below. Displaying The Chart Bar. Perform following steps to display the chart bar on the screen ,if it is not there. 1. Select “view” option from the bar menu. When you do so, view submenu , as shown in figure 7.5(a)will appear on the screen. 2. Select “toolbar” option from view submenu . When you do so, another submenu, as shown in figure 7.5(b) will appear on the screen . 3. Select “chart “ option from this submenu on doing so, a chart bar, as shown in figure 7.6 will appear on the screen.
  • 14. Making A Chart. Perform following steps to prepare the desired chart. 1. Select that portion of the data that has to be transformed into chart. let’s take the example of the data pertaining to three companies viz. Tek, Sun, & Net that is shown in figure 7.7(a) select the range A2:D6. 2. Now select “chart type” button from the chart bar, on selecting this button , Ms-Excel display a chart list as shown in figure 7.8. 3. Select the desired chart type from this list , say you select column chart option from this list. When you do so, MS-Excel will automatically plot the chart and include it as an object in the worksheet . A column chart made for the options chosen above is shown in figure 7.7(b).
  • 15. Selecting Item in A Chart. Perform following steps to select an item of the chart. 1. Select the chart by clicking the mouse on the chart. 2. Now click the mouse on the item that you want to select. For example , if you wish to select the legend of the chart , first select the chart by clicking the mouse on it and then click it on the legend . When you click the mouse on the item it gets surrounded with a border with handles , which indicates that this components of the chart has been selected for modification. Cancelling The Selection. To cancel the selection press Esc (escape) key or click the mouse on any blank space of the worksheet. Deleting A Chart. To delete a chart , first select the chart and then press (Del) key of the keyboard .
  • 16. Moving The Chart. To move the chart from one location to another , simply select the chart and drag the mouse to the new location. As you drag the mouse , chart will also move along with the mouse pointer , when you release the mouse button the chart will get located at new location . Sizing The Chart. To change the size of the chart (increase/decrease) first select the chart and then place the mouse pointer at any handle. The mouse pointer will change to a double-headed arrow pointer. Now drag the mouse , dragging the mouse will change the size of the chart.
  • 17. Changing The Title In The Chart. Perform following steps to make changes in the title. 1. First select the title that needs to be altered. 2. Now select “chart” option from the bar menu . When you do so, submenu , as shown in figure 7.10 will appear on the screen. 3. Now select “chart option” option from this submenu . When you do so , a dialog box , as shown in figure 7.11 will appear on screen. 4. Click the mouse in “chart title “ text box and enter the title , if you wish to change the title of the chart . If you wish to make changes in x axis title or y axis title select corresponding text boxes and enter new title in the desired text box . 5. At last , click the mouse on “ok” button . When you do so, selected chart will get updated automatically.