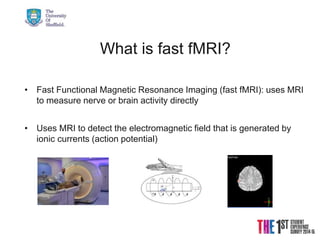
Advanced
functional MRI
(Fast fMRI)
Shwan Kaka
Medical School Department of
Cardiovascular Science
21/08/2015 © The University of Sheffield
Outline I
• Introduction (CH1)
• Fast fMRI vs. BOLD technique
• Biological basis
• Methodology (CH2)
• Phantom Study (CH3)
1- Axon phantom
2- Conductive Gel Phantom
3- NaCl Solution phantom
21/08/2015 © The University of Sheffield
Outline II
• Subject studies
1- Rapid functional MRI measurements of the wrist using TENS
stimulation of the median nerve (CH4)
2- Visual stimulation – a comparison of direct detection fast
fMRI with the BOLD technique (CH5)
3- Rapid functional MRI measurements of the thalamus and
motor-sensory cortex using stimulation of the median nerve. In addition,
real and imaginary finger tapping (CH6)
• Conclusion and future work (CH7)
21/08/2015 © The University of Sheffield
What is fast fMRI?
• Fast Functional Magnetic Resonance Imaging (fast fMRI): uses MRI
to measure nerve or brain activity directly
• Uses MRI to detect the electromagnetic field that is generated by
ionic currents (action potential)
21/08/2015 © The University of Sheffield
Why use fast fMRI?
• Provide excellent temporal resolution of
neuronal population dynamics as well as
capabilities for source localization
• To better understand brain and nerve function in
animals and humans
21/08/2015 © The University of Sheffield
Biological basis
Source: fMRIB Introduction to fMRI
Fast fMRI BOLD fMRI
21/08/2015 © The University of Sheffield
Fast fMRI
• Dependent on transient ionic
currents
• Active-population of firing action
potentials
• Electromagnetic field generated
by ionic currents
• Differences in magnitude and
phase distribution can be
measured (T2*)
• Dependent on the Blood Oxygen
Level Dependent signal
• Active-increased in oxyhemoglobin:
deoxyhemoglobin
• Diamagnetic vs. Paramagnetic
• Differences in magnetic susceptibility
can be measured (T2*)
BOLD fMRI
21/08/2015 © The University of Sheffield
Volunteer studies - methodology
Subject preparation
• All volunteer experiments were performed in accordance with local
ethical committee guidelines and approval. (12 volunteers) .
MRI data acquisition
• fMRI data were acquired with a 1.5 Tesla MR Scanner using an 8
channel array wrist and head coil with the following EPI
imaging parameters; TR/TE=88/25 ms, flip angle=90o, acquisition
matrix=64x64, FOV =240mm, slice thickness=5mm and 3.75 mm in-
plane resolution with 500 dynamic scans
21/08/2015 © The University of Sheffield
• TENS (transcutaneous electrical nerve stimulation)
The median nerve and somatosensory cortex were activated using a
voltage ~80V applied to the palm of the hand.
• Strobe light
The visual cortex was activated using a flashing light (QTX 20W
Mini) located outside the magnet room.
• These areas were stimulated with high frequencies > 2.5 Hz
Stimulation presentation
21/08/2015 © The University of Sheffield21/08/2015
© The University of Sheffield
Data Analysis
• The fMRI data was analysed using MATLAB 6.5 software
programs.
21/08/2015
Volunteer studies
Reference Control Experiments.
• Each subject was tested with a control scan without stimulation prior to
the stimulation experiments.
• The control experiments showed spectral peaks due to heart beat and
respiration only.
• No specific frequency responses were recorded at the stimulation
frequency from the median nerve, somatosensory cortex or visual cortex
in the control experiments.
Figures for fast fMRI Fourier transform of MR time series of the median nerve, the motosensory and the
visual cortex at rest state (control experiments)
21/08/2015
• ROI’s were selected in the median nerve
and in muscle tissue, Figs 2 and 3.
• Fig 4. shows a typical response at 2.8
Hz recorded from the ROI in the median nerve
(blue) but not from muscle tissue (red).
1- Responses in the Median Nerve
Median nerve
1 MR image shows an axial slice position in the
sagittal plane scout image
2 Anatomy MR Image 3 GE-EPI magnitude image in axial plane
during the ROI stimulated at 2.8Hz, with Z=2.5
A.U
f (Hz)
4 FT of MR time series 2.8Hz
Stimulation
frequency
21/08/2015
3- Possible fast fMRI responses in the visual cortex
1 MR image shows an axial slice position in the
sagittal plane scout image
2 Functional overlay on MR Image ,
with Z=2.5
3 GE-EPI magnitude image in axial plane
showing the ROI stimulated at 2.8Hz
4 FTof MR time series 2.8Hz
•Fig. 2 shows a typical response on the overlay image from an
acquisition calculated with a Z score = 2.5.
•A typical ROI selected in the visual cortex is shown in Figure
3.
•Fig. 4 shows a Fourier transform of the MR time series
illustrating the frequency spectrum from the ROI in the visual
cortex during visual stimulation at 2.8Hz which correlates with
the task stimulation frequency.
21/08/2015
2- mapping of motor sensory cortex function
1 MR image shows an axial slice position in the
sagittal plane scout image
2 Function overlay MR Image, with Z=2.5 3 GE-EPI magnitude image in axial plane
during the ROI stimulated at 2.7Hz.
A.U
f (Hz)
4 FT of MR time series 2.7Hz
•Figure 2 shows a Z map (Z>2.5) overlaid on the EPI
image showing response in the motor-sensory area.
•This location was selected in the motor cortex as shown
in the ROI in figure 3 using the axial plane for
acquisition.
•Figure 4 shows the spectral response from the motor-
sensory area at 2.7 Hz with SNR>3:1. and the heartbeat
at approximately 1.1 Hz.
Stimulation
frequency
21/08/2015
Conclusions
• Evidence of fast fMRI responses in the median nerve, the
somatosensory and visual cortices during ROI area stimulation by TENS
and strobe light were observed at high stimulation frequencies > 2.5 Hz.
• Similar responses were observed at the applied stimulation frequencies
with SNR>3:1 in volunteers for the median nerve, the somatosensory
and visual cortices respectively.
• Fast fMRI did appear to detect weak response to the stimulated
frequencies and seeks to improve the spatial and temporal accuracy in
detecting neuronal function compared to conventional BOLD fMRI.
21/08/2015
Acknowledgements
I gratefully acknowledge the sponsorship of the
Human Capacity Development Program in
Kurdistan Regional Government.
I take this opportunity to express my gratitude and regards to
Professor Martyn Paley/ Academic Radiology/ Department of
Cardiovascular Science for his exemplary guidance, monitoring
and constant encouragement throughout the course of this
study
Prof. Martyn Paley
Thank you very much to the
volunteers who participated in the
experiments we have carried out
under ethical permission from the
University.

Advance fMRI (Fast fMRI)

  • 1.
    Advanced functional MRI (Fast fMRI) ShwanKaka Medical School Department of Cardiovascular Science
  • 2.
    21/08/2015 © TheUniversity of Sheffield Outline I • Introduction (CH1) • Fast fMRI vs. BOLD technique • Biological basis • Methodology (CH2) • Phantom Study (CH3) 1- Axon phantom 2- Conductive Gel Phantom 3- NaCl Solution phantom
  • 3.
    21/08/2015 © TheUniversity of Sheffield Outline II • Subject studies 1- Rapid functional MRI measurements of the wrist using TENS stimulation of the median nerve (CH4) 2- Visual stimulation – a comparison of direct detection fast fMRI with the BOLD technique (CH5) 3- Rapid functional MRI measurements of the thalamus and motor-sensory cortex using stimulation of the median nerve. In addition, real and imaginary finger tapping (CH6) • Conclusion and future work (CH7)
  • 4.
    21/08/2015 © TheUniversity of Sheffield What is fast fMRI? • Fast Functional Magnetic Resonance Imaging (fast fMRI): uses MRI to measure nerve or brain activity directly • Uses MRI to detect the electromagnetic field that is generated by ionic currents (action potential)
  • 5.
    21/08/2015 © TheUniversity of Sheffield Why use fast fMRI? • Provide excellent temporal resolution of neuronal population dynamics as well as capabilities for source localization • To better understand brain and nerve function in animals and humans
  • 6.
    21/08/2015 © TheUniversity of Sheffield Biological basis Source: fMRIB Introduction to fMRI Fast fMRI BOLD fMRI
  • 7.
    21/08/2015 © TheUniversity of Sheffield Fast fMRI • Dependent on transient ionic currents • Active-population of firing action potentials • Electromagnetic field generated by ionic currents • Differences in magnitude and phase distribution can be measured (T2*) • Dependent on the Blood Oxygen Level Dependent signal • Active-increased in oxyhemoglobin: deoxyhemoglobin • Diamagnetic vs. Paramagnetic • Differences in magnetic susceptibility can be measured (T2*) BOLD fMRI
  • 8.
    21/08/2015 © TheUniversity of Sheffield Volunteer studies - methodology Subject preparation • All volunteer experiments were performed in accordance with local ethical committee guidelines and approval. (12 volunteers) . MRI data acquisition • fMRI data were acquired with a 1.5 Tesla MR Scanner using an 8 channel array wrist and head coil with the following EPI imaging parameters; TR/TE=88/25 ms, flip angle=90o, acquisition matrix=64x64, FOV =240mm, slice thickness=5mm and 3.75 mm in- plane resolution with 500 dynamic scans
  • 9.
    21/08/2015 © TheUniversity of Sheffield • TENS (transcutaneous electrical nerve stimulation) The median nerve and somatosensory cortex were activated using a voltage ~80V applied to the palm of the hand. • Strobe light The visual cortex was activated using a flashing light (QTX 20W Mini) located outside the magnet room. • These areas were stimulated with high frequencies > 2.5 Hz Stimulation presentation
  • 10.
    21/08/2015 © TheUniversity of Sheffield21/08/2015 © The University of Sheffield Data Analysis • The fMRI data was analysed using MATLAB 6.5 software programs.
  • 11.
    21/08/2015 Volunteer studies Reference ControlExperiments. • Each subject was tested with a control scan without stimulation prior to the stimulation experiments. • The control experiments showed spectral peaks due to heart beat and respiration only. • No specific frequency responses were recorded at the stimulation frequency from the median nerve, somatosensory cortex or visual cortex in the control experiments. Figures for fast fMRI Fourier transform of MR time series of the median nerve, the motosensory and the visual cortex at rest state (control experiments)
  • 12.
    21/08/2015 • ROI’s wereselected in the median nerve and in muscle tissue, Figs 2 and 3. • Fig 4. shows a typical response at 2.8 Hz recorded from the ROI in the median nerve (blue) but not from muscle tissue (red). 1- Responses in the Median Nerve Median nerve 1 MR image shows an axial slice position in the sagittal plane scout image 2 Anatomy MR Image 3 GE-EPI magnitude image in axial plane during the ROI stimulated at 2.8Hz, with Z=2.5 A.U f (Hz) 4 FT of MR time series 2.8Hz Stimulation frequency
  • 13.
    21/08/2015 3- Possible fastfMRI responses in the visual cortex 1 MR image shows an axial slice position in the sagittal plane scout image 2 Functional overlay on MR Image , with Z=2.5 3 GE-EPI magnitude image in axial plane showing the ROI stimulated at 2.8Hz 4 FTof MR time series 2.8Hz •Fig. 2 shows a typical response on the overlay image from an acquisition calculated with a Z score = 2.5. •A typical ROI selected in the visual cortex is shown in Figure 3. •Fig. 4 shows a Fourier transform of the MR time series illustrating the frequency spectrum from the ROI in the visual cortex during visual stimulation at 2.8Hz which correlates with the task stimulation frequency.
  • 14.
    21/08/2015 2- mapping ofmotor sensory cortex function 1 MR image shows an axial slice position in the sagittal plane scout image 2 Function overlay MR Image, with Z=2.5 3 GE-EPI magnitude image in axial plane during the ROI stimulated at 2.7Hz. A.U f (Hz) 4 FT of MR time series 2.7Hz •Figure 2 shows a Z map (Z>2.5) overlaid on the EPI image showing response in the motor-sensory area. •This location was selected in the motor cortex as shown in the ROI in figure 3 using the axial plane for acquisition. •Figure 4 shows the spectral response from the motor- sensory area at 2.7 Hz with SNR>3:1. and the heartbeat at approximately 1.1 Hz. Stimulation frequency
  • 15.
    21/08/2015 Conclusions • Evidence offast fMRI responses in the median nerve, the somatosensory and visual cortices during ROI area stimulation by TENS and strobe light were observed at high stimulation frequencies > 2.5 Hz. • Similar responses were observed at the applied stimulation frequencies with SNR>3:1 in volunteers for the median nerve, the somatosensory and visual cortices respectively. • Fast fMRI did appear to detect weak response to the stimulated frequencies and seeks to improve the spatial and temporal accuracy in detecting neuronal function compared to conventional BOLD fMRI.
  • 16.
    21/08/2015 Acknowledgements I gratefully acknowledgethe sponsorship of the Human Capacity Development Program in Kurdistan Regional Government. I take this opportunity to express my gratitude and regards to Professor Martyn Paley/ Academic Radiology/ Department of Cardiovascular Science for his exemplary guidance, monitoring and constant encouragement throughout the course of this study Prof. Martyn Paley Thank you very much to the volunteers who participated in the experiments we have carried out under ethical permission from the University.