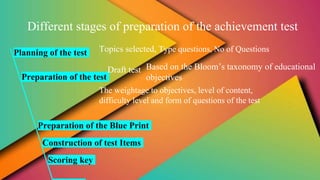
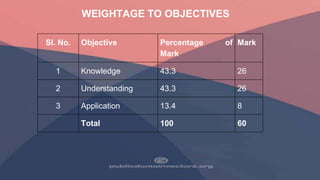
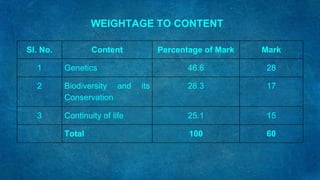
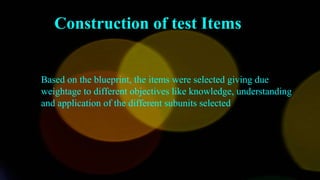
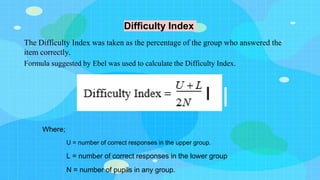
ACHIEVEMENT TEST
Dr.V.S.Sumi
Assistant Professor
MANUU
Hyderabad
Achievement test is an instrument designed to measure
relative accomplishment of pupils in specified areas of
learning. The test of achievement in biology for the present
study was developed and standardized by the investigator
with the help of supervising teacher.
Achievement test
Different stages of preparation of the achievement test
Planning of the test
Preparation of the test
Topics selected, Type questions, No of Questions
Draft test Based on the Bloom’s taxonomy of educational
objectives
The weightage to objectives, level of content,
difficulty level and form of questions of the test
Preparation of the Blue Print
Construction of test Items
Scoring key
Sl. No. Objective Percentage of
Mark
Mark
1 Knowledge 43.3 26
2 Understanding 43.3 26
3 Application 13.4 8
Total 100 60
WEIGHTAGE TO OBJECTIVES
Sl. No. Content Percentage of Mark Mark
1 Genetics 46.6 28
2 Biodiversity and its
Conservation
28.3 17
3 Continuity of life 25.1 15
Total 100 60
WEIGHTAGE TO CONTENT
Sl. No. Difficulty Level Percentage of Mark Mark
1 Easy 31.6 19
2 Average 53.3 32
3 Difficult 15.1 9
Total 100 60
WEIGHTAGE TO DIFFICULTY LEVEL
Sl. No Form of Question Percentage of
Mark
Mark
1 Objective type 20 10
2 Short answer 40 30
3 Essay 40 30
WEIGHTAGE TO FORM OF
QUESTIONS
Preparation of the Blue Print
Blue print is a 3-D chart showing the placement of the objectives, content and form of questions. Sometimes to
make it four dimensional, add difficulty level also.
Objectives Knowledge Comprehension Application Total
Form of questions
Content
Objective
type
Objective type Objective type
Genetics 8(8) 6(6) 12(12) 26
Biodiversity and its
Conservation
6(6) 7(7) 4(4) 17
Continuity of Life 12(12) 3(3) - 15
Grand Total 26 26 8 60
The numbers outside the bracket represent the number question which those bracket represent marks allotted
Based on the blueprint, the items were selected giving due
weightage to different objectives like knowledge, understanding
and application of the different subunits selected
Construction of test Items
Scoring key
The scoring key preparation for scoring the answer sheets
A separate scoring key for both the draft test and the final test.
Try Out
The draft test was tried out on a sample
Select school and
secure permission
Time schedule for the
administration of the test
Instructions about the
test
Item Analysis
The quality of a test depends upon the individual items of which it is composed. As it
is necessary to analyze whether each item useful for the purpose to which it is being
constructed. Item analysis indicate which item may be too easy or too difficult and
which may fail for the reason to discriminate clearly between the better and poorer
examiners. Ebel and Frisbie (1991).
The selected response sheets have to be arranged in the score order from highest to
lowest. The score obtained by upper 27% students and the bottom 27% students were
taken from each group as the high group and low group respectively (Crow & Crow).
In order to select the items for the final test, the Discriminating Power and Difficulty
Index of each item must be find out.
Difficulty Index
The Difficulty Index was taken as the percentage of the group who answered the
item correctly.
Formula suggested by Ebel was used to calculate the Difficulty Index.
Where;
U = number of correct responses in the upper group.
L = number of correct responses in the lower group
N = number of pupils in any group.
Discriminating Power
The Discriminating Power of an item refers to the quality of an item at
which it discriminates between pupils with high and low knowledge. It is based
on the difference between correct response in the lower group and upper group
(Ebel and Frisbie, 1991).
Formula which was proposed by Ebel for calculating the Discriminating Power.
Where;
U = the number of correct responses in the upper group
L =the number of correct responses in the lower group
N =the number of individuals in each group.
Selection of the item
On the basis of Difficulty Index and Discriminating Power the items will be selected. Generally the items
having Difficulty Index between 0.3 to 0.8 considered good items and the Discriminating Power more than 0.3
is considered to be ideal.
Preparation for the final test
After the selection of the items the investigator should select items for the final test.
Validity and Reliability
Validity
The most important quality of a test is its
ability to measure what it is intended to
measure, the attainment of objectives for
which it is designed.
According to Best (1995) the validity is that
quality of a data gathering instrument or
procedure that enable it to determine it was
designed to determine.
Various kinds- Content validity
Criterion related validity
Face validity
Concurrent validity
Reliability
Reliability refers to consistency of the test scores,
that is how consistent these are from one
measurement to another.
According to Crow (1963) by reliability it is
meant the extent to which or the accuracy with
which a test measures what it has been
constructed to measure.
Reliability coefficient can be calculated with
different methods such as test retest method, split
half method, equivalent or parallel form method
and inter score reliability method.
.
https://keydifferences.com/difference-
between-objective-and-subjective.html
https://targetstudy.com/articles/import
ance-of-an-aptitude-test-in-
education.html
https://www.yourarticlelibrary.com/edu
cation/evaluation-of-cognitive-and-
non-cognitive-learning-out-
comes/45223
References
Thank you ● Feedback
email: drsumi@manuu.edu.in

Achievement test

  • 1.
  • 2.
    Achievement test isan instrument designed to measure relative accomplishment of pupils in specified areas of learning. The test of achievement in biology for the present study was developed and standardized by the investigator with the help of supervising teacher. Achievement test
  • 3.
    Different stages ofpreparation of the achievement test Planning of the test Preparation of the test Topics selected, Type questions, No of Questions Draft test Based on the Bloom’s taxonomy of educational objectives The weightage to objectives, level of content, difficulty level and form of questions of the test Preparation of the Blue Print Construction of test Items Scoring key
  • 4.
    Sl. No. ObjectivePercentage of Mark Mark 1 Knowledge 43.3 26 2 Understanding 43.3 26 3 Application 13.4 8 Total 100 60 WEIGHTAGE TO OBJECTIVES
  • 5.
    Sl. No. ContentPercentage of Mark Mark 1 Genetics 46.6 28 2 Biodiversity and its Conservation 28.3 17 3 Continuity of life 25.1 15 Total 100 60 WEIGHTAGE TO CONTENT
  • 6.
    Sl. No. DifficultyLevel Percentage of Mark Mark 1 Easy 31.6 19 2 Average 53.3 32 3 Difficult 15.1 9 Total 100 60 WEIGHTAGE TO DIFFICULTY LEVEL
  • 7.
    Sl. No Formof Question Percentage of Mark Mark 1 Objective type 20 10 2 Short answer 40 30 3 Essay 40 30 WEIGHTAGE TO FORM OF QUESTIONS
  • 8.
    Preparation of theBlue Print Blue print is a 3-D chart showing the placement of the objectives, content and form of questions. Sometimes to make it four dimensional, add difficulty level also. Objectives Knowledge Comprehension Application Total Form of questions Content Objective type Objective type Objective type Genetics 8(8) 6(6) 12(12) 26 Biodiversity and its Conservation 6(6) 7(7) 4(4) 17 Continuity of Life 12(12) 3(3) - 15 Grand Total 26 26 8 60 The numbers outside the bracket represent the number question which those bracket represent marks allotted
  • 9.
    Based on theblueprint, the items were selected giving due weightage to different objectives like knowledge, understanding and application of the different subunits selected Construction of test Items
  • 10.
    Scoring key The scoringkey preparation for scoring the answer sheets A separate scoring key for both the draft test and the final test. Try Out The draft test was tried out on a sample Select school and secure permission Time schedule for the administration of the test Instructions about the test
  • 11.
    Item Analysis The qualityof a test depends upon the individual items of which it is composed. As it is necessary to analyze whether each item useful for the purpose to which it is being constructed. Item analysis indicate which item may be too easy or too difficult and which may fail for the reason to discriminate clearly between the better and poorer examiners. Ebel and Frisbie (1991). The selected response sheets have to be arranged in the score order from highest to lowest. The score obtained by upper 27% students and the bottom 27% students were taken from each group as the high group and low group respectively (Crow & Crow). In order to select the items for the final test, the Discriminating Power and Difficulty Index of each item must be find out.
  • 12.
    Difficulty Index The DifficultyIndex was taken as the percentage of the group who answered the item correctly. Formula suggested by Ebel was used to calculate the Difficulty Index. Where; U = number of correct responses in the upper group. L = number of correct responses in the lower group N = number of pupils in any group.
  • 13.
    Discriminating Power The DiscriminatingPower of an item refers to the quality of an item at which it discriminates between pupils with high and low knowledge. It is based on the difference between correct response in the lower group and upper group (Ebel and Frisbie, 1991). Formula which was proposed by Ebel for calculating the Discriminating Power. Where; U = the number of correct responses in the upper group L =the number of correct responses in the lower group N =the number of individuals in each group.
  • 14.
    Selection of theitem On the basis of Difficulty Index and Discriminating Power the items will be selected. Generally the items having Difficulty Index between 0.3 to 0.8 considered good items and the Discriminating Power more than 0.3 is considered to be ideal. Preparation for the final test After the selection of the items the investigator should select items for the final test.
  • 15.
    Validity and Reliability Validity Themost important quality of a test is its ability to measure what it is intended to measure, the attainment of objectives for which it is designed. According to Best (1995) the validity is that quality of a data gathering instrument or procedure that enable it to determine it was designed to determine. Various kinds- Content validity Criterion related validity Face validity Concurrent validity Reliability Reliability refers to consistency of the test scores, that is how consistent these are from one measurement to another. According to Crow (1963) by reliability it is meant the extent to which or the accuracy with which a test measures what it has been constructed to measure. Reliability coefficient can be calculated with different methods such as test retest method, split half method, equivalent or parallel form method and inter score reliability method. .
  • 16.
  • 17.
    Thank you ●Feedback email: drsumi@manuu.edu.in