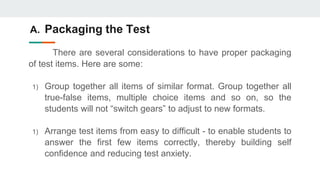
1. This module discusses guidelines for assembling, administering, analyzing, and improving tests. It covers properly packaging test items, reproducing the test, administering the test to reduce anxiety, and scoring procedures.
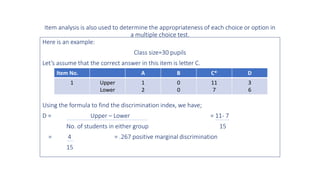
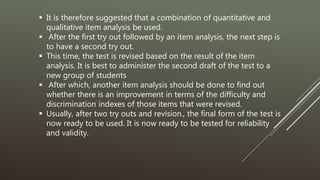
2. Item analysis is explained as a quantitative method to evaluate the difficulty and discrimination of each test item. It involves separating student papers by score, tallying correct responses from high- and low-scoring groups, and calculating difficulty and discrimination indexes.
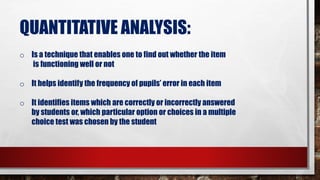
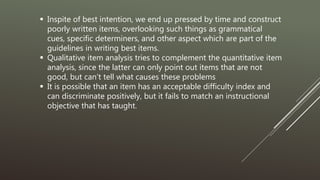
3. Qualitative analysis examines the effectiveness of each distractor in multiple choice items. Together, quantitative and qualitative analysis identify well-performing and flawed items needing revision.