Downloaded 32 times
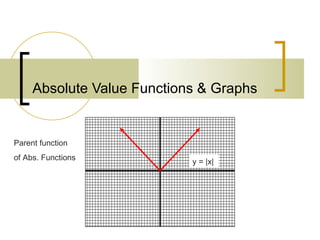
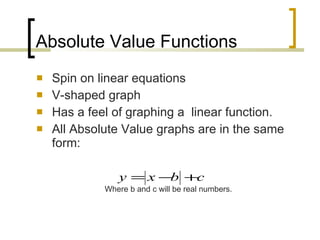


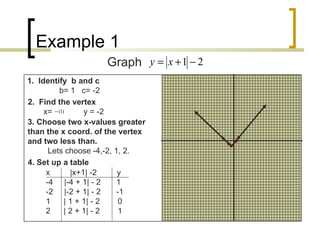


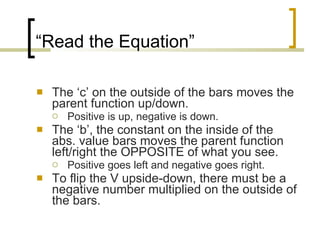


1) Absolute value functions have a V-shaped graph called the parent function y=|x|. 2) Absolute value functions can be graphed by identifying the vertex (x,y) coordinates using the equation, choosing x-values to plot points, and connecting the points. 3) Graphing calculators can also be used to graph absolute value functions by entering the equation in y=, using math mode to input the absolute value symbol, and graphing the function.