Downloaded 98 times
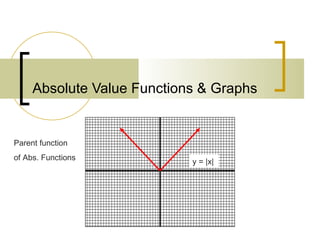
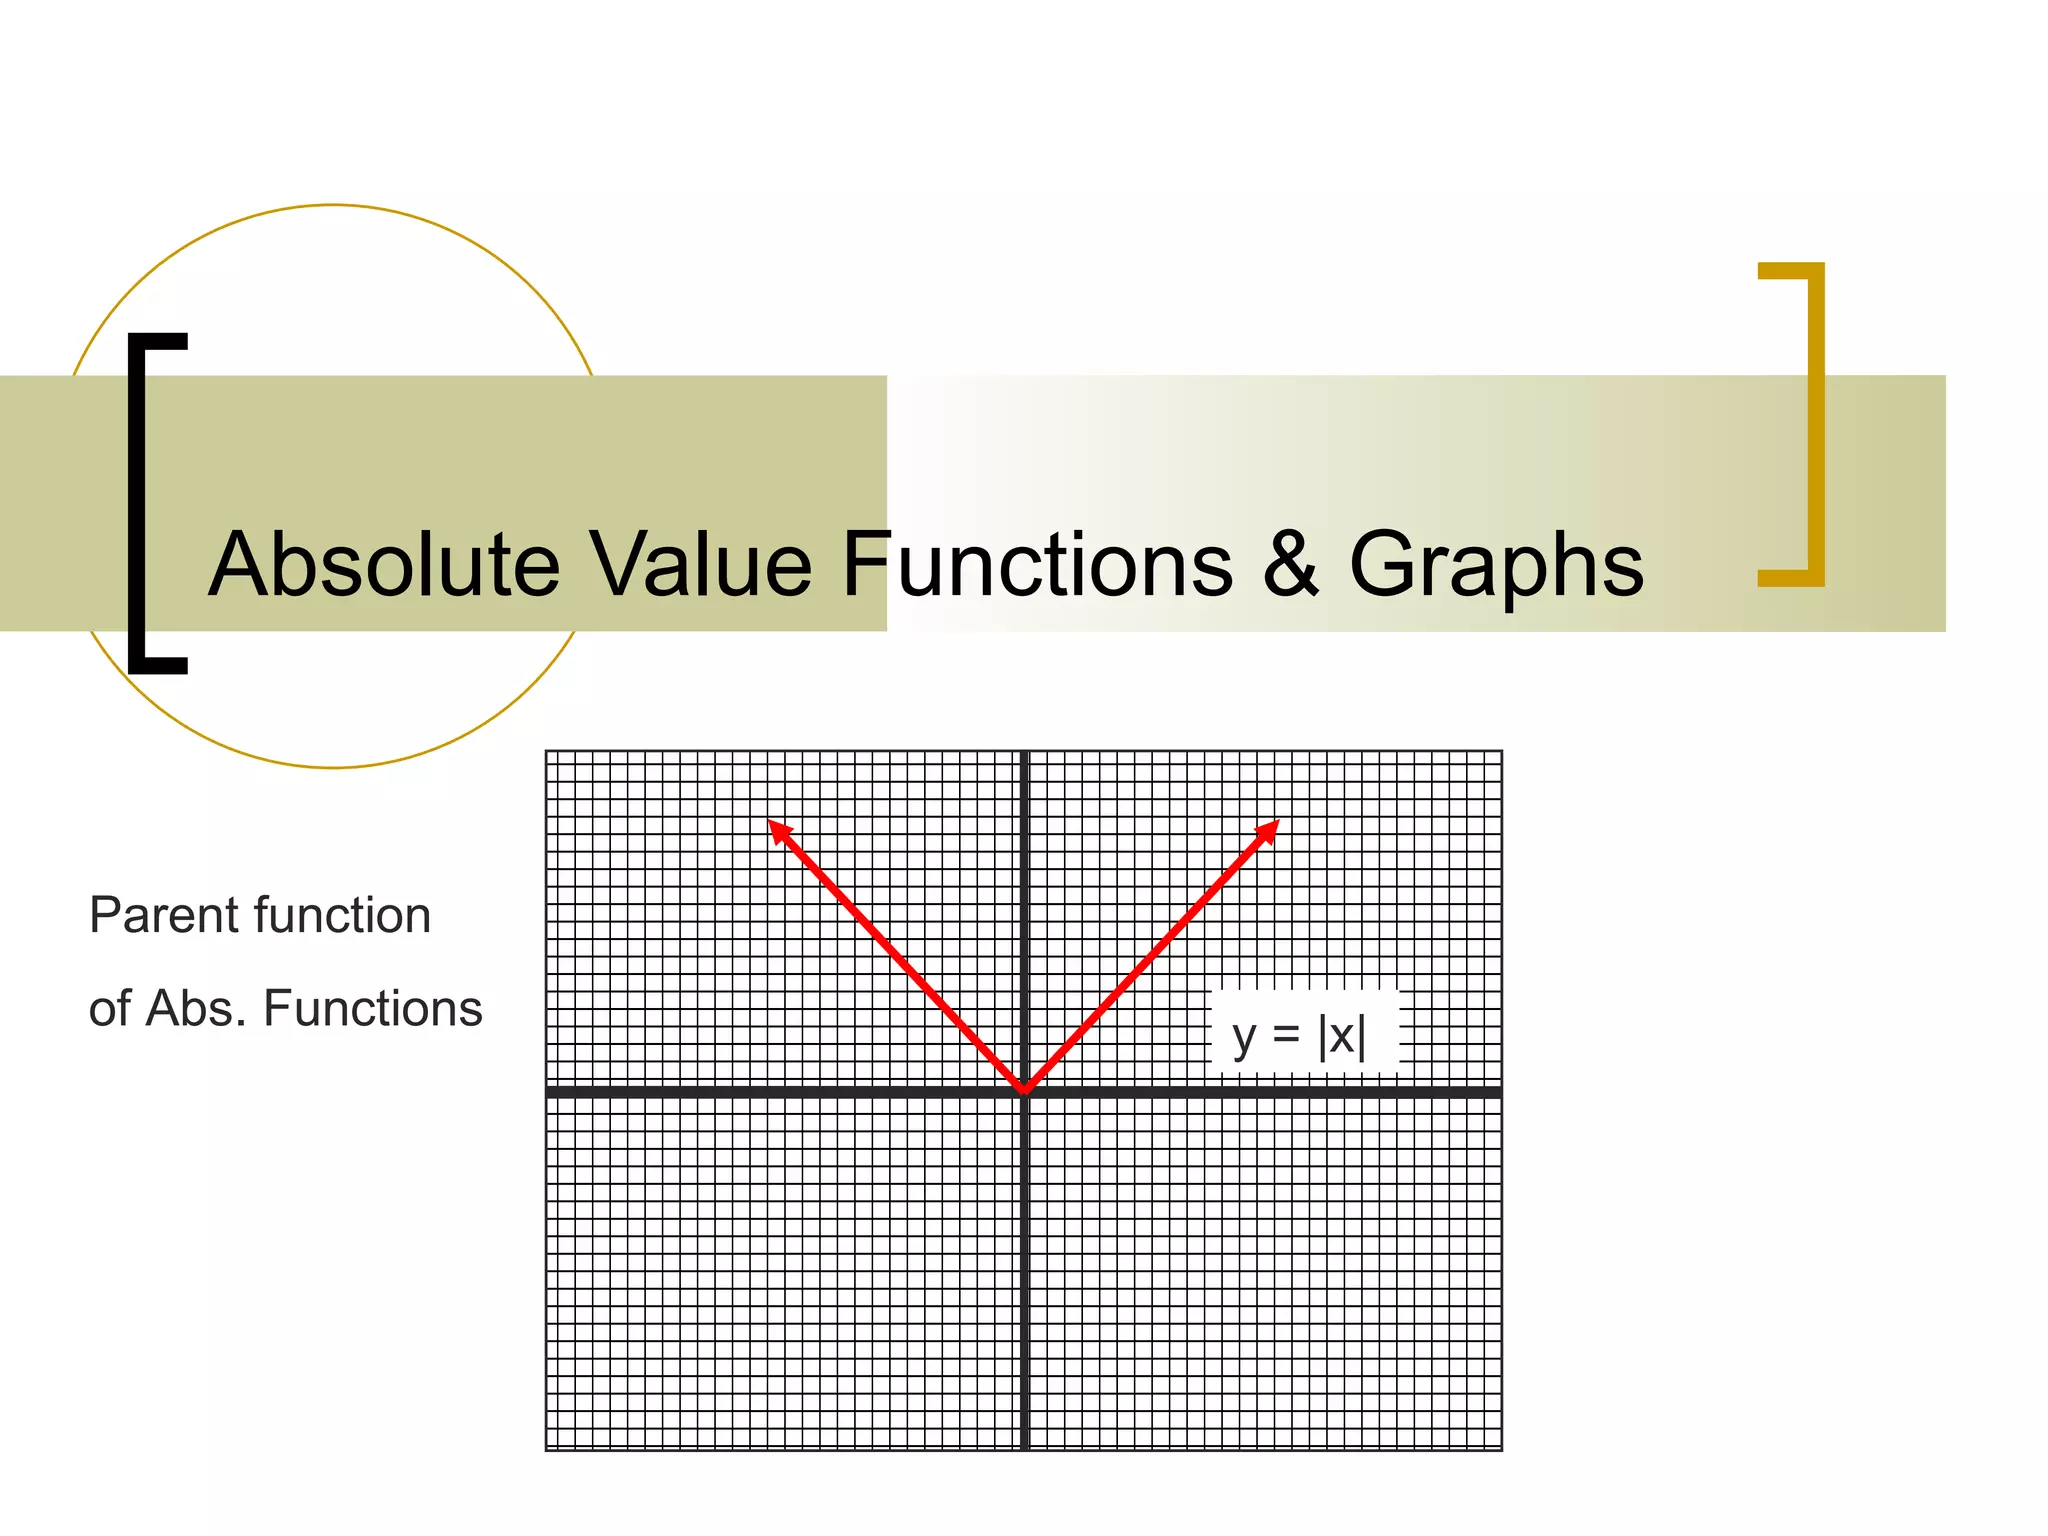
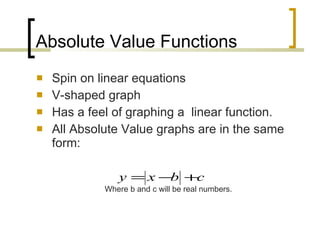
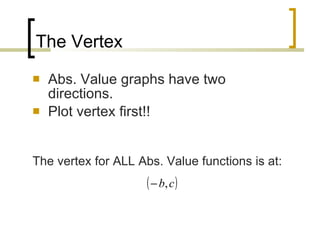
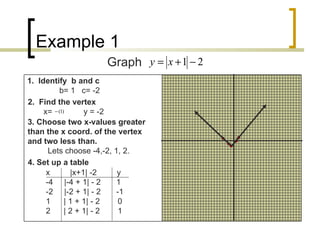
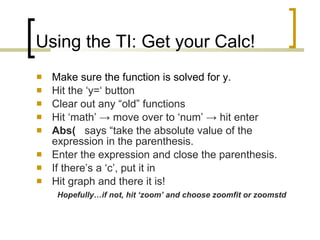
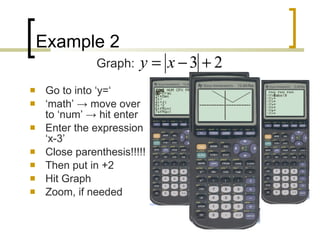
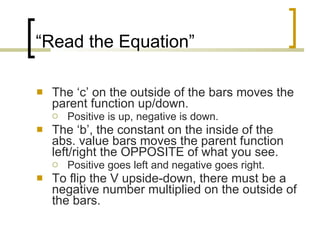
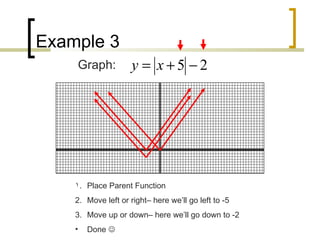

Absolute value functions have a V-shaped graph. There are three main ways to graph an absolute value function: using a table of values, using a graphing calculator, or interpreting the equation. The vertex of an absolute value graph is always the x-coordinate inside the absolute value signs. To graph, one finds the vertex and then plots additional points on either side, connecting them to form the V-shape. The number outside the absolute value signs moves the graph up or down, while the number inside moves it left or right.