Download to read offline

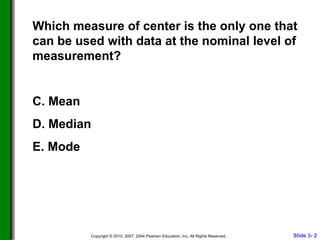
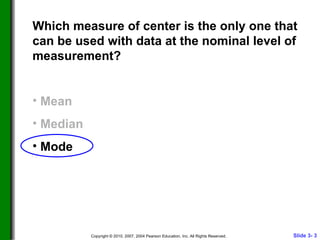
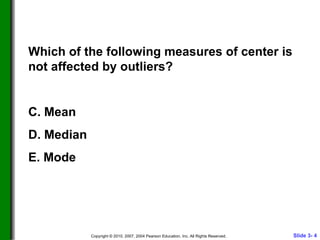
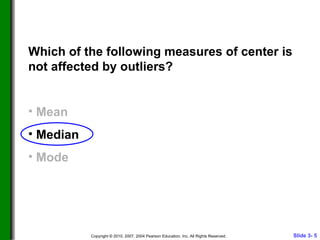
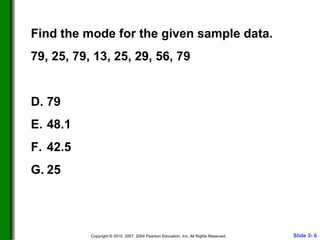
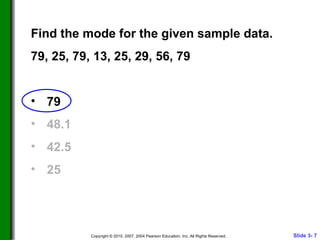
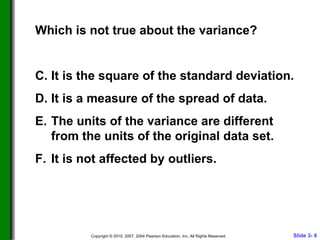
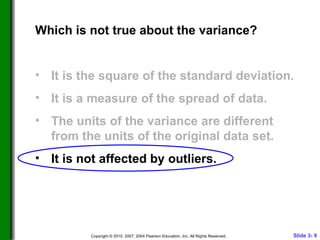
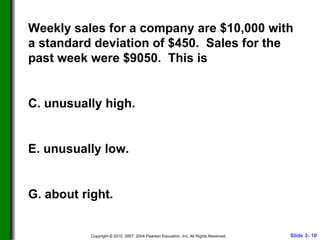
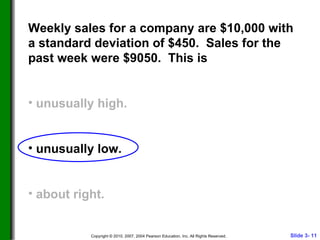
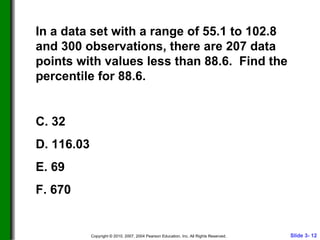
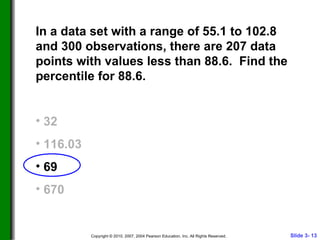
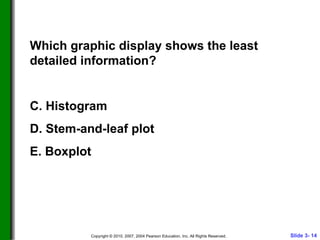

This document contains lecture slides about statistics for describing, exploring, and comparing data. It discusses measures of center such as the mean, median, and mode. It also discusses variance and standard deviation as measures of spread. Additional topics covered include finding the mode, determining if a value is unusually high or low based on the mean and standard deviation, calculating percentiles, and comparing the detail provided by different graphic displays of data.