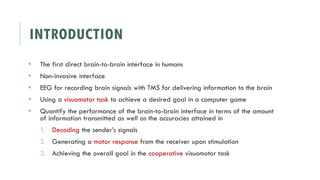
1) Researchers created the first direct brain-to-brain interface between humans using non-invasive EEG and TMS technologies.
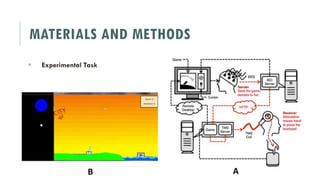
2) In an experiment, one participant (the sender) viewed a computer game and their brain signals were decoded to transmit information via the internet to a TMS machine stimulating another participant (the receiver).
3) The receiver was then able to use the received brain signals to perform motor actions in the game, demonstrating basic information transmission between human brains located over 1 mile apart.