Download as PDF, PPTX

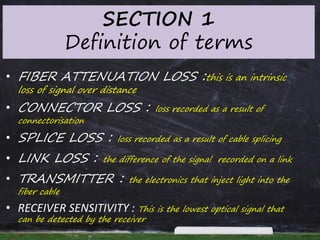
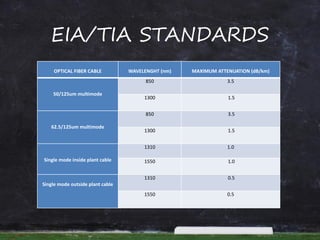
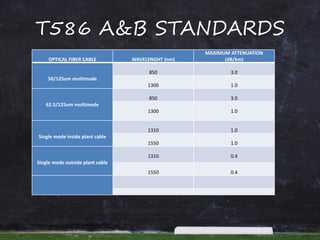
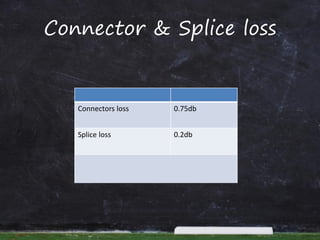
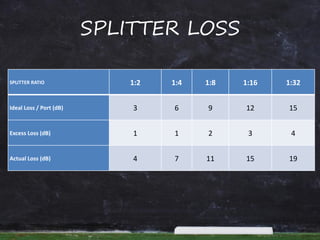
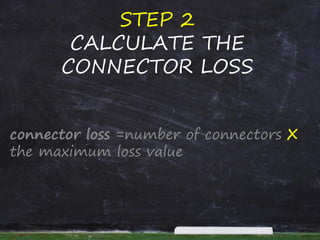

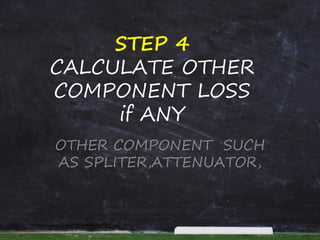
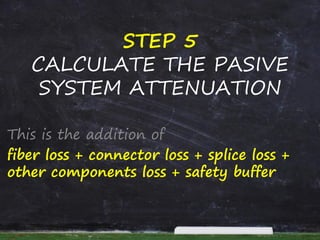
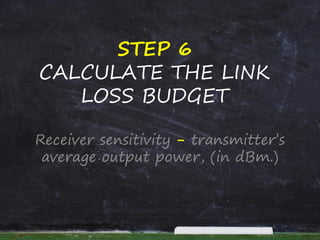

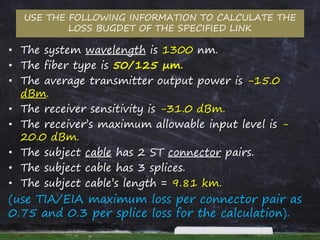
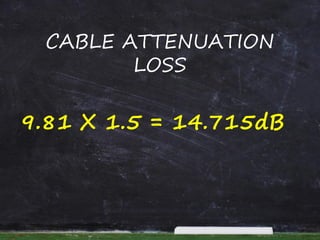
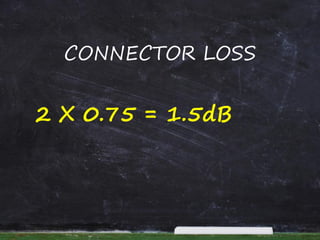
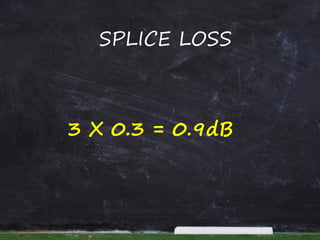
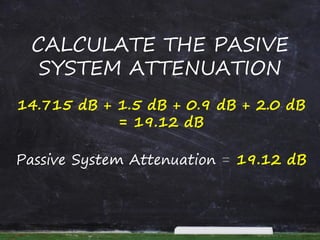
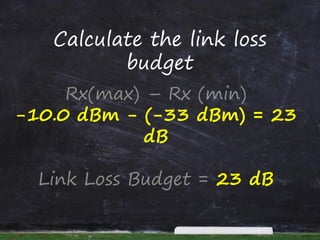
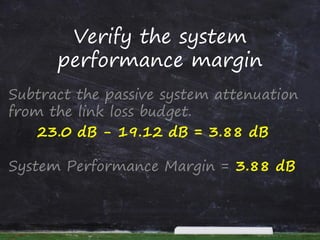
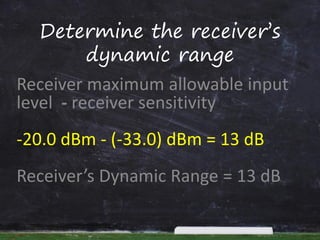
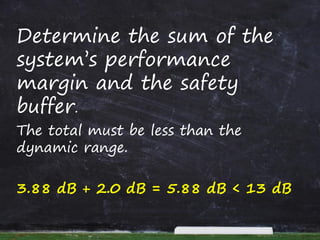

This document provides information and steps to calculate a fiber cable link loss budget. It defines key terms, lists standard fiber attenuation values, and common connector and splice losses. It then outlines the 9 steps to calculate a loss budget, including fiber attenuation loss, connector loss, splice loss, passive system attenuation, link loss budget, performance margin, receiver dynamic range, and ensuring the total margin is less than the dynamic range. Finally, it provides a case study example to demonstrate calculating the loss budget for a specific fiber link.