Download as PDF, PPTX
![OFDM
To overcome the effect of multi path fading problem
available in UMTS, LTE uses Orthogonal Frequency
Division Multiplexing (OFDM) for the downlink[2].](https://image.slidesharecdn.com/evmdegradationinltesystemsbyrffiltering-161212112208/75/EVM-Degradation-in-LTE-systems-by-RF-Filtering-2-2048.jpg)
![OFDM
That is, from the base station to the terminal to transmit
the data over many narrow band careers of 180 KHz
each instead of spreading one signal over the complete
5MHz career bandwidth i.e. OFDM uses a large number
of narrow sub-carriers for multi-carrier transmission to
carry data[2].
OFDM, is a frequency-division multiplexing (FDM)
scheme used as a digital multi-carrier modulation
method.
Besides, The basic LTE physical resource can be also
seen as a time-frequency grid[2].](https://image.slidesharecdn.com/evmdegradationinltesystemsbyrffiltering-161212112208/75/EVM-Degradation-in-LTE-systems-by-RF-Filtering-3-2048.jpg)
![OFDM
The OFDM symbols are grouped into resource blocks.
One resource block has a total size of 180kHz in the
frequency domain and 0.5ms in the time domain. Each
user is allocated a number of so-called resource blocks
in the time and frequency grid. The more resource
blocks a user gets, and the higher the modulation used
in the resource elements, the higher the data-rate[2].](https://image.slidesharecdn.com/evmdegradationinltesystemsbyrffiltering-161212112208/75/EVM-Degradation-in-LTE-systems-by-RF-Filtering-4-2048.jpg)
![OFDM
As mentioned above, a resource block (RB) is the
smallest unit of resources that can be allocated to a
user. The RB is 180 kHz wide in frequency and 0.5 ms in
time. In frequency, the RB contains 12 x 15 kHz
subcarriers[4].
Time Unit Value
Frame 10 ms
Half-frame 5 ms
Sub-frame 1 ms
Slot 0.5 ms
Symbol (0.5 / 7) ms](https://image.slidesharecdn.com/evmdegradationinltesystemsbyrffiltering-161212112208/75/EVM-Degradation-in-LTE-systems-by-RF-Filtering-5-2048.jpg)
![OFDM
The bandwidths defined by the standard are 1.4, 3, 5, 10,
15, and 20 MHz. For downlink signals, the DC subcarrier
is not transmitted, but is counted in the number of
subcarriers. For uplink, the DC subcarrier does not
exist because the entire spectrum is shifted down in
frequency by half the subcarrier spacing and is
symmetric about DC[4,5].](https://image.slidesharecdn.com/evmdegradationinltesystemsbyrffiltering-161212112208/75/EVM-Degradation-in-LTE-systems-by-RF-Filtering-6-2048.jpg)
![OFDMA
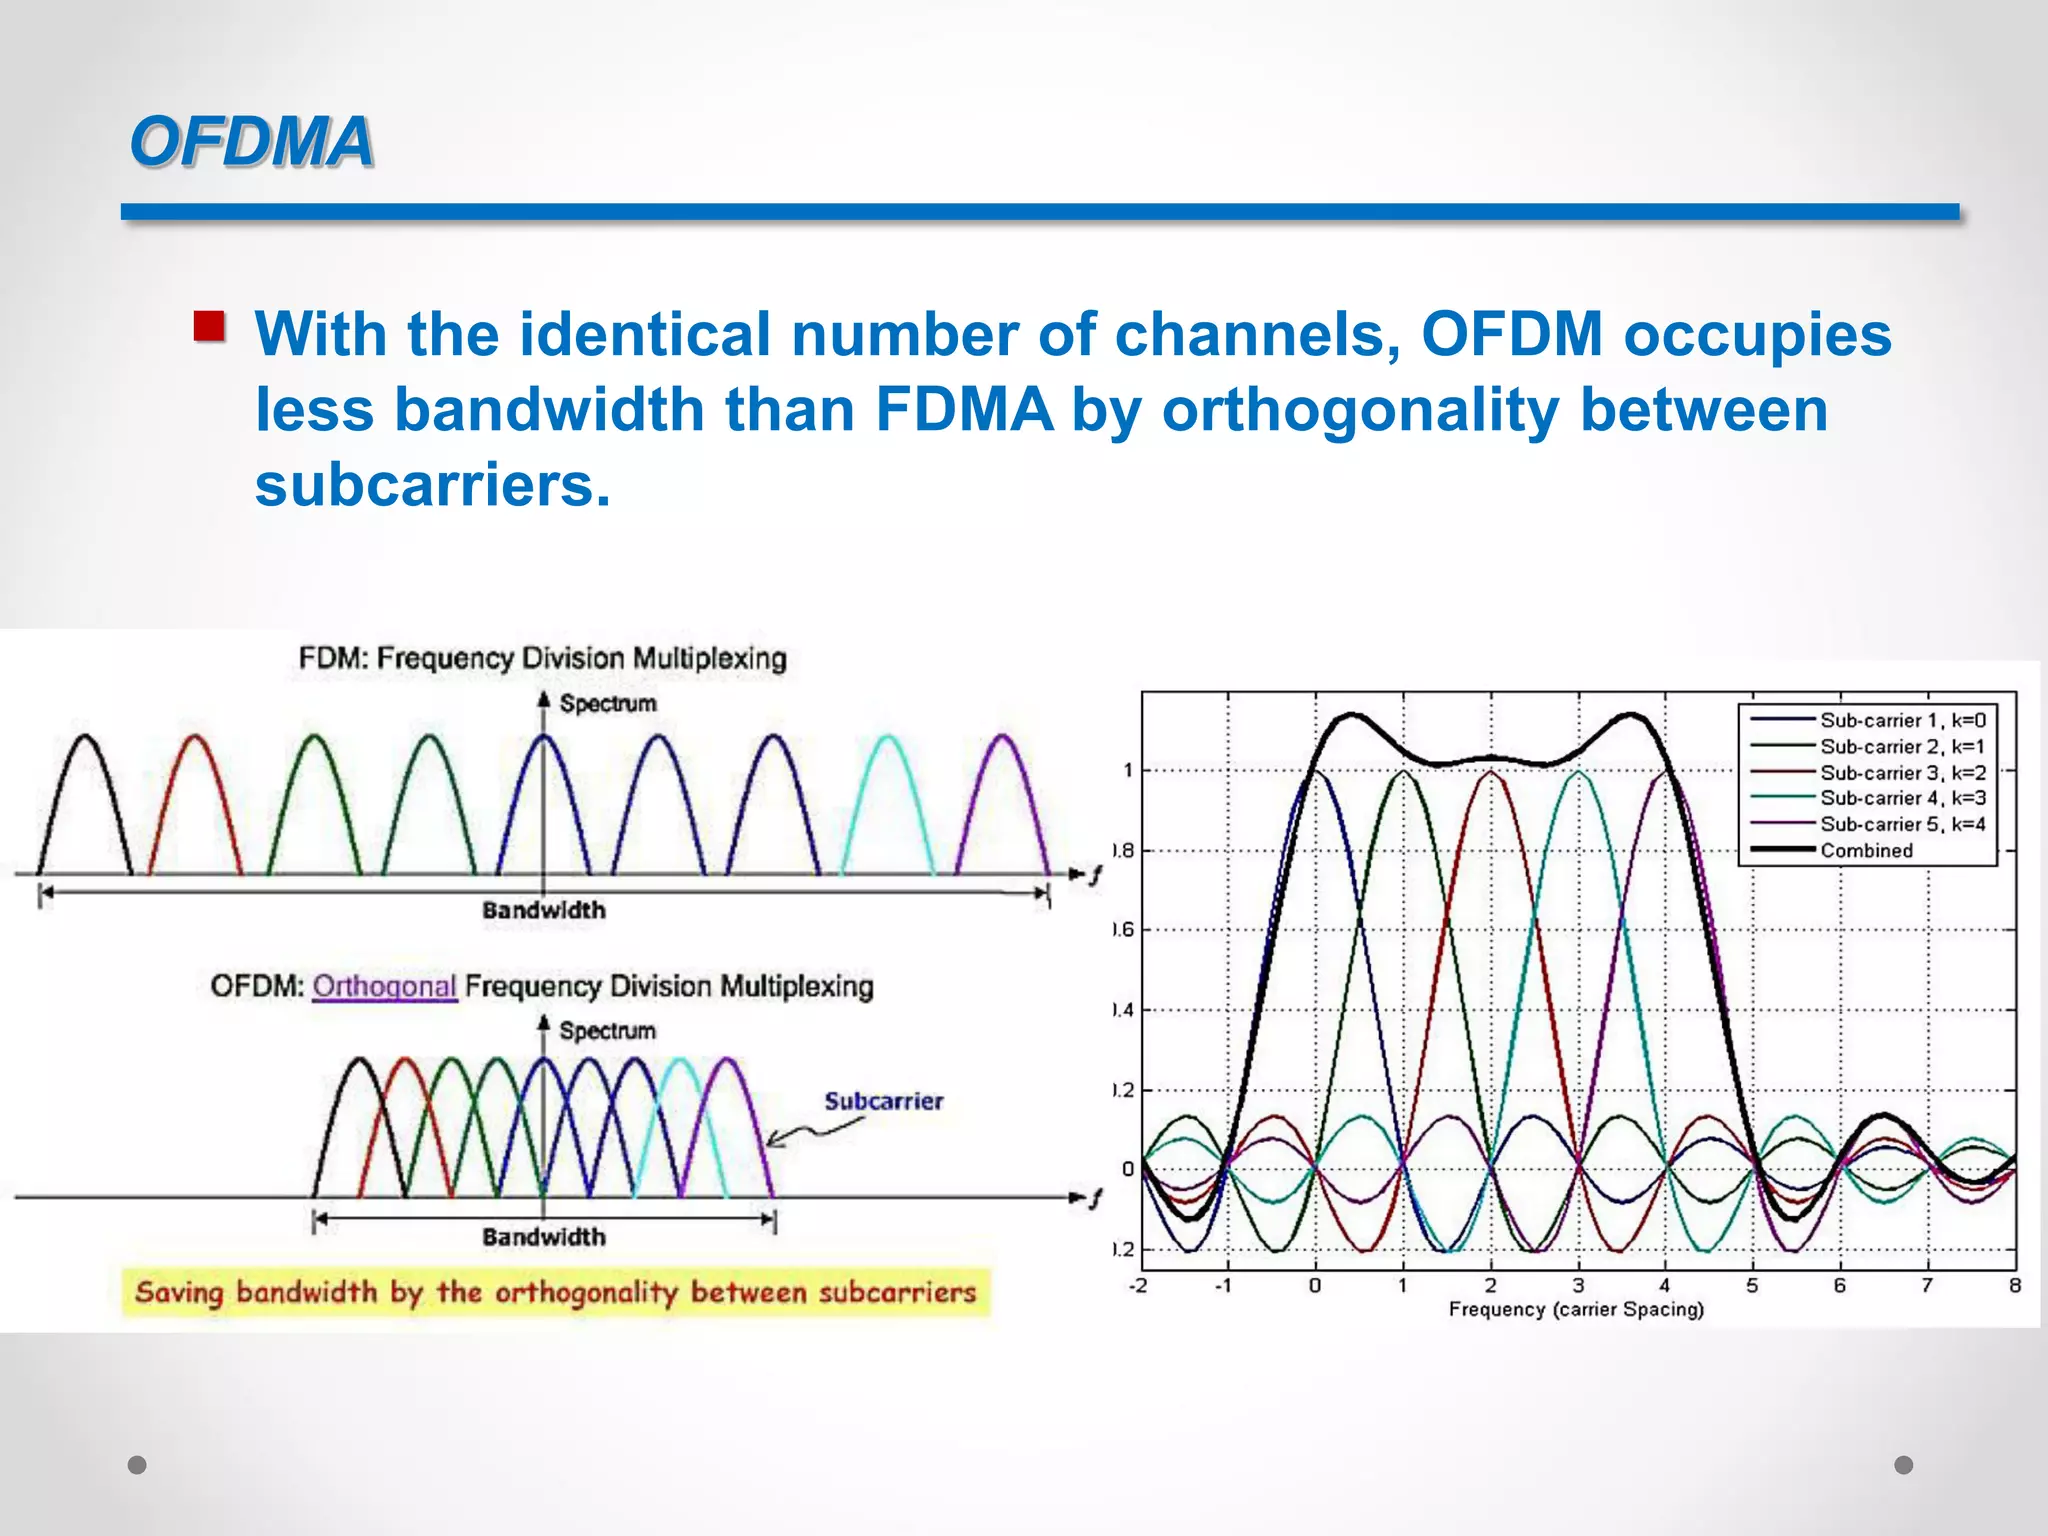
To achieve high radio spectral efficiency as well as
enable efficient scheduling in both time and frequency
domain, a multicarrier approach for multiple access
was chosen[7].
For the downlink, OFDMA (Orthogonal Frequency
Division Multiple Access) was selected[7,8].
Several division multiple access scenarios are as
below[13]:](https://image.slidesharecdn.com/evmdegradationinltesystemsbyrffiltering-161212112208/75/EVM-Degradation-in-LTE-systems-by-RF-Filtering-8-2048.jpg)
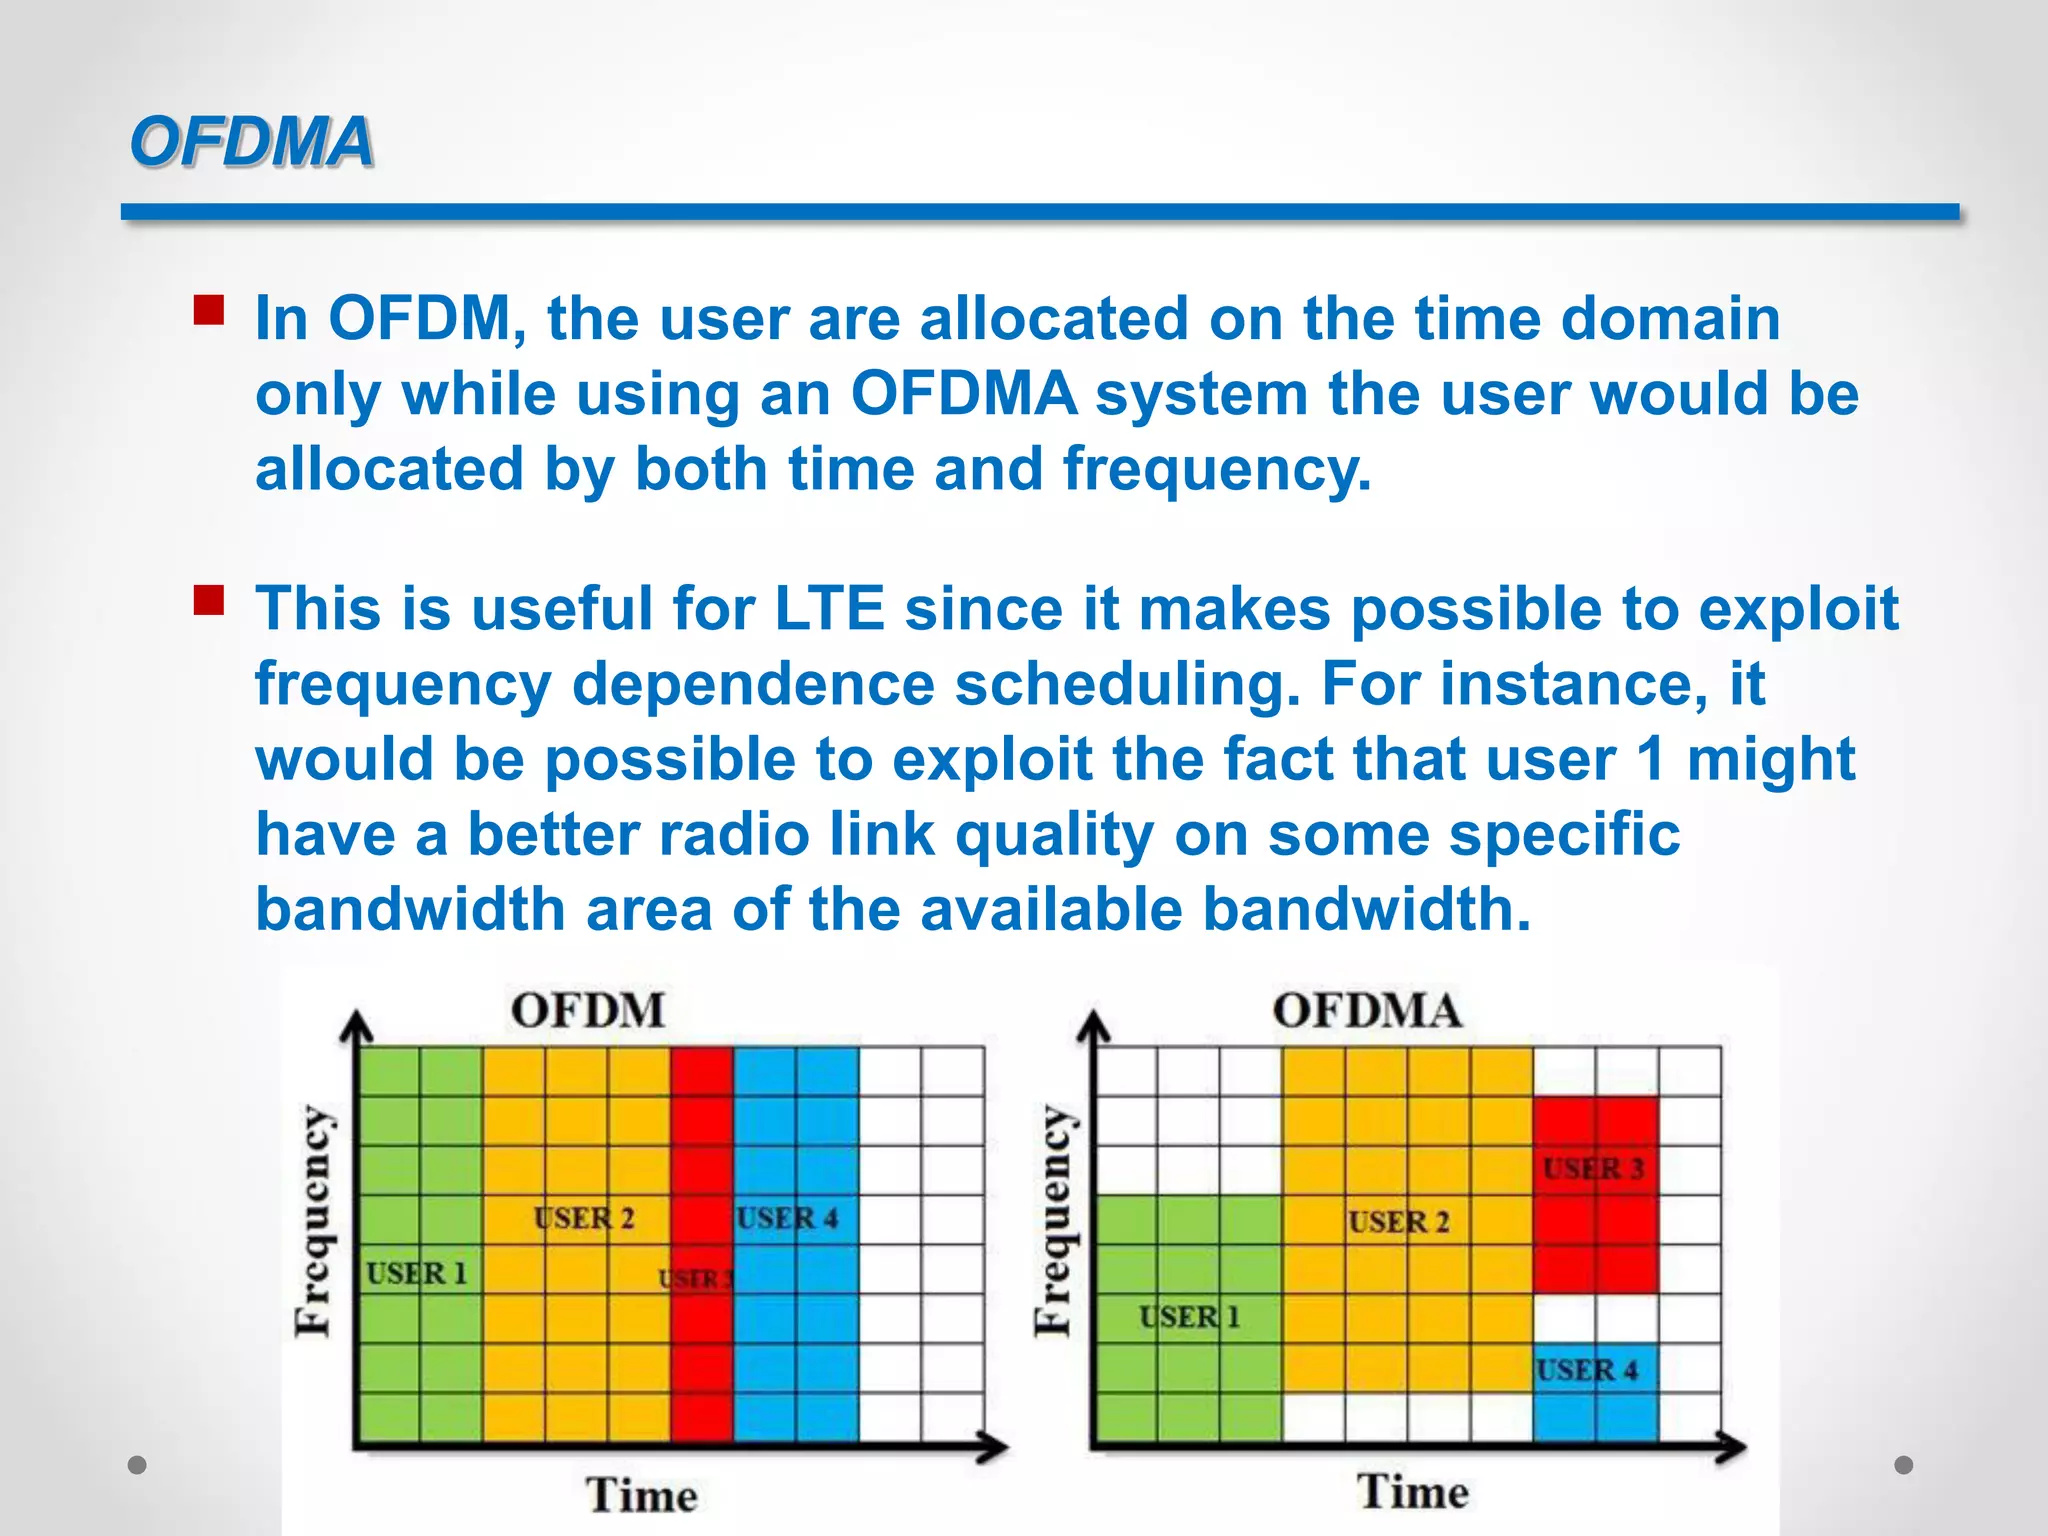
![OFDMA
What is the difference between OFDM and OFDMA[8]?
OFDM support multiple users (Multiple Access) via TDMA
basis only, while OFDMA support either on TDMA or FDMA
basis or both simultaneously.
OFDMA supports simultaneous low data rate transmission
from several users, but OFDM can only support one user at
given moment.
Further improvement to OFDMA over OFDM robustness to
fading and interference since it can assign subset of
subcarrier per user by avoiding assigning bad channels.
OFDMA allows these subcarriers to be shared between
multiple users, but OFDM doesn’t[7].](https://image.slidesharecdn.com/evmdegradationinltesystemsbyrffiltering-161212112208/75/EVM-Degradation-in-LTE-systems-by-RF-Filtering-10-2048.jpg)
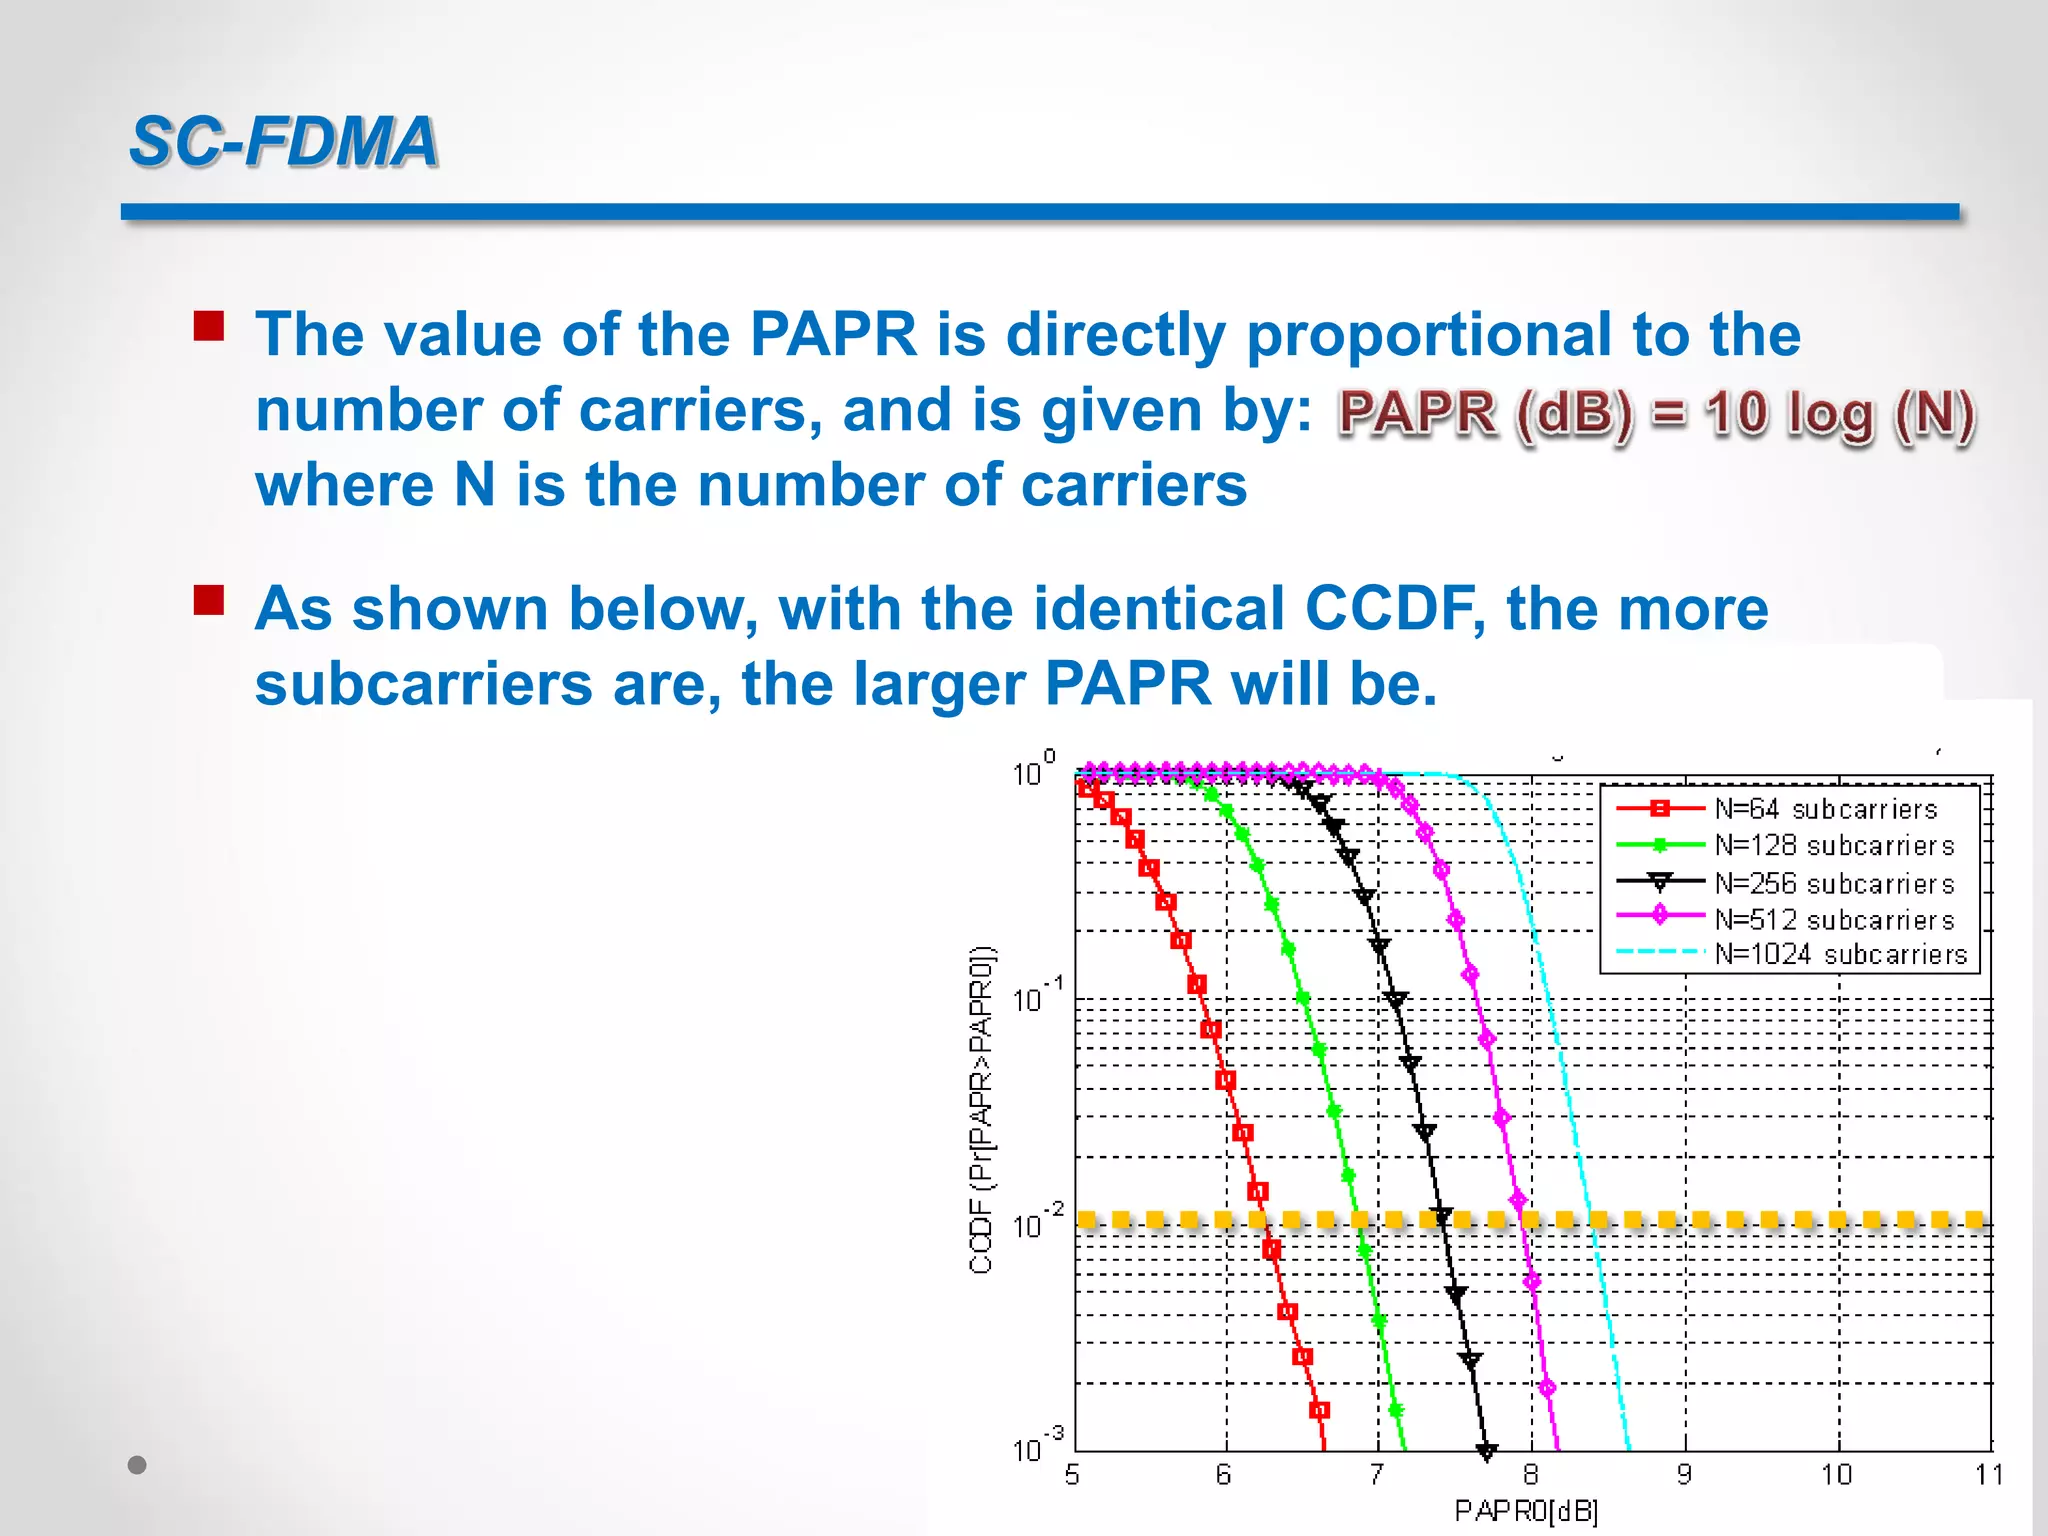
![SC-FDMA
But whether OFDM or OFDMA, one of the most difficult
engineering concerns in the RF section of is handling
very large peak-to-average power ratios (PAPRs). A
peak in the signal power will occur when all, or most, of
the sub-carriers align themselves in phase. In general,
this will occur once every symbol period[10-12].
Average Power
Peak Power
Time
OFDM Symbol Power](https://image.slidesharecdn.com/evmdegradationinltesystemsbyrffiltering-161212112208/75/EVM-Degradation-in-LTE-systems-by-RF-Filtering-11-2048.jpg)
![SC-FDMA
Large PAPR requires high linearity requirements for PA
and increases power consumption[7]
PA](https://image.slidesharecdn.com/evmdegradationinltesystemsbyrffiltering-161212112208/75/EVM-Degradation-in-LTE-systems-by-RF-Filtering-12-2048.jpg)
![SC-FDMA
Consequently, Single Carrier Frequency Division
Multiple Access(SC-FDMA) transmission technique is
used for Uplink[13].
SC-FDMA, variant of OFDM, reduces the PAPR[13]:
Combines the PAPR of single-carrier system with the
multipath resistance and flexible subcarrier frequency
allocation offered by OFDM.
It can reduce the PAPR between 3- to 9dB compared to
OFDMA.](https://image.slidesharecdn.com/evmdegradationinltesystemsbyrffiltering-161212112208/75/EVM-Degradation-in-LTE-systems-by-RF-Filtering-13-2048.jpg)
![SC-FDMA
OFDMA transmits the data symbols in parallel, one per
subcarrier[14].
SC-FDMA transmits the data symbols in series at
several times the rate, with each data symbol
occupying N x 15 kHz bandwidth.
Visually, the OFDMA signal is clearly multi-carrier and
the SC-FDMA signal looks more like single-carrier,
which explains the “SC” in its name.](https://image.slidesharecdn.com/evmdegradationinltesystemsbyrffiltering-161212112208/75/EVM-Degradation-in-LTE-systems-by-RF-Filtering-14-2048.jpg)
![SC-FDMA
Hence, SC-FDMA has smaller PAPR than OFDMA due to
merely single carrier.
Higher Peak
As shown below, SC-FDMA actually has smaller peak
than OFDMA[16].](https://image.slidesharecdn.com/evmdegradationinltesystemsbyrffiltering-161212112208/75/EVM-Degradation-in-LTE-systems-by-RF-Filtering-16-2048.jpg)
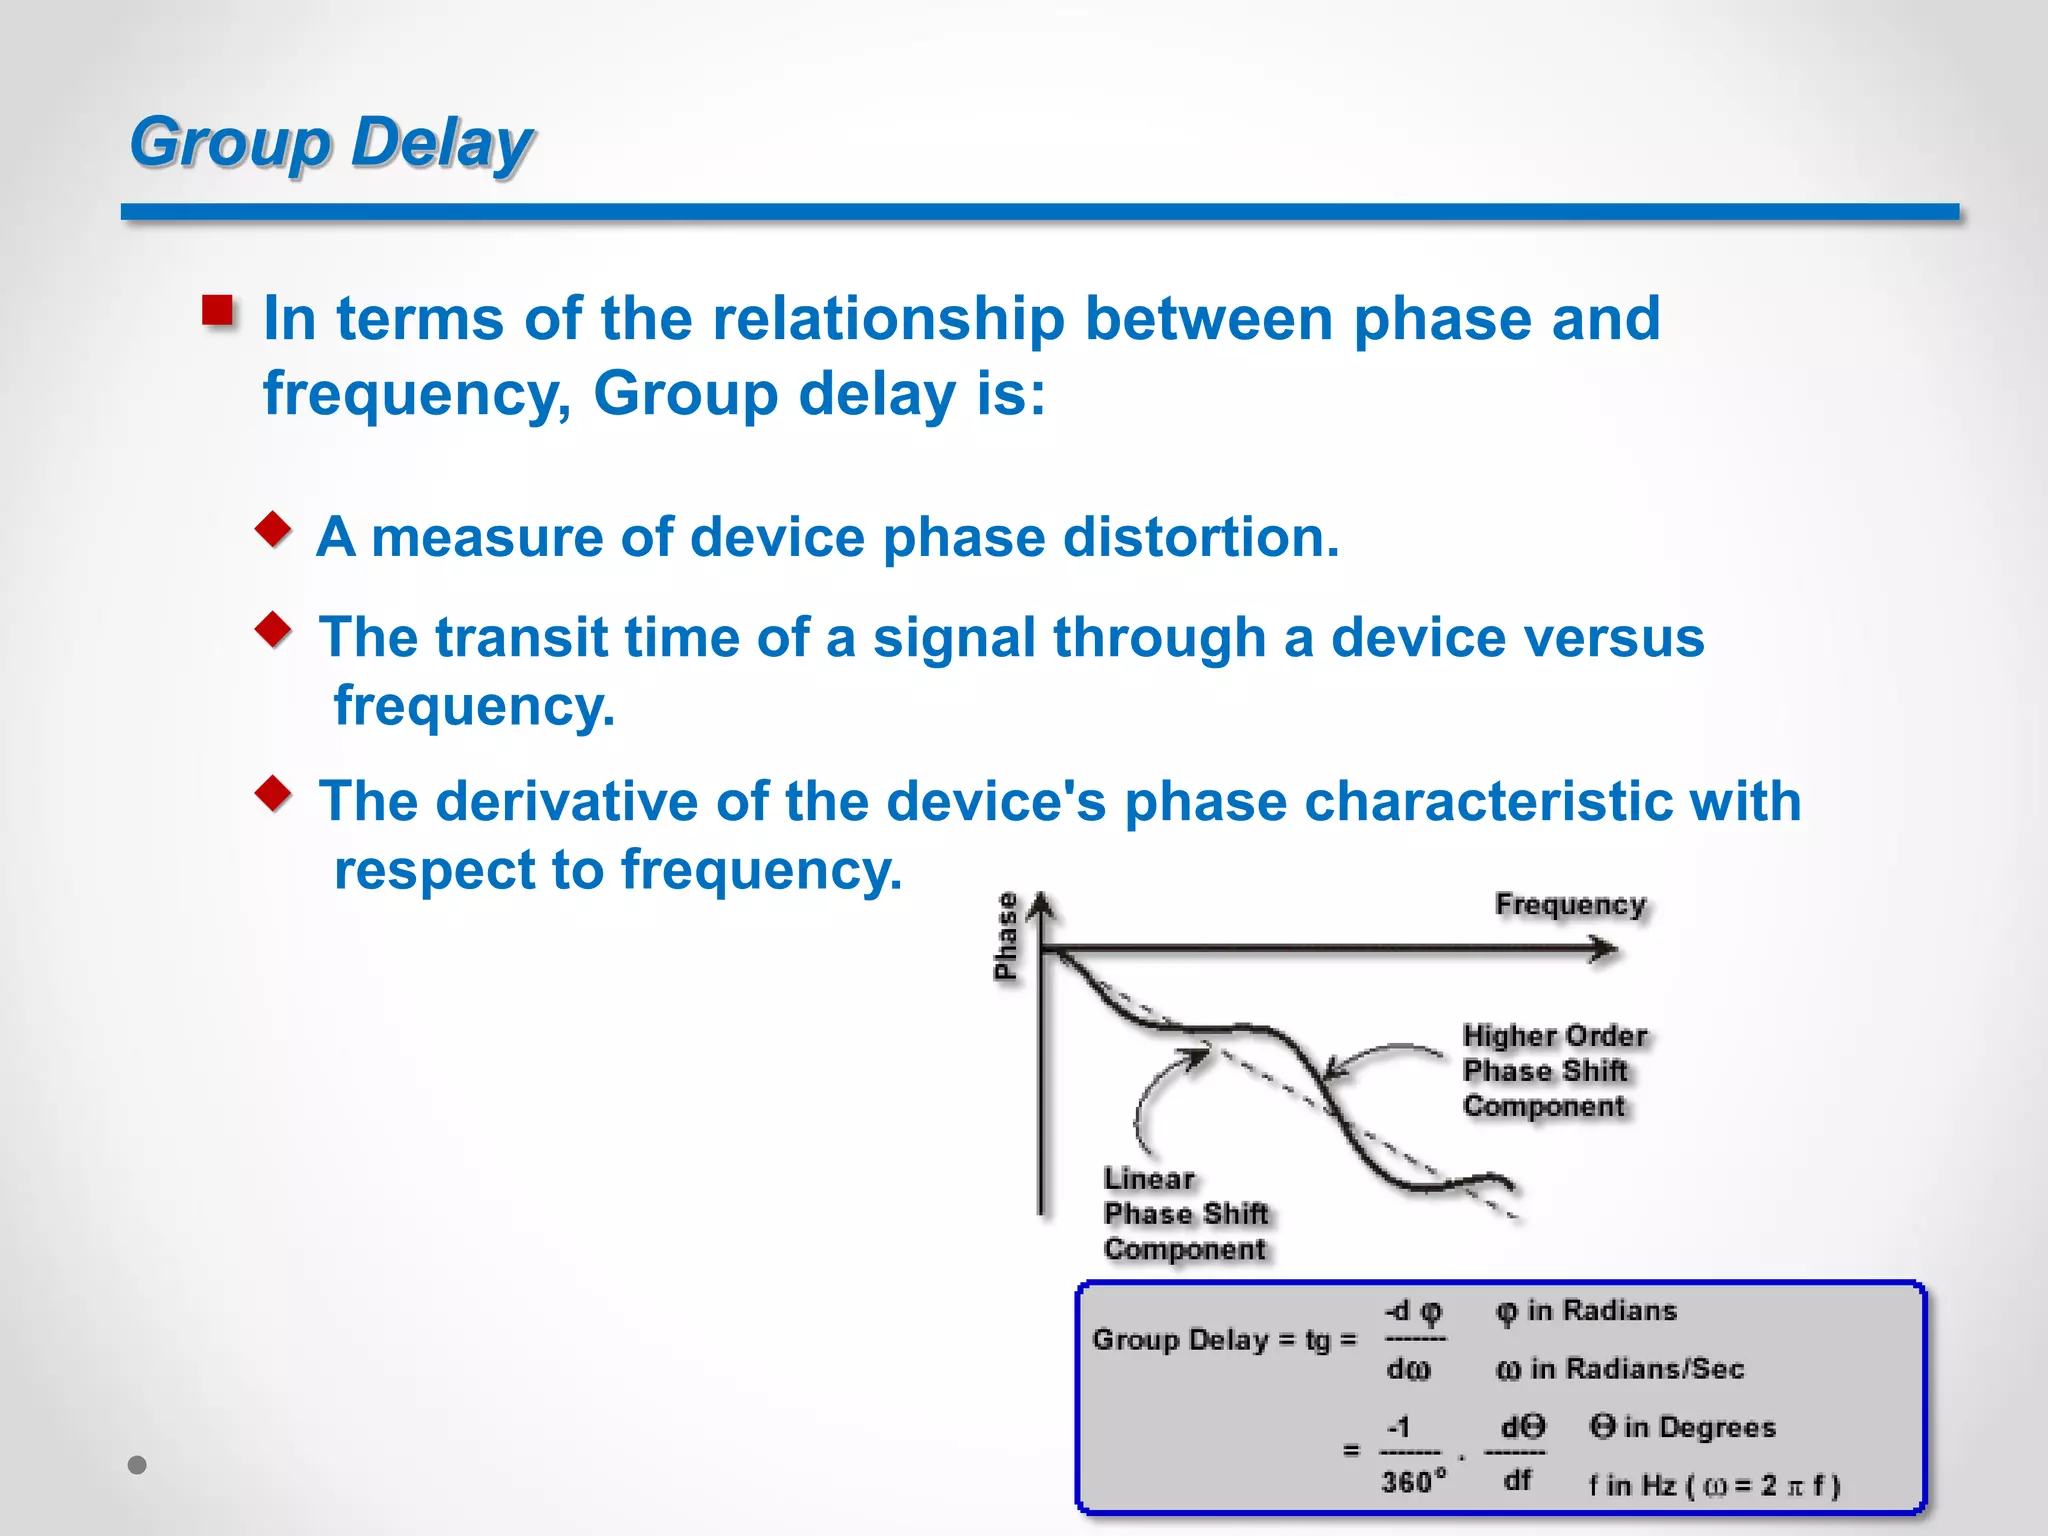
![Group Delay
Clearly we cannot have a filter output appearing before
its input, so the signal must have a positive delay[6] :
Input Output
Time
Filter
Besides, any signal contains harmonics. That is, any
signal is composed of several signals with different
frequencies. If all these signals don’t have the identical
delay, there will be group delay.](https://image.slidesharecdn.com/evmdegradationinltesystemsbyrffiltering-161212112208/75/EVM-Degradation-in-LTE-systems-by-RF-Filtering-17-2048.jpg)
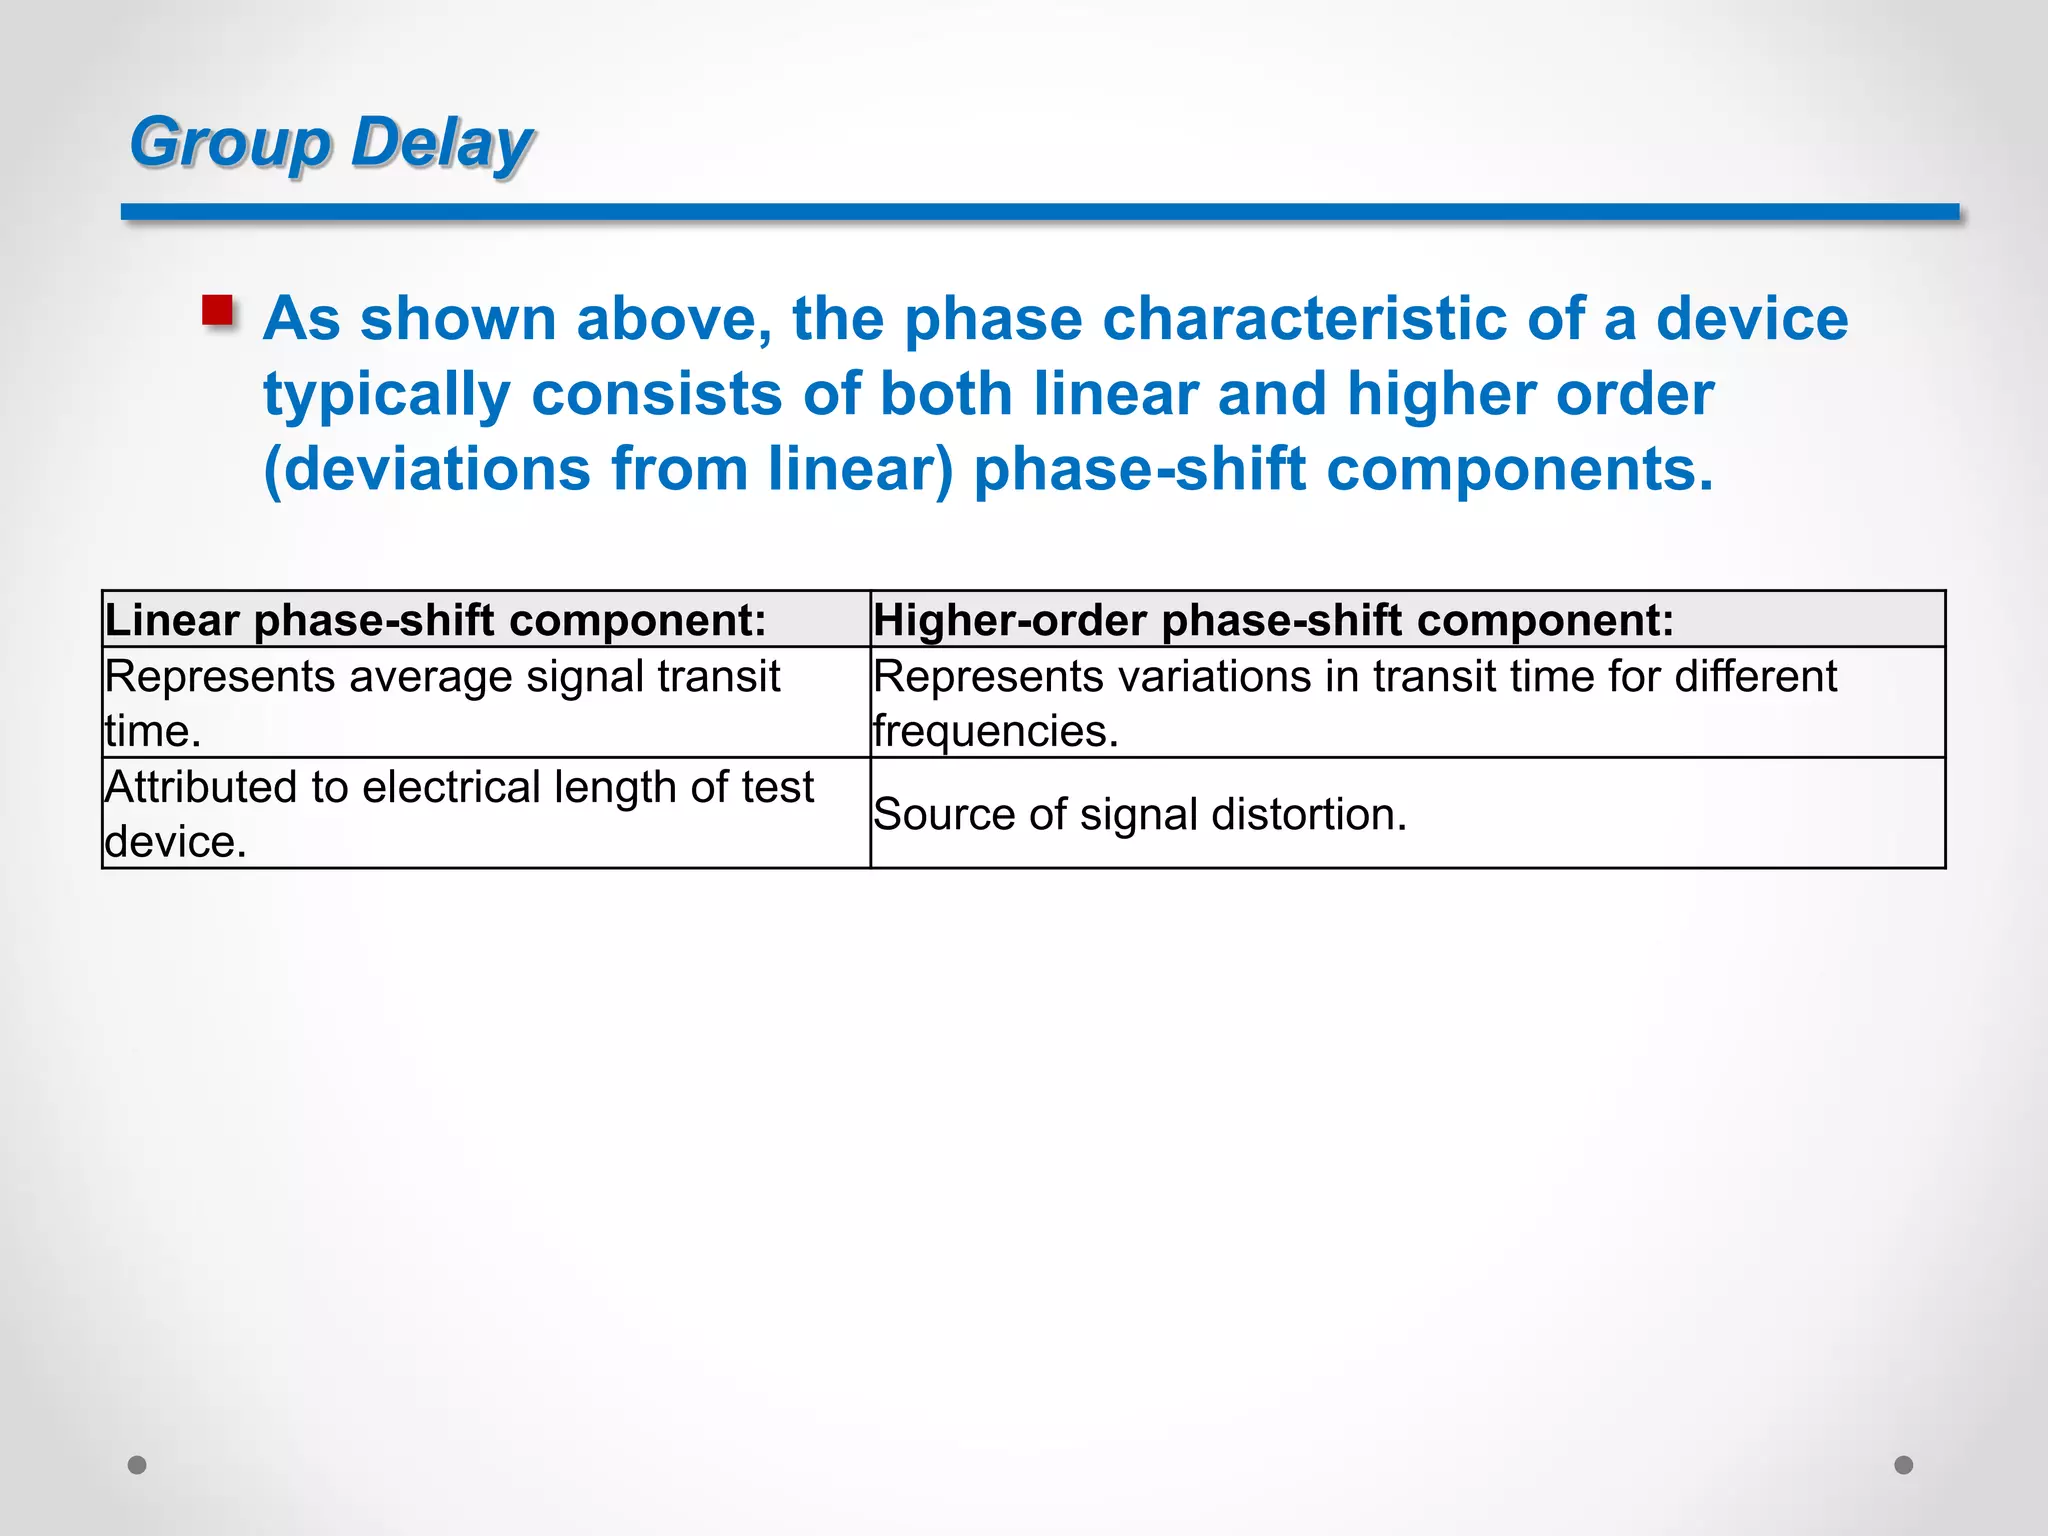
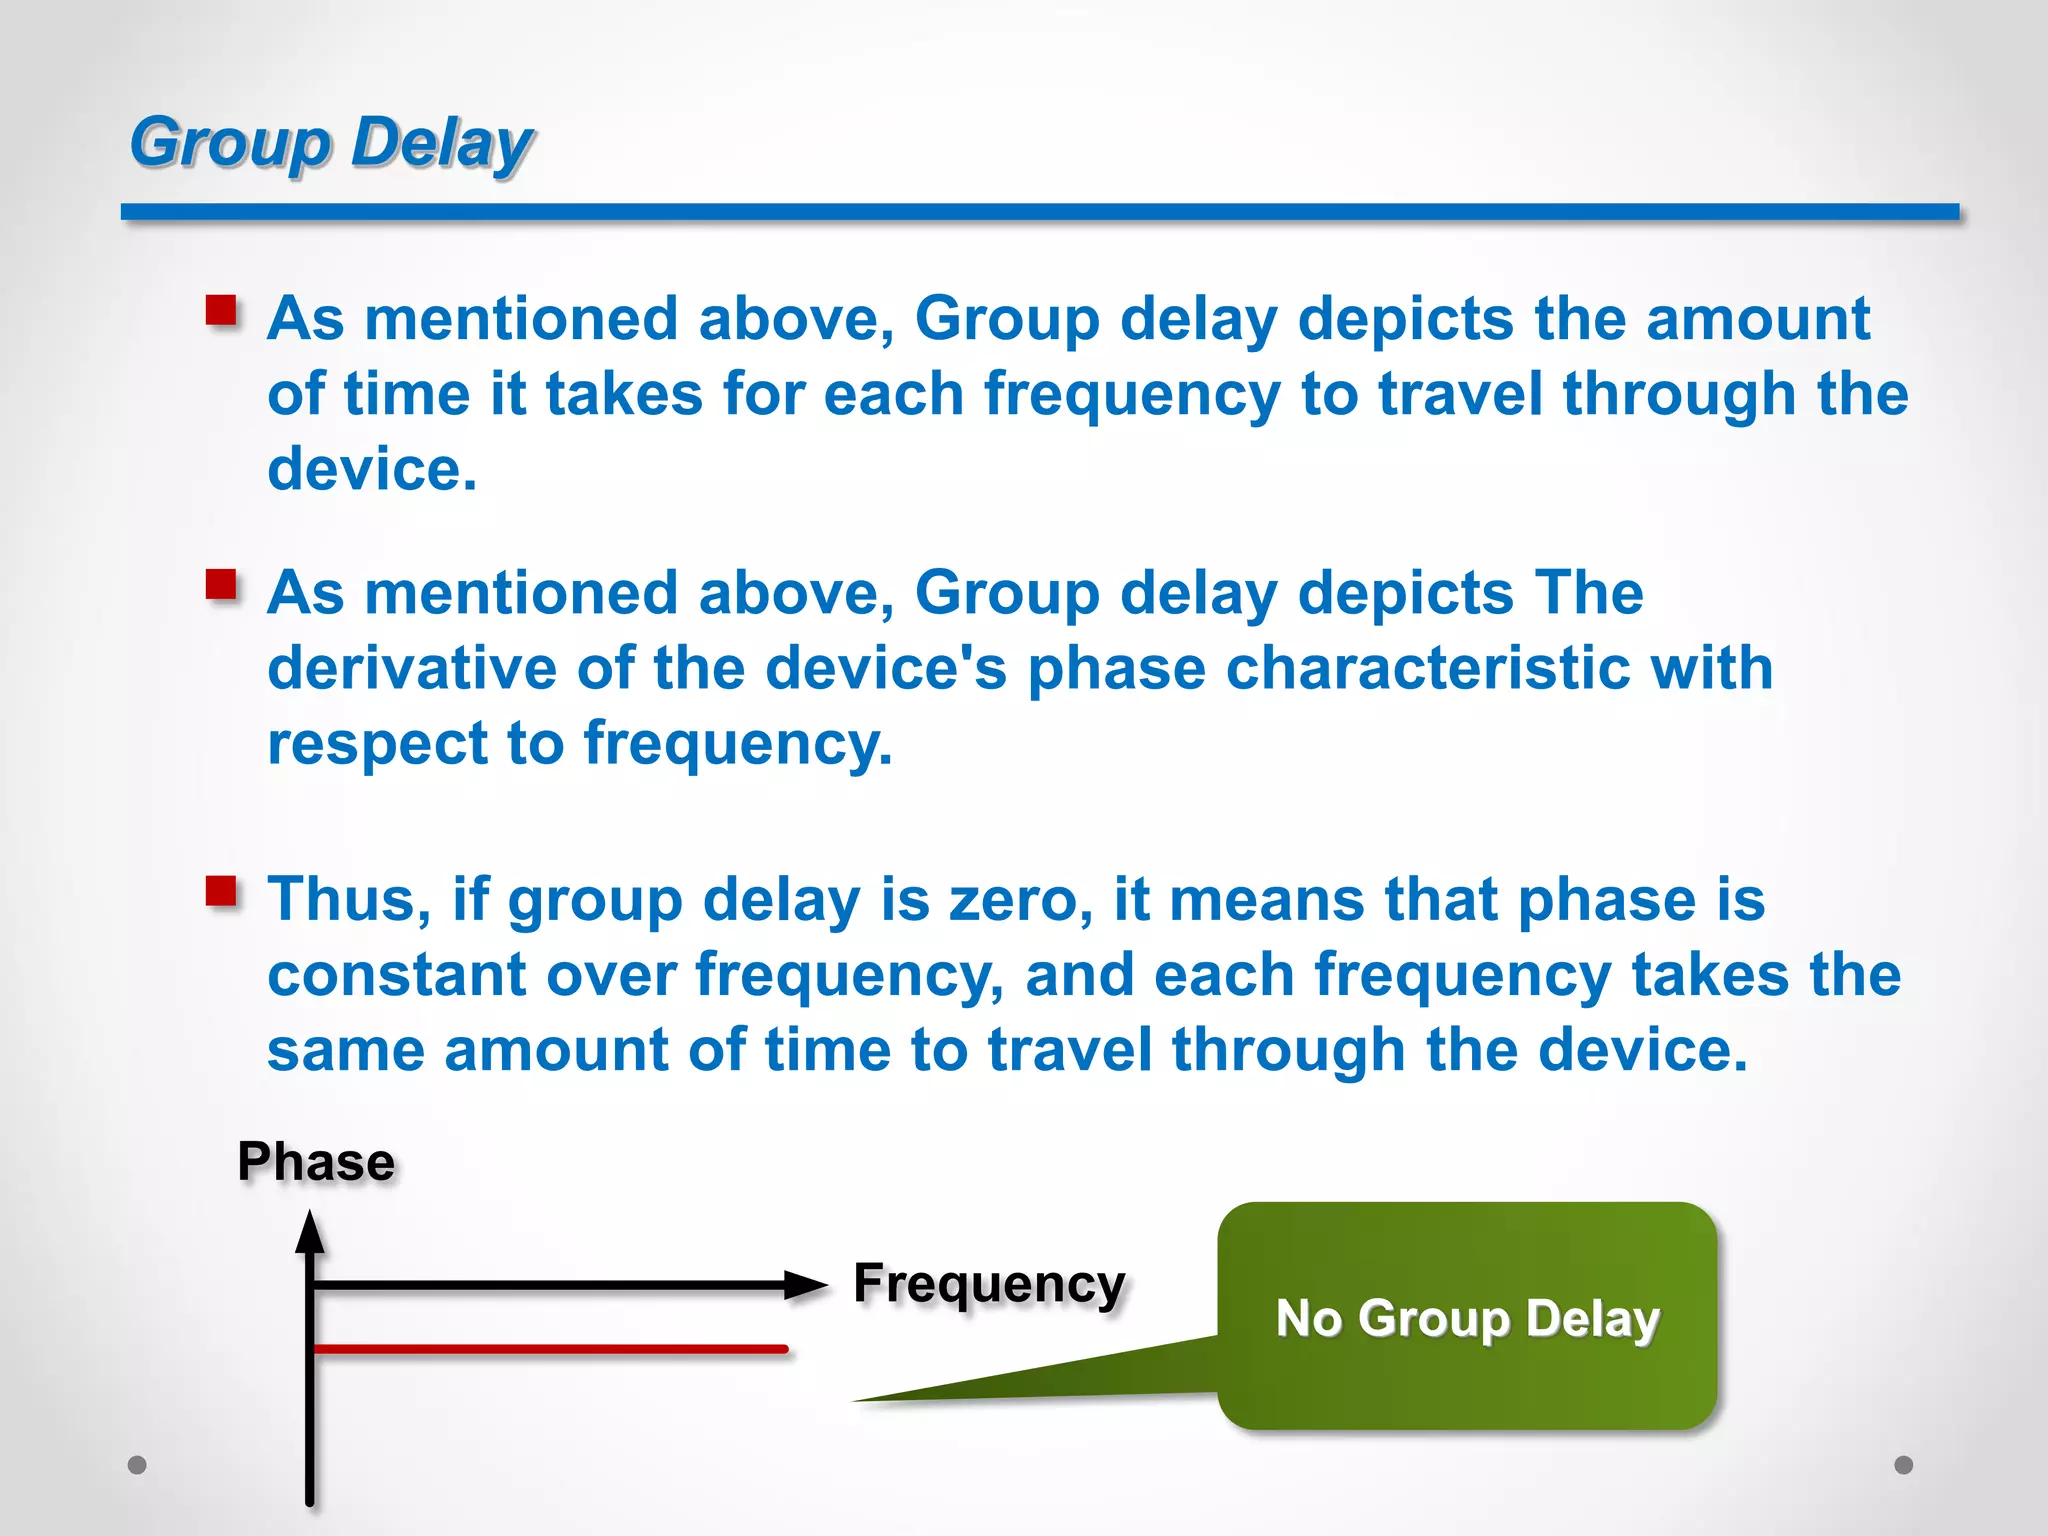
![Group Delay
But, actually, there must be group delay. The phase is
never constant over frequency, and each frequency
never takes the same amount of time to travel through
the device. Phase
Frequency
Slope = Group Delay
Nevertheless, what really matters is not only group
delay, but also group delay variation, which will cause
distortion of the signal waveform[6].](https://image.slidesharecdn.com/evmdegradationinltesystemsbyrffiltering-161212112208/75/EVM-Degradation-in-LTE-systems-by-RF-Filtering-22-2048.jpg)
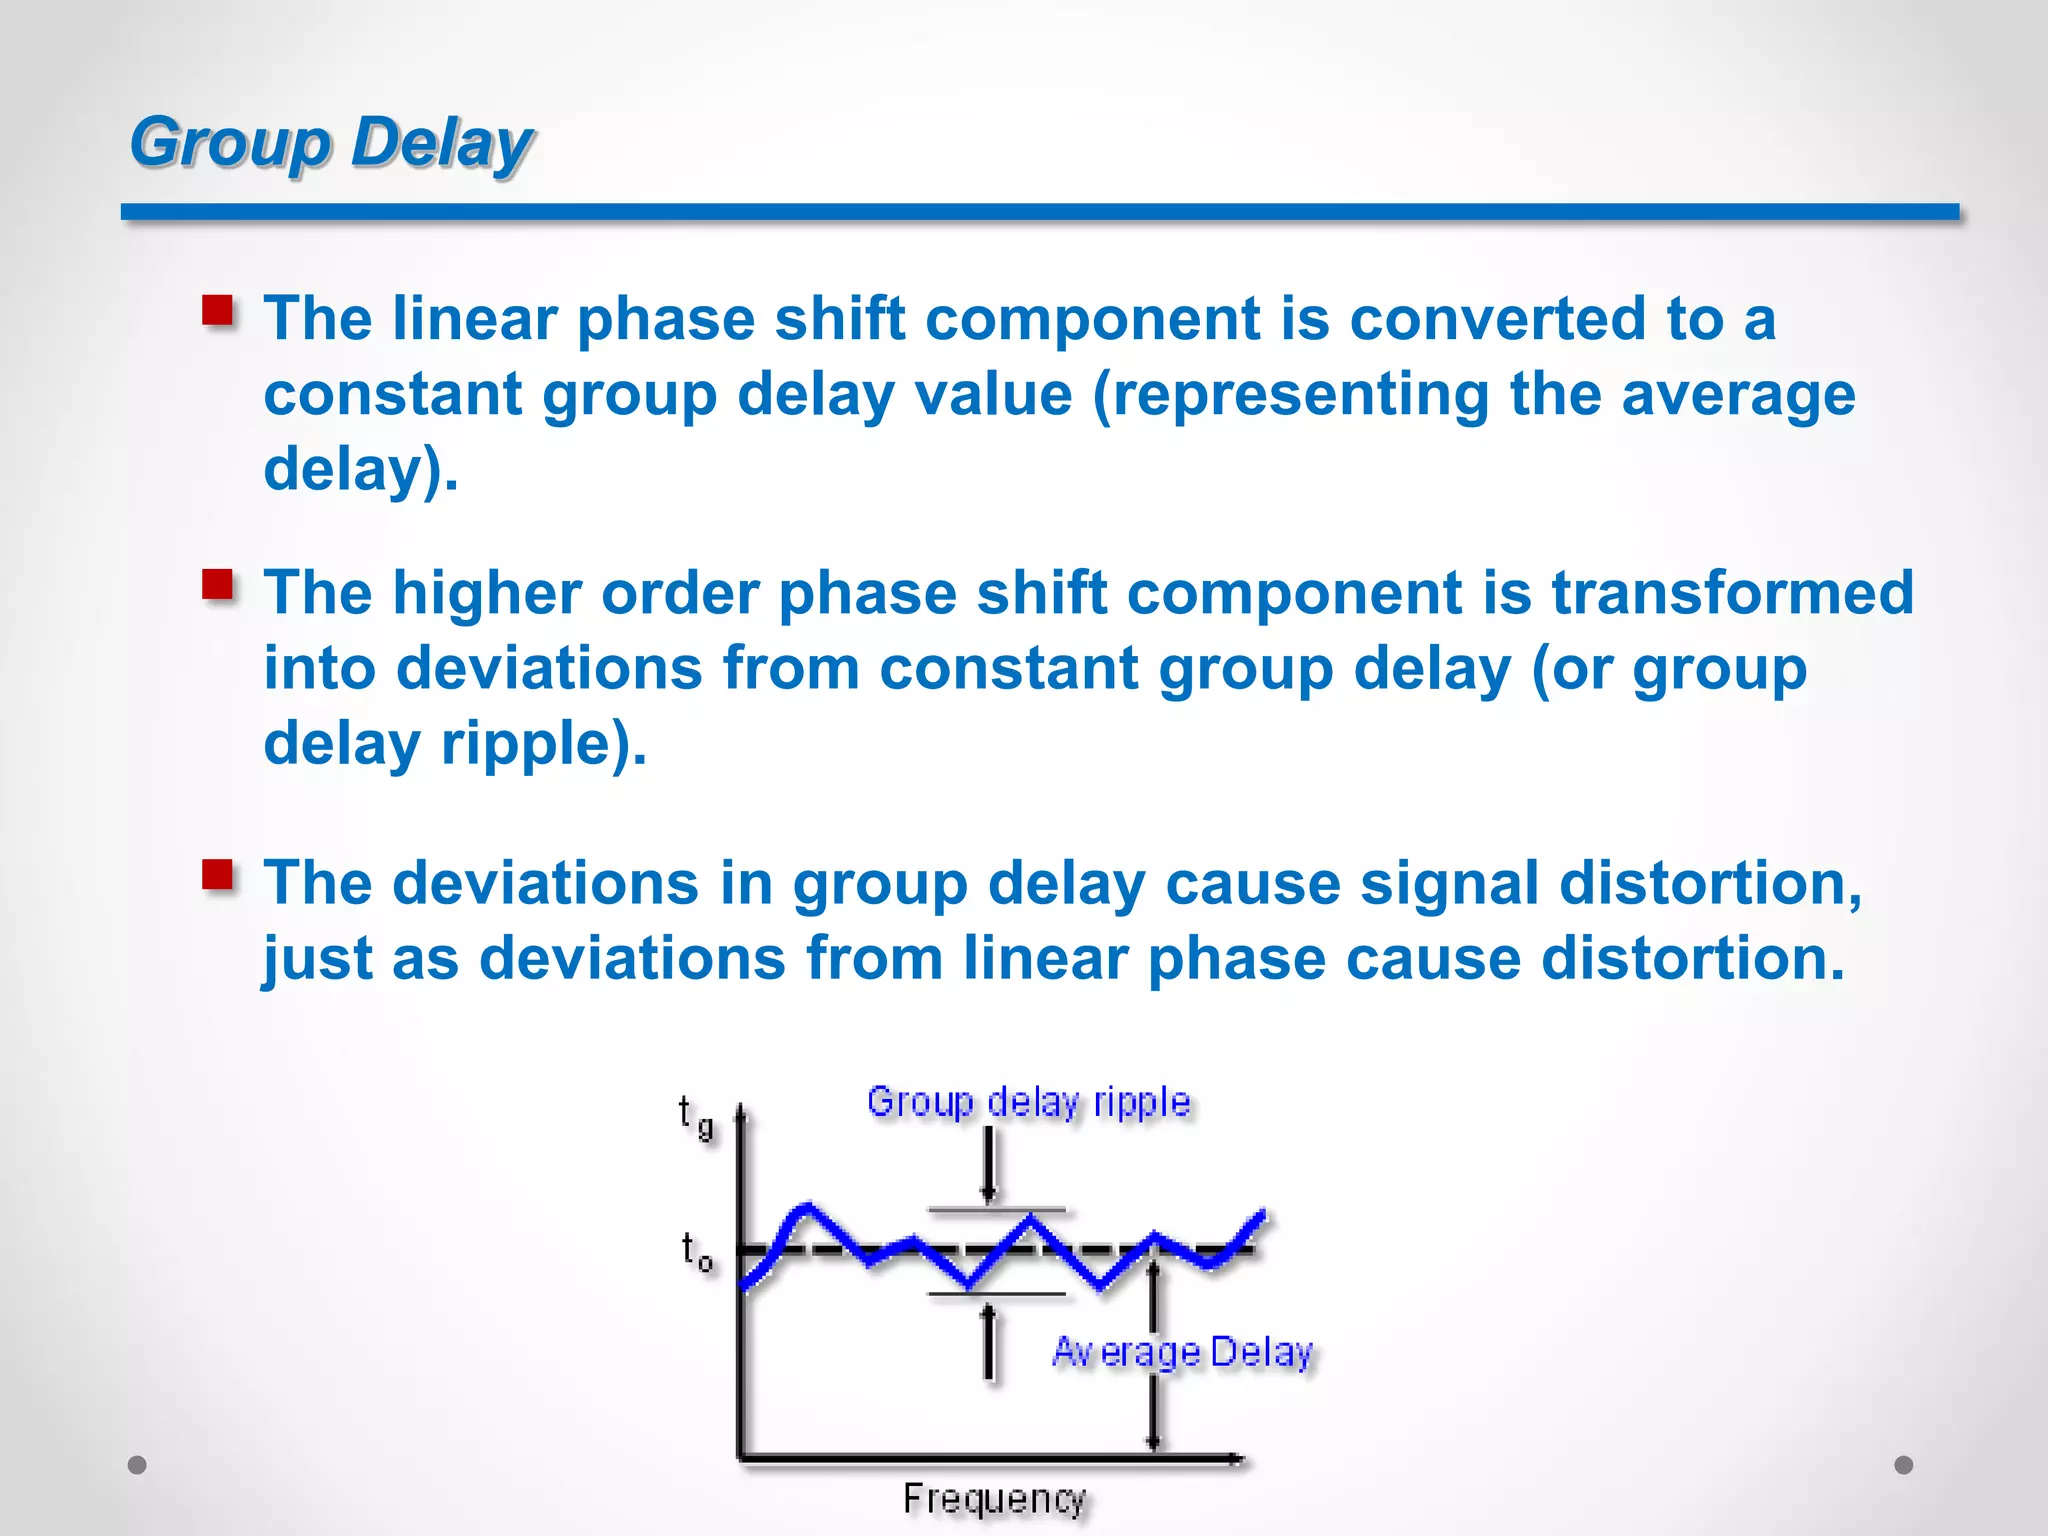
![Group Delay
Usually, large group delay variation appears near the
transition region in frequency response, leading to
distortion of the signal waveform[6].](https://image.slidesharecdn.com/evmdegradationinltesystemsbyrffiltering-161212112208/75/EVM-Degradation-in-LTE-systems-by-RF-Filtering-23-2048.jpg)
![EVM
The total EVM of an LTE signal is calculated as[1] :
EVM is the rms EVM across all RBs in the LTE signal
EVMi is the EVM measured across the i th RB
N is the number of RBs in the LTE signal](https://image.slidesharecdn.com/evmdegradationinltesystemsbyrffiltering-161212112208/75/EVM-Degradation-in-LTE-systems-by-RF-Filtering-24-2048.jpg)
![EVM
Using this method the EVM of the i th RB can be
calculated as follows[1]:
∆α is the effective magnitude ripple across the i th RB of
the filter’s pass band.
∆ø is the effective phase ripple across the i th RB of the
filter’s pass band,
Filter](https://image.slidesharecdn.com/evmdegradationinltesystemsbyrffiltering-161212112208/75/EVM-Degradation-in-LTE-systems-by-RF-Filtering-25-2048.jpg)
![EVM
Let’s inject a LTE Downlink Signal (with Subcarrier
Modulation = 64QAM, Source Power = 0 dBm) into a
filter[1] :
Filter](https://image.slidesharecdn.com/evmdegradationinltesystemsbyrffiltering-161212112208/75/EVM-Degradation-in-LTE-systems-by-RF-Filtering-26-2048.jpg)
![EVM
By far the worst result was the 15 MHz bandwidth case
due to the fact that the bandwidth of the signal (15 MHz)
was greater than the bandwidth of the filter (14.6 MHz),
causing part of the signal’s spectrum to be rejected by
the filter. As a result a higher EVM reading is not
surprising[1].
15 MHz
14.6 MHz](https://image.slidesharecdn.com/evmdegradationinltesystemsbyrffiltering-161212112208/75/EVM-Degradation-in-LTE-systems-by-RF-Filtering-27-2048.jpg)
![Green = wideband Filter
Red = legacy Filter
Blue = predistorted waveform
EVM
During pre-distortion, the signal bandwidth will
increases. If the filter’s bandwidth is not wide enough,
the pre-distorted waveform will be truncated, as marked
yellow in the photo below, thereby distorting waveform
and leading to EVM issue[17].
PA
Real PA
DPD
Predistorter](https://image.slidesharecdn.com/evmdegradationinltesystemsbyrffiltering-161212112208/75/EVM-Degradation-in-LTE-systems-by-RF-Filtering-28-2048.jpg)
![EVM
Except 15 MHz, the EVM results for the other signal
bandwidths show a clear trend: the wider the
bandwidth of the signal, the lower the measured EVM
rise[1].
Because a narrowband LTE signal, a greater proportion
of the signal’s RBs lies near the band edge of the filter,
where the group delay variation is greatest, leading to
distortion of the signal waveform. As a result the
average RB EVM level will be higher, leading to a higher
EVM level for the signal as a whole[1].
Bandwidth (MHz) 1.4 3 5 10 15
EVM (%) 0.39 0.22 0.17 0.15 1](https://image.slidesharecdn.com/evmdegradationinltesystemsbyrffiltering-161212112208/75/EVM-Degradation-in-LTE-systems-by-RF-Filtering-29-2048.jpg)
![EVM
For instance, a 1.4 MHz bandwidth signal is near band
edge. If 3 RBs are contaminated by large group delay
variation, it means that 50% RBs (3/6 = 50%) have poor
EVM, thereby making EVM of the whole signal poor.
1.4 MHz
Pass band
Conversely, a 10 MHz bandwidth signal is near band
edge. Even though 5 RBs are contaminated by large
group delay variation, it means that only 10% RBs
(5/50 = 10%) have poor EVM, thereby making EVM of the
whole signal still good[1].
10 MHz
Pass band
RB with good EVM
RB with poor EVM](https://image.slidesharecdn.com/evmdegradationinltesystemsbyrffiltering-161212112208/75/EVM-Degradation-in-LTE-systems-by-RF-Filtering-30-2048.jpg)
![EVM
As mentioned above, we know that if a signal with
narrow bandwidth is near band edge of filter, the EVM
aggravates[1].
EVM Rise of LTE Downlink Signal vs. Carrier Frequency
(Signal Bandwidth = 1.4 MHz, Source Power = 0 dBm)
As shown below, near the band edge of the filter’s pass
band, the group delay variation was more severe.
Consequently the EVM rise in this frequency range was
somewhat higher.](https://image.slidesharecdn.com/evmdegradationinltesystemsbyrffiltering-161212112208/75/EVM-Degradation-in-LTE-systems-by-RF-Filtering-31-2048.jpg)
![EVM
In terms of RX signal, the higher the EVM is, the higher
symbol error rate will be, thereby aggravating
sensitivity[18].
Consequently, the filter should be wideband. Even
though the high channel, it’s still NOT near band edge.
Pass band](https://image.slidesharecdn.com/evmdegradationinltesystemsbyrffiltering-161212112208/75/EVM-Degradation-in-LTE-systems-by-RF-Filtering-32-2048.jpg)
![EVM
Nevertheless, the filter’s frequency response will shift
in high temperature. That is, even though the high
channel is not near band edge in normal temperature.
But in high temperature, the high channel may be near
band edge, thereby aggravating EVM.
Normal Temperature
High Temperature
Consequently, when selecting filter, pay attention to not
only bandwidth, but also its frequency response
variation in high temperature[19].](https://image.slidesharecdn.com/evmdegradationinltesystemsbyrffiltering-161212112208/75/EVM-Degradation-in-LTE-systems-by-RF-Filtering-33-2048.jpg)
![Reference
[1] EVM Degradation in LTE Systems by RF Filtering
[2] LTE OFDM Technology
[3] UMTS Long Term Evolution(LTE) - Technology Introduction, Application Note, Rohde &
Schwarz
[4] LTE Physical Layer Overview, Keysight
[5] Synchronization Signals (PSS and SSS)
[6] Group Delay Explanations and Applications
[7] The Mobile Broadband Standard, 3GPP
[8] Difference Between OFDM and OFDMA
[9] LTE Uplink Transmission Scheme
[10] The OFDM Challenge
[11] OFDM and Multi-Channel Communication Systems, National Instruments
[12] 4G Broadband-what you need to know about LTE
[13] LTE Radio Interface (OFDM,OFDMA,SC-FDMA)
[14] 3GPP LTE - Evolved UTRA - Radio Interface Concepts
[15] PAPR Reduction in MIMO-OFDM Systems Using PTS Method
[16] PAPR Reduction Method for OFDM Systems without Side Information
[17] QFE1100 PA Power Management IC Training Slides, Qualcomm](https://image.slidesharecdn.com/evmdegradationinltesystemsbyrffiltering-161212112208/75/EVM-Degradation-in-LTE-systems-by-RF-Filtering-34-2048.jpg)
![[18] Receiver Optimization Using Error Vector Magnitude Analysis
[19] Temperature-Compensated Filter Technologies Solve Crowded Spectrum Challenges](https://image.slidesharecdn.com/evmdegradationinltesystemsbyrffiltering-161212112208/75/EVM-Degradation-in-LTE-systems-by-RF-Filtering-35-2048.jpg)

This document discusses OFDM, OFDMA, and SC-FDMA techniques used in LTE. It explains that LTE uses OFDM for the downlink to transmit over multiple narrow subcarriers to overcome multipath fading. OFDMA is used to enable time-frequency scheduling by allocating users to subsets of subcarriers. SC-FDMA is used for the uplink instead of OFDMA to reduce high peak-to-average power ratios. Resource blocks, which are the smallest allocable units, occupy 180kHz frequency bandwidth and 0.5ms time slots. Filter selection impacts error vector magnitude, and filters should have wide bandwidth and stable frequency response even at high temperatures to avoid signal distortion near band edges