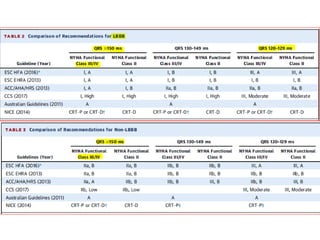
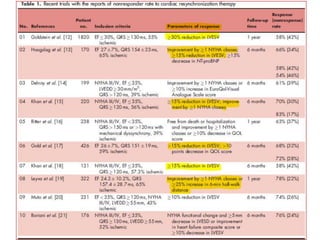
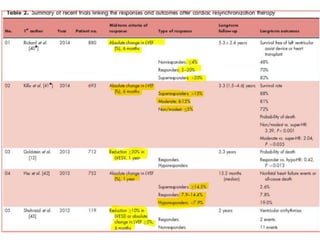
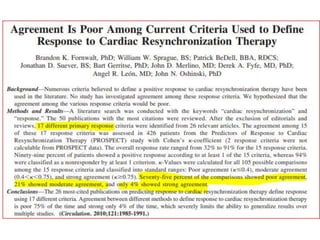
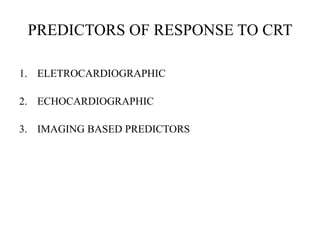
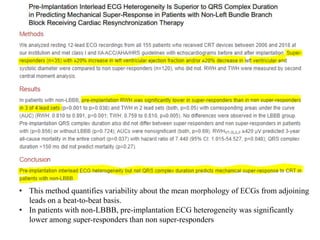
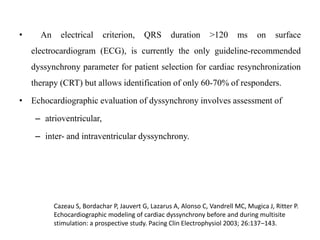
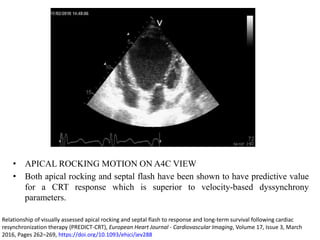
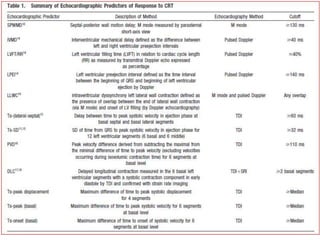
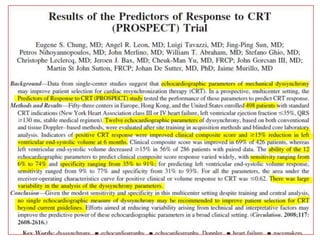
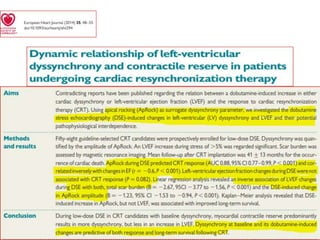
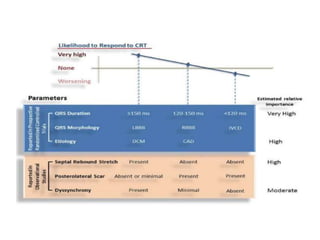
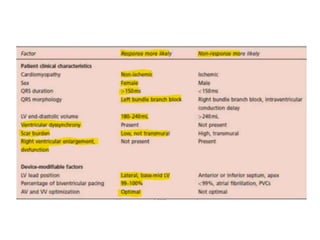
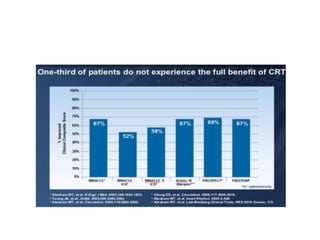
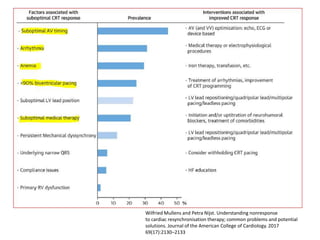
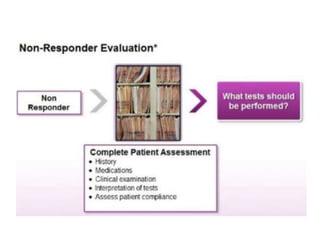
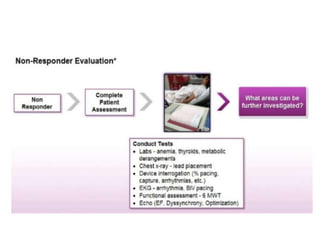
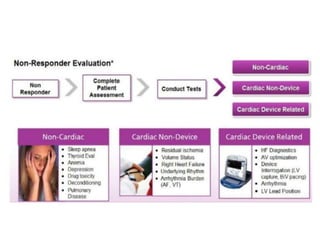
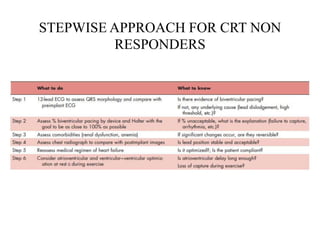
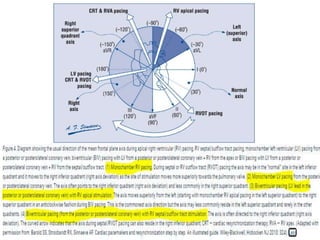
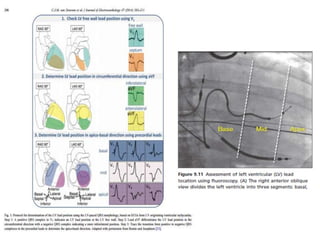
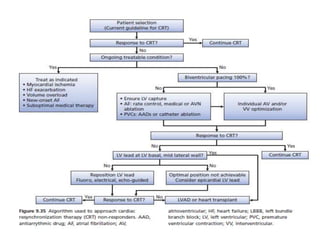
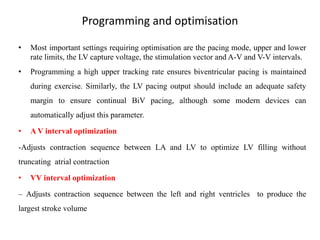
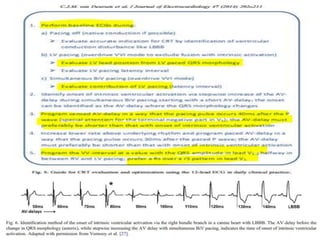
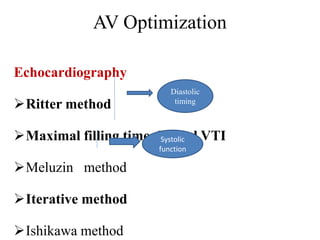
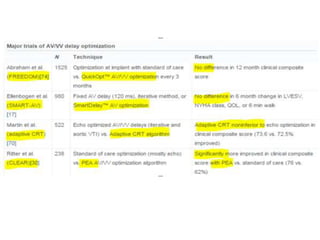
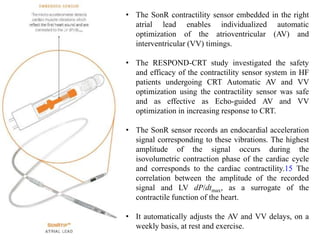
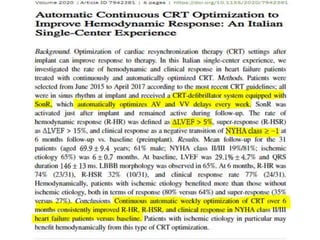
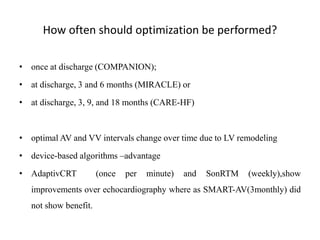
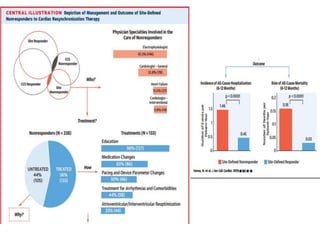
CRT RESPONDERS AND
NONRESPONDERS
AJAY PRATAP SINGH
DEPARTMENT OF CARDIOLOGY
DR. RAM MANOHAR LOHIA HOSPITAL, NEW DELHI.
• CCS is an established standard for assessment of heart failure
patients that includes subjective measures of New York Heart
Association (NYHA) functional class and patient global assessment
combined with objective measures of heart failure events and
cardiovascular death
PREDICTORS OF RESPONSE TO CRT
1. ELETROCARDIOGRAPHIC
2. ECHOCARDIOGRAPHIC
3. IMAGING BASED PREDICTORS
ELECTROCARDIOGRAPHIC
PREDICTORS OF CRT RESPONSE
The Data Supplement is available at https://www.ahajournals.org/doi/suppl/
10.1161/CIRCEP.118.006497
• This method quantifies variability about the mean morphology of ECGs from adjoining
leads on a beat-to-beat basis.
• In patients with non-LBBB, pre-implantation ECG heterogeneity was significantly
lower among super-responders than non super-responders
ECHOCARDIOGRAPHIC PARAMETERS
• An electrical criterion, QRS duration >120 ms on surface
electrocardiogram (ECG), is currently the only guideline-recommended
dyssynchrony parameter for patient selection for cardiac resynchronization
therapy (CRT) but allows identification of only 60-70% of responders.
• Echocardiographic evaluation of dyssynchrony involves assessment of
– atrioventricular,
– inter- and intraventricular dyssynchrony.
Cazeau S, Bordachar P, Jauvert G, Lazarus A, Alonso C, Vandrell MC, Mugica J, Ritter P.
Echocardiographic modeling of cardiac dyssynchrony before and during multisite
stimulation: a prospective study. Pacing Clin Electrophysiol 2003; 26:137–143.
• Atrioventricular dyssynchrony can be assessed by using pulsed-wave
Doppler recording of transmitral flow. Diastolic filling time (LVFT),
defined as the sum of E-wave and A-wave duration, is divided by the RR
interval duration (Figure 1) to obtain a diastolic filling ratio (LVFT/RR).
• Significant atrioventricular dyssynchrony is assumed if LVFT/RR is <40%.
Cleland JG, Daubert JC, Erdmann E, Freemantle N, Gras D,
Kappenberger L, Klein W, Tavazzi L; CARE-HF study Steering
Committee and Investigators. The CARE-HF study (CArdiac
REsynchronisation in Heart Failure study): rationale, design
and end-points. Eur J Heart Fail. 2001;3(4):481-9.
• Interventricular dyssynchrony refers to dyssynchrony between the left and
the right ventricle and can be measured using conventional pulsed-wave
Doppler or Tissue Doppler imaging
The presence of inter-ventricular dyssynchrony is indicated by the difference of
>40 ms between left ventricular and right ventricular pre-ejection time (measured
by pulsed-wave Doppler) or by a delay of >56 ms between the onset of systolic
motion in the basal right ventricular free wall versus the most delayed basal LV
segment (measured by tissue Doppler).
Penicka M, Bartunek J, De Bruyne B, Vanderheyden M, Goethals M, De Zutter M, Brugada P, Geelen P. Improvement of left ventricular function
after cardiac resynchronization therapy is predicted by tissue Doppler imaging echocardiography. Circulation. 2004;109(8):978-83.
• Intraventricular dyssynchrony can be evaluated by conventional
echocardiography, tissue velocity measurements and deformation imaging
• Conventional echocardiographic markers of dyssynchrony comprise:
- septal to posterior wall motion delay (cut-off >130 ms) and
- left ventricular electromechanical delay (cut-off >140 ms)
Septal to posterior wall motion delay is assessed by M-mode echocardiography from
parasternal short-axis view at the papillary muscle level. It is calculated as the interval
between the maximal posterior displacement of the septum and the maximal
displacement of the left posterior wall
Pitzalis MV, Iacoviello M, Romito R, Massari F, Rizzon B, Luzzi G, Guida P, Andriani A, Mastropasqua F, Rizzon P. Cardiac
resynchronization therapy tailored by echocardiographic evaluation of ventricular asynchrony. J Am Coll Cardiol.
2002;40(9):1615-22.
• Tissue velocity imaging
– With tissue velocity imaging, longitudinal velocities of basal (or basal and mid) myocardial
segments are measured from standard apical views.
– Tissue velocity- derived dyssynchrony parameters can be broadly divided into:
• time delays between opposing walls and
• standard deviations of time-to-peak systolic velocities.
• Deformation imaging
– In contrast to the timing of myocardial velocity peaks, myocardial deformation parameters
(strain, strain rate) have the potential of distinguishing active contraction from passive motion
caused by tethering of adjacent myocardial regions. Deformation data can be obtained from
color Tissue Doppler or two-dimensional speckle tracking images.
At present, the difference ≥130 ms in
peak radial strain between the basal
anteroseptal and basal posterior wall
segments is one of most commonly
used speckle tracking-based
dyssynchrony parameter
• Apical rocking and septal flash : The direct mechanical consequences of dyssynchronous
contraction induced by left bundle branch block can be described by apical rocking and
septal flash.
• An early electrical activation of the septum results in a short initial septal contraction and
causes the apex to move septally while the septum moves leftward (SF, yellow arrow in
the middle panel). The delayed activation of the lateral wall pulls then the apex laterally
during the ejection phase while stretching the septum. This typical sequence of the septal-
to-lateral apex motion is described as ‘ ApRock’. The septal inward motion is described as
‘SF’
• APICAL ROCKING MOTION ON A4C VIEW
• Both apical rocking and septal flash have been shown to have predictive value
for a CRT response which is superior to velocity-based dyssynchrony
parameters.
Relationship of visually assessed apical rocking and septal flash to response and long-term survival following cardiac
resynchronization therapy (PREDICT-CRT), European Heart Journal - Cardiovascular Imaging, Volume 17, Issue 3, March
2016, Pages 262–269, https://doi.org/10.1093/ehjci/jev288
• CMR has gained increasing attention for dyssynchrony assessment because
of its high tissue and spatial contrast, coupled with highly accurate and
reproducible assessment of LV volume and functional indexes
ADVANTAGE DISADVANTAGE
• High spatial resolution and tissue
characterization, in addition to
highly accurate quantification of
chamber size and ventricular
function and 3-dimensional
assessment of myocardial strain
• CMR has high reproducibility
owing largely to tomographic
imaging with less operator
dependency
• Long acquisition times, implanted
cardiac devices as magnetic
resonance hazards, and complex
post-processing techniques
• Cine MRI is acquired routinely, it is not particularly optimized for evaluation of
regional dyssynchrony. More direct methods have been developed that provide
more accurate and direct assessment of intramyocardial deformation
– myocardial tagging,(analogous to speckle tracking by echocardiography but
with higher spatial resolution and reproducibility)
– strain-encoded MRI (SENC)(involves using sinusoidal “tagged” surfaces that
modulate longitudinal magnetization perpendicular to the imaging plane.)
– phase-contrast MRI, and (Phase-contrast velocity mapping uses the shift in
phase of the myocardium between 2 opposing pulse gradients, which is
proportional to the velocity of the myocardium)
– displacement encoding with stimulated echoes (DENSE)
Wilfried Mullens and Petra Nijst. Understanding nonresponse
to cardiac resynchronisation therapy; common problems and potential
solutions. Journal of the American College of Cardiology. 2017
69(17):2130–2133
STEPWISE APPROACH FOR CRT NON
RESPONDERS
Presence of AF or VPCs
• Newly onset episodes of paroxysmal or persistent AF are associated with worse
outcome in CRT patients.AF often leads to tachycardia with loss of LV capture or
fusion/ pseudofusion beats with ineffective resynchronization.
• If rhythm control is failing with cardioversion and/or antiarrhythmic therapy, it is
crucial to control the ventricular rate in order to ensure biventricular capture
• Some patients require catheter RFA for VPC’s and atrioventricular (AV) node
ablation to ensure 100% ventricular pacing and this aggressive approach has been
shown to improve exercise tolerance, LV reverse remodeling, and LVEF with a
significant survival benefit in this patient population.
Marrouche NF, Brachmann J, Andresen D, Siebels J, Boersma L, Jordaens L, Merkely B, Pokushalov E, Sanders P, Proff J,
Schunkert H, Christ H, Vogt J, Bänsch D, CASTLE-AF Investigators (2018) Catheter ablation for atrial fibrillation with heart
failure. N Engl J Med 378:417–427
Programming and optimisation
• Most important settings requiring optimisation are the pacing mode, upper and lower
rate limits, the LV capture voltage, the stimulation vector and A-V and V-V intervals.
• Programming a high upper tracking rate ensures biventricular pacing is maintained
during exercise. Similarly, the LV pacing output should include an adequate safety
margin to ensure continual BiV pacing, although some modern devices can
automatically adjust this parameter.
• A V interval optimization
-Adjusts contraction sequence between LA and LV to optimize LV filling without
truncating atrial contraction
• VV interval optimization
– Adjusts contraction sequence between the left and right ventricles to produce the
largest stroke volume
AV Optimization
Echocardiography
Ritter method
Maximal filling time -Mitral VTI
Meluzin method
Iterative method
Ishikawa method
Diastolic
timing
Systolic
function
RITER’S METHOD
The MIRACLE trial optimized the AV interval with this method..
Measure the time from onset of QRS complex to time of termination of the A-wave
(QA interval) is measured at both a long (AVlong) and a short AV delays (AVshort).
The optimal AV delay is calculated from following formula:
AVopt = AV long - (QA short – QA long).
Iterative method
• Most common echocardiographic optimization technique.
• Used in the CARE-HF and the SMART-AV trials
• In both LVOT and Transmitral VTI methods , A-V delay leading to max
value is used as the optimum A-V delay.
• Both the method depends on minimizing the diastolic MR for optimal A-V
delay.
OTHER METHODS FOR A-V OPTIMIZATION
1. Impedance cardiography (IC) uses changes in transthoracic impedance to
estimate stroke volume.
– changes in thoracic impedance are caused by the systolic aortic flow
and on this basis the system calculates stroke volume and CO on a
beat-to-beat basis from the TIC signal.
2. FFPG allows measurement of changes in peripheral pulse pressure- correlate
reasonably with measured central aortic pressure.
• Optimal AV delay, defined as that producing the greatest change in pulse
pressure, was identical using either FFPG or central aortic pressure
• MOST RECENT TRIAL VALIDATING THIS PLETHYMOGRAPHY
BASED OPTIMIZATION IS BRAVO TRIAL (2019) WHICH SHOWED
IT TO BE NON INFERIOR TO ECHO BASED OPTIMIZATION.
3. Acoustic cardiography is another relatively new technique for AV
optimization. This technology integrates the surface electrocardiogram and heart
sound data to measure the intensity of S3, the electromechanical activation time
(EMAT, representing the time from the QRS onset to S1), and LV systolic time
(LVST, the time interval from S1 to S2).
– Changes in each parameter can indicate worsening heart failure: an increase
in S3 suggestive of increased left ventricular filling pressure,
– prolongation of EMAT indicative of reduced LV contractility,
– and a reduced LVST suggestive of reduced systolic function.
– This was comparable to the mitral inflow method
VV Interval Optimization
Electrocardiogaphy
Echocardiography
– M mode
– LV outflow VTI
–Dyssynchrony assessment
– 3D echocardiography
LV dp/dt
Finger plethysmography
Device algorithms
The methods used for VV optimization may be
suboptimal to achieve adequate inter- and intra-
ventricular resynchronization. In almost all studies of
VV optimization, AV delay optimization was
performed first followed by VV optimization.
Magnitude of hemodynamic improvement with
optimized VV pacing may be too small to be
clinically meaningful.
It is has been repeatedly shown that the optimal
DEVICE BASED ALGORITHMS
• IEGM (INTRA CARDIAC ECG)-based AV delay algorithms are clearly desirable
given the potential for incorporation into device software for rapid optimization and
potentially continuous modification.
• Such technology could reduce costs, time, and the possibility of user error
introduced with more complex methods such as echocardiography
St.Jude- QUICK OPT
Boston-SMART DELAY.
Medtronic-ADAPTIVE
• The SonR contractility sensor embedded in the right
atrial lead enables individualized automatic
optimization of the atrioventricular (AV) and
interventricular (VV) timings.
• The RESPOND-CRT study investigated the safety
and efficacy of the contractility sensor system in HF
patients undergoing CRT Automatic AV and VV
optimization using the contractility sensor was safe
and as effective as Echo-guided AV and VV
optimization in increasing response to CRT.
• The SonR sensor records an endocardial acceleration
signal corresponding to these vibrations. The highest
amplitude of the signal occurs during the
isovolumetric contraction phase of the cardiac cycle
and corresponds to the cardiac contractility.15 The
correlation between the amplitude of the recorded
signal and LV dP/dtmax, as a surrogate of the
contractile function of the heart.
• It automatically adjusts the AV and VV delays, on a
weekly basis, at rest and exercise.
How often should optimization be performed?
• once at discharge (COMPANION);
• at discharge, 3 and 6 months (MIRACLE) or
• at discharge, 3, 9, and 18 months (CARE-HF)
• optimal AV and VV intervals change over time due to LV remodeling
• device-based algorithms –advantage
• AdaptivCRT (once per minute) and SonRTM (weekly),show
improvements over echocardiography where as SMART-AV(3monthly) did
not show benefit.
ADVANCE CRT TRIAL
OTHER METHODS TO PREVENT NON RESPONDERS
• Utilising appropriate LV lead technology and optimisation of the LV lead stimulation site
MSP can also be delivered via multipoint pacing (MPP). This technique utilises
quadripolar LV pacing leads which have four integrated pacing cathodes along the
course of the lead, allowing greater customisation from any of the of the 10–17 MPP
vectors available.
• Stimulation site : lateral free wall represents the most favourable target for LV lead
deployment, typically within the lateral or postero-lateral cardiac veins of the coronary
sinus
•
• The use of remote monitoring has been shown to improve clinical outcomes for patients
with heart failure one such device under study is only implantable technologies have also
been devised. The CardioMEMS Heart Failure system (Abbott
Medical Inc., Atlanta, GA, USA) is a wireless pulmonary artery haemodynamic monitor,
which provides an accurate assessment of real time pulmonary artery (PA) pressure,
allowing the physician to optimise pharmacotherapy. Use of this system was associated
with a 33% reduction in hospitalisations when compared to standard of care
Biventricular endocardial pacing
• Failure to implant an LV lead in a tributary of the
coronary sinus during a transvenous, epicardial CRT
procedure occurs in around 5–15% of cases
• BiV ENDO pacing is not reliant on the CS anatomy and
instead, operators can choose to deliver stimulation at any
site within the LV cavity. Wireless pacing systems which
can be delivered via a retrograde aortic approach
eliminate the need for central venous access in pt with
venous stenosis especially in pt getting upgradations.
The WiSE CRT wireless biventricular endocardial pacing system
THANK YOU

Crt responders vs non responders

  • 1.
    CRT RESPONDERS AND NONRESPONDERS AJAYPRATAP SINGH DEPARTMENT OF CARDIOLOGY DR. RAM MANOHAR LOHIA HOSPITAL, NEW DELHI.
  • 9.
    • CCS isan established standard for assessment of heart failure patients that includes subjective measures of New York Heart Association (NYHA) functional class and patient global assessment combined with objective measures of heart failure events and cardiovascular death
  • 10.
    PREDICTORS OF RESPONSETO CRT 1. ELETROCARDIOGRAPHIC 2. ECHOCARDIOGRAPHIC 3. IMAGING BASED PREDICTORS
  • 11.
  • 15.
    The Data Supplementis available at https://www.ahajournals.org/doi/suppl/ 10.1161/CIRCEP.118.006497
  • 16.
    • This methodquantifies variability about the mean morphology of ECGs from adjoining leads on a beat-to-beat basis. • In patients with non-LBBB, pre-implantation ECG heterogeneity was significantly lower among super-responders than non super-responders
  • 20.
  • 21.
    • An electricalcriterion, QRS duration >120 ms on surface electrocardiogram (ECG), is currently the only guideline-recommended dyssynchrony parameter for patient selection for cardiac resynchronization therapy (CRT) but allows identification of only 60-70% of responders. • Echocardiographic evaluation of dyssynchrony involves assessment of – atrioventricular, – inter- and intraventricular dyssynchrony. Cazeau S, Bordachar P, Jauvert G, Lazarus A, Alonso C, Vandrell MC, Mugica J, Ritter P. Echocardiographic modeling of cardiac dyssynchrony before and during multisite stimulation: a prospective study. Pacing Clin Electrophysiol 2003; 26:137–143.
  • 22.
    • Atrioventricular dyssynchronycan be assessed by using pulsed-wave Doppler recording of transmitral flow. Diastolic filling time (LVFT), defined as the sum of E-wave and A-wave duration, is divided by the RR interval duration (Figure 1) to obtain a diastolic filling ratio (LVFT/RR). • Significant atrioventricular dyssynchrony is assumed if LVFT/RR is <40%. Cleland JG, Daubert JC, Erdmann E, Freemantle N, Gras D, Kappenberger L, Klein W, Tavazzi L; CARE-HF study Steering Committee and Investigators. The CARE-HF study (CArdiac REsynchronisation in Heart Failure study): rationale, design and end-points. Eur J Heart Fail. 2001;3(4):481-9.
  • 23.
    • Interventricular dyssynchronyrefers to dyssynchrony between the left and the right ventricle and can be measured using conventional pulsed-wave Doppler or Tissue Doppler imaging The presence of inter-ventricular dyssynchrony is indicated by the difference of >40 ms between left ventricular and right ventricular pre-ejection time (measured by pulsed-wave Doppler) or by a delay of >56 ms between the onset of systolic motion in the basal right ventricular free wall versus the most delayed basal LV segment (measured by tissue Doppler). Penicka M, Bartunek J, De Bruyne B, Vanderheyden M, Goethals M, De Zutter M, Brugada P, Geelen P. Improvement of left ventricular function after cardiac resynchronization therapy is predicted by tissue Doppler imaging echocardiography. Circulation. 2004;109(8):978-83.
  • 24.
    • Intraventricular dyssynchronycan be evaluated by conventional echocardiography, tissue velocity measurements and deformation imaging
  • 25.
    • Conventional echocardiographicmarkers of dyssynchrony comprise: - septal to posterior wall motion delay (cut-off >130 ms) and - left ventricular electromechanical delay (cut-off >140 ms) Septal to posterior wall motion delay is assessed by M-mode echocardiography from parasternal short-axis view at the papillary muscle level. It is calculated as the interval between the maximal posterior displacement of the septum and the maximal displacement of the left posterior wall Pitzalis MV, Iacoviello M, Romito R, Massari F, Rizzon B, Luzzi G, Guida P, Andriani A, Mastropasqua F, Rizzon P. Cardiac resynchronization therapy tailored by echocardiographic evaluation of ventricular asynchrony. J Am Coll Cardiol. 2002;40(9):1615-22.
  • 26.
    • Tissue velocityimaging – With tissue velocity imaging, longitudinal velocities of basal (or basal and mid) myocardial segments are measured from standard apical views. – Tissue velocity- derived dyssynchrony parameters can be broadly divided into: • time delays between opposing walls and • standard deviations of time-to-peak systolic velocities. • Deformation imaging – In contrast to the timing of myocardial velocity peaks, myocardial deformation parameters (strain, strain rate) have the potential of distinguishing active contraction from passive motion caused by tethering of adjacent myocardial regions. Deformation data can be obtained from color Tissue Doppler or two-dimensional speckle tracking images. At present, the difference ≥130 ms in peak radial strain between the basal anteroseptal and basal posterior wall segments is one of most commonly used speckle tracking-based dyssynchrony parameter
  • 27.
    • Apical rockingand septal flash : The direct mechanical consequences of dyssynchronous contraction induced by left bundle branch block can be described by apical rocking and septal flash. • An early electrical activation of the septum results in a short initial septal contraction and causes the apex to move septally while the septum moves leftward (SF, yellow arrow in the middle panel). The delayed activation of the lateral wall pulls then the apex laterally during the ejection phase while stretching the septum. This typical sequence of the septal- to-lateral apex motion is described as ‘ ApRock’. The septal inward motion is described as ‘SF’
  • 28.
    • APICAL ROCKINGMOTION ON A4C VIEW • Both apical rocking and septal flash have been shown to have predictive value for a CRT response which is superior to velocity-based dyssynchrony parameters. Relationship of visually assessed apical rocking and septal flash to response and long-term survival following cardiac resynchronization therapy (PREDICT-CRT), European Heart Journal - Cardiovascular Imaging, Volume 17, Issue 3, March 2016, Pages 262–269, https://doi.org/10.1093/ehjci/jev288
  • 32.
    • CMR hasgained increasing attention for dyssynchrony assessment because of its high tissue and spatial contrast, coupled with highly accurate and reproducible assessment of LV volume and functional indexes ADVANTAGE DISADVANTAGE • High spatial resolution and tissue characterization, in addition to highly accurate quantification of chamber size and ventricular function and 3-dimensional assessment of myocardial strain • CMR has high reproducibility owing largely to tomographic imaging with less operator dependency • Long acquisition times, implanted cardiac devices as magnetic resonance hazards, and complex post-processing techniques
  • 33.
    • Cine MRIis acquired routinely, it is not particularly optimized for evaluation of regional dyssynchrony. More direct methods have been developed that provide more accurate and direct assessment of intramyocardial deformation – myocardial tagging,(analogous to speckle tracking by echocardiography but with higher spatial resolution and reproducibility) – strain-encoded MRI (SENC)(involves using sinusoidal “tagged” surfaces that modulate longitudinal magnetization perpendicular to the imaging plane.) – phase-contrast MRI, and (Phase-contrast velocity mapping uses the shift in phase of the myocardium between 2 opposing pulse gradients, which is proportional to the velocity of the myocardium) – displacement encoding with stimulated echoes (DENSE)
  • 37.
    Wilfried Mullens andPetra Nijst. Understanding nonresponse to cardiac resynchronisation therapy; common problems and potential solutions. Journal of the American College of Cardiology. 2017 69(17):2130–2133
  • 41.
    STEPWISE APPROACH FORCRT NON RESPONDERS
  • 44.
    Presence of AFor VPCs • Newly onset episodes of paroxysmal or persistent AF are associated with worse outcome in CRT patients.AF often leads to tachycardia with loss of LV capture or fusion/ pseudofusion beats with ineffective resynchronization. • If rhythm control is failing with cardioversion and/or antiarrhythmic therapy, it is crucial to control the ventricular rate in order to ensure biventricular capture • Some patients require catheter RFA for VPC’s and atrioventricular (AV) node ablation to ensure 100% ventricular pacing and this aggressive approach has been shown to improve exercise tolerance, LV reverse remodeling, and LVEF with a significant survival benefit in this patient population. Marrouche NF, Brachmann J, Andresen D, Siebels J, Boersma L, Jordaens L, Merkely B, Pokushalov E, Sanders P, Proff J, Schunkert H, Christ H, Vogt J, Bänsch D, CASTLE-AF Investigators (2018) Catheter ablation for atrial fibrillation with heart failure. N Engl J Med 378:417–427
  • 47.
    Programming and optimisation •Most important settings requiring optimisation are the pacing mode, upper and lower rate limits, the LV capture voltage, the stimulation vector and A-V and V-V intervals. • Programming a high upper tracking rate ensures biventricular pacing is maintained during exercise. Similarly, the LV pacing output should include an adequate safety margin to ensure continual BiV pacing, although some modern devices can automatically adjust this parameter. • A V interval optimization -Adjusts contraction sequence between LA and LV to optimize LV filling without truncating atrial contraction • VV interval optimization – Adjusts contraction sequence between the left and right ventricles to produce the largest stroke volume
  • 49.
    AV Optimization Echocardiography Ritter method Maximalfilling time -Mitral VTI Meluzin method Iterative method Ishikawa method Diastolic timing Systolic function
  • 51.
    RITER’S METHOD The MIRACLEtrial optimized the AV interval with this method.. Measure the time from onset of QRS complex to time of termination of the A-wave (QA interval) is measured at both a long (AVlong) and a short AV delays (AVshort). The optimal AV delay is calculated from following formula: AVopt = AV long - (QA short – QA long).
  • 52.
    Iterative method • Mostcommon echocardiographic optimization technique. • Used in the CARE-HF and the SMART-AV trials
  • 53.
    • In bothLVOT and Transmitral VTI methods , A-V delay leading to max value is used as the optimum A-V delay.
  • 54.
    • Both themethod depends on minimizing the diastolic MR for optimal A-V delay.
  • 56.
    OTHER METHODS FORA-V OPTIMIZATION 1. Impedance cardiography (IC) uses changes in transthoracic impedance to estimate stroke volume. – changes in thoracic impedance are caused by the systolic aortic flow and on this basis the system calculates stroke volume and CO on a beat-to-beat basis from the TIC signal. 2. FFPG allows measurement of changes in peripheral pulse pressure- correlate reasonably with measured central aortic pressure. • Optimal AV delay, defined as that producing the greatest change in pulse pressure, was identical using either FFPG or central aortic pressure • MOST RECENT TRIAL VALIDATING THIS PLETHYMOGRAPHY BASED OPTIMIZATION IS BRAVO TRIAL (2019) WHICH SHOWED IT TO BE NON INFERIOR TO ECHO BASED OPTIMIZATION.
  • 57.
    3. Acoustic cardiographyis another relatively new technique for AV optimization. This technology integrates the surface electrocardiogram and heart sound data to measure the intensity of S3, the electromechanical activation time (EMAT, representing the time from the QRS onset to S1), and LV systolic time (LVST, the time interval from S1 to S2). – Changes in each parameter can indicate worsening heart failure: an increase in S3 suggestive of increased left ventricular filling pressure, – prolongation of EMAT indicative of reduced LV contractility, – and a reduced LVST suggestive of reduced systolic function. – This was comparable to the mitral inflow method
  • 58.
    VV Interval Optimization Electrocardiogaphy Echocardiography –M mode – LV outflow VTI –Dyssynchrony assessment – 3D echocardiography LV dp/dt Finger plethysmography Device algorithms The methods used for VV optimization may be suboptimal to achieve adequate inter- and intra- ventricular resynchronization. In almost all studies of VV optimization, AV delay optimization was performed first followed by VV optimization. Magnitude of hemodynamic improvement with optimized VV pacing may be too small to be clinically meaningful. It is has been repeatedly shown that the optimal
  • 59.
    DEVICE BASED ALGORITHMS •IEGM (INTRA CARDIAC ECG)-based AV delay algorithms are clearly desirable given the potential for incorporation into device software for rapid optimization and potentially continuous modification. • Such technology could reduce costs, time, and the possibility of user error introduced with more complex methods such as echocardiography St.Jude- QUICK OPT Boston-SMART DELAY. Medtronic-ADAPTIVE
  • 61.
    • The SonRcontractility sensor embedded in the right atrial lead enables individualized automatic optimization of the atrioventricular (AV) and interventricular (VV) timings. • The RESPOND-CRT study investigated the safety and efficacy of the contractility sensor system in HF patients undergoing CRT Automatic AV and VV optimization using the contractility sensor was safe and as effective as Echo-guided AV and VV optimization in increasing response to CRT. • The SonR sensor records an endocardial acceleration signal corresponding to these vibrations. The highest amplitude of the signal occurs during the isovolumetric contraction phase of the cardiac cycle and corresponds to the cardiac contractility.15 The correlation between the amplitude of the recorded signal and LV dP/dtmax, as a surrogate of the contractile function of the heart. • It automatically adjusts the AV and VV delays, on a weekly basis, at rest and exercise.
  • 63.
    How often shouldoptimization be performed? • once at discharge (COMPANION); • at discharge, 3 and 6 months (MIRACLE) or • at discharge, 3, 9, and 18 months (CARE-HF) • optimal AV and VV intervals change over time due to LV remodeling • device-based algorithms –advantage • AdaptivCRT (once per minute) and SonRTM (weekly),show improvements over echocardiography where as SMART-AV(3monthly) did not show benefit.
  • 64.
  • 65.
    OTHER METHODS TOPREVENT NON RESPONDERS • Utilising appropriate LV lead technology and optimisation of the LV lead stimulation site MSP can also be delivered via multipoint pacing (MPP). This technique utilises quadripolar LV pacing leads which have four integrated pacing cathodes along the course of the lead, allowing greater customisation from any of the of the 10–17 MPP vectors available. • Stimulation site : lateral free wall represents the most favourable target for LV lead deployment, typically within the lateral or postero-lateral cardiac veins of the coronary sinus • • The use of remote monitoring has been shown to improve clinical outcomes for patients with heart failure one such device under study is only implantable technologies have also been devised. The CardioMEMS Heart Failure system (Abbott Medical Inc., Atlanta, GA, USA) is a wireless pulmonary artery haemodynamic monitor, which provides an accurate assessment of real time pulmonary artery (PA) pressure, allowing the physician to optimise pharmacotherapy. Use of this system was associated with a 33% reduction in hospitalisations when compared to standard of care
  • 66.
    Biventricular endocardial pacing •Failure to implant an LV lead in a tributary of the coronary sinus during a transvenous, epicardial CRT procedure occurs in around 5–15% of cases • BiV ENDO pacing is not reliant on the CS anatomy and instead, operators can choose to deliver stimulation at any site within the LV cavity. Wireless pacing systems which can be delivered via a retrograde aortic approach eliminate the need for central venous access in pt with venous stenosis especially in pt getting upgradations.
  • 67.
    The WiSE CRTwireless biventricular endocardial pacing system
  • 68.

Editor's Notes