Doppler echocardiography uses the Doppler effect to measure blood flow and tissue velocities in the heart. There are different Doppler modalities including continuous wave Doppler, pulsed wave Doppler, and color Doppler flow mapping. Doppler can assess volumetric flow using the continuity equation, quantify stenosis by measuring gradients, and calculate regurgitant volumes. Tissue Doppler measures myocardial velocities. Doppler is useful for clinical applications such as evaluating valvular lesions, shunts, and estimating cardiac pressures.
![spectral doppler assessment of the heart 29
Flow duration and thus cardiac cycle intervals can be reli-
ably measured by CWD and PWD and combined into indices of
ventricular performance (Tei index, MPI) or synchrony. Care
must be taken to minimize filter settings to accurately define the
onset and termination of flow.
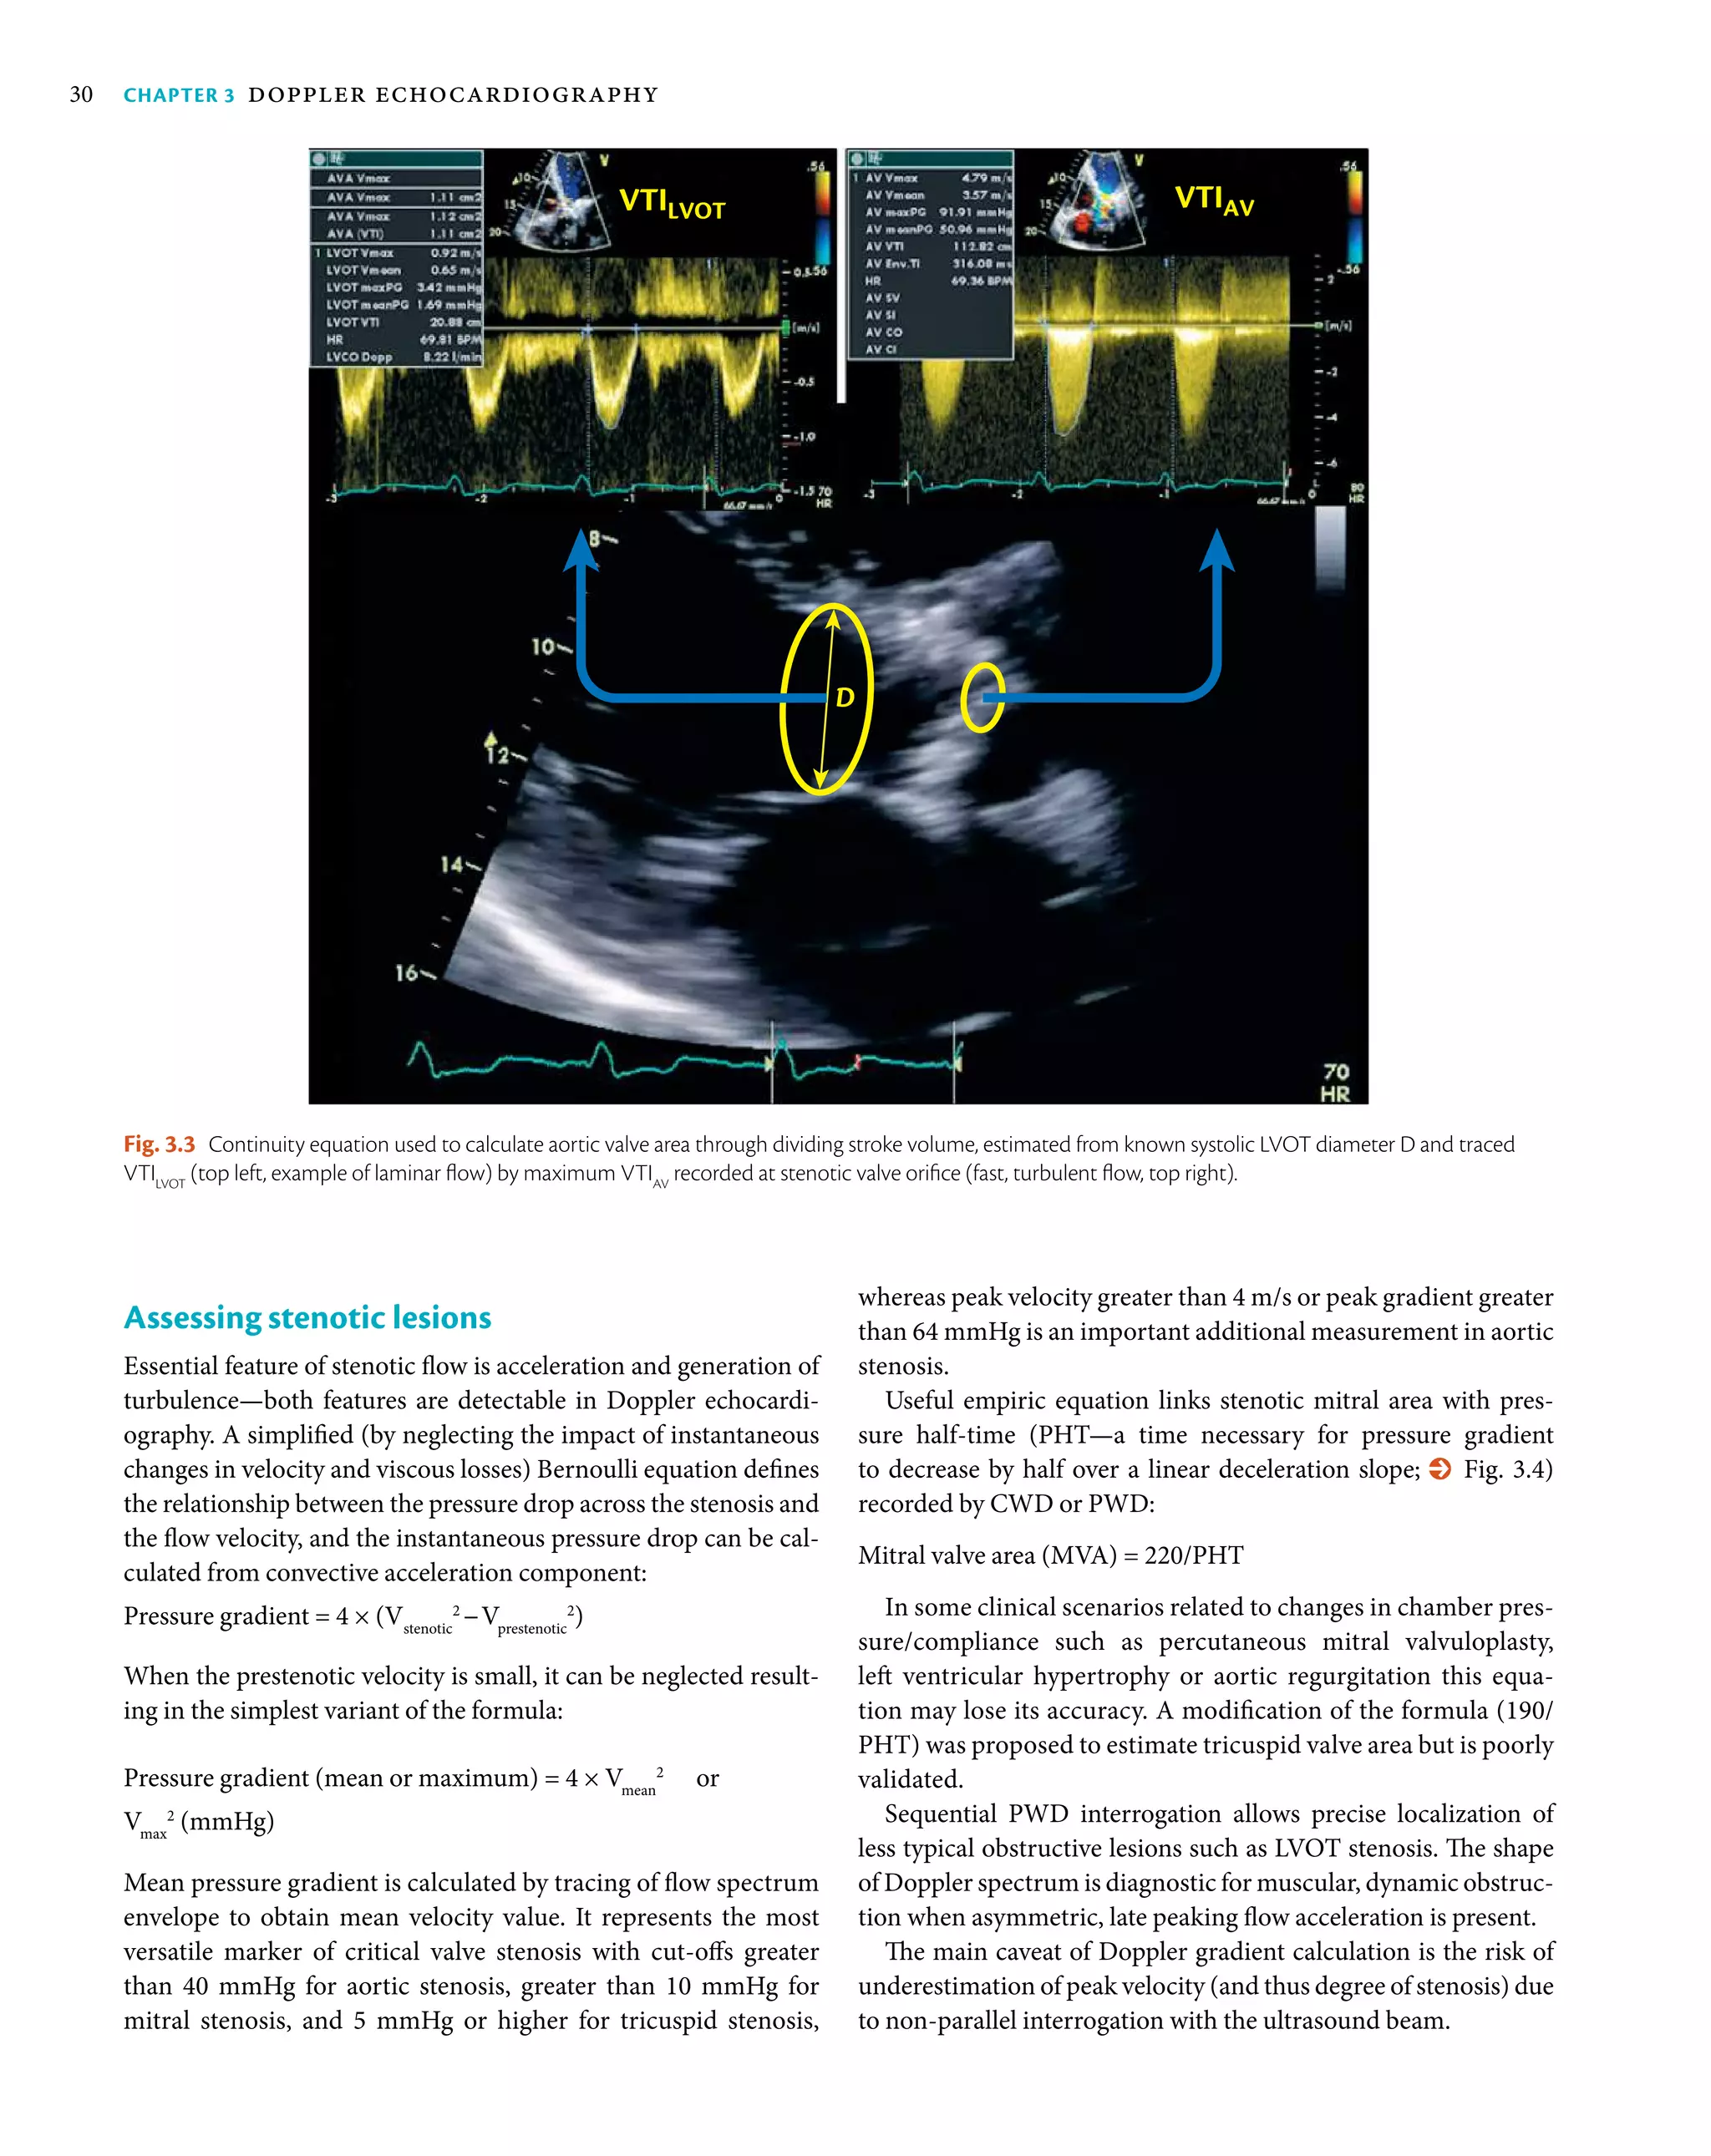
Assessing volumetric flow
The continuity equation is used in echocardiography for calcu-
lating volumetric flow (Q) at specific locations which correspond
to systolic performance and can be converted in stroke volume
(% Fig. 3.3).
The formula is usually assuming circular cross-section with
diameter D conducting the flow (Q, mL) defined by spectrum
with a given VTI:
=Q
π•D • VTI
4
2
Difference in flow volumes in left ventricular outflow tract
(LVOT) and right ventricular outflow tract (RVOT) can result
from left/right shunts (and thus enables calculation of Qpulmonary
/
Qsystemic
ratio). Regurgitant flow increases the volume crossing the
incompetent valve and comparing unequal flows allows the quan-
tification of regurgitant volume and effective regurgitant orifice
area. The formula can be used to calculate stenotic orifice area (e.g.
in aortic stenosis) [3].
Aortic valve area = SV/VTICW aortic valve
= (LVOT diameter2
× π/4 × VTILVOT PW
)/
VTICW aortic valve
= (LVOT diameter2
× 0.785)
× VTILVOT PW
/VTICW aortic valve
Current 3D echocardiographs with matrix transducers (tran-
sthoracic or transoesophageal) support colour flow display in
real-time or in multiple-beat electrocardiogram-gated acqui-
sitions which are necessary to increase colour-coded volume.
Practical benefit from 3D colour Doppler lies in better spatial
definition of flow zones, coordination of abnormal 3D anatomy
with flow, and in quantifying regurgitant flow convergence areas
without anatomical assumptions (% Fig. 3.2).
Tissue Doppler signal was detected in the early era of ultra-
sound [1] but was mainly considered as noise. Tissue Doppler
echocardiography (TDE; also known as tissue velocity/
Doppler imaging, TVI or TDI, or Doppler myocardial imaging,
DMI) uses the same principles as colour flow Doppler in
order to quantify myocardial velocities. Unlike conventional
Doppler study of the blood flow (which has high velocity/low
reflectivity), TDE is set to low gain without high-pass filter to
record high intensity myocardial Doppler signal in low velocity
range (generally < 20 cm/s) [2].
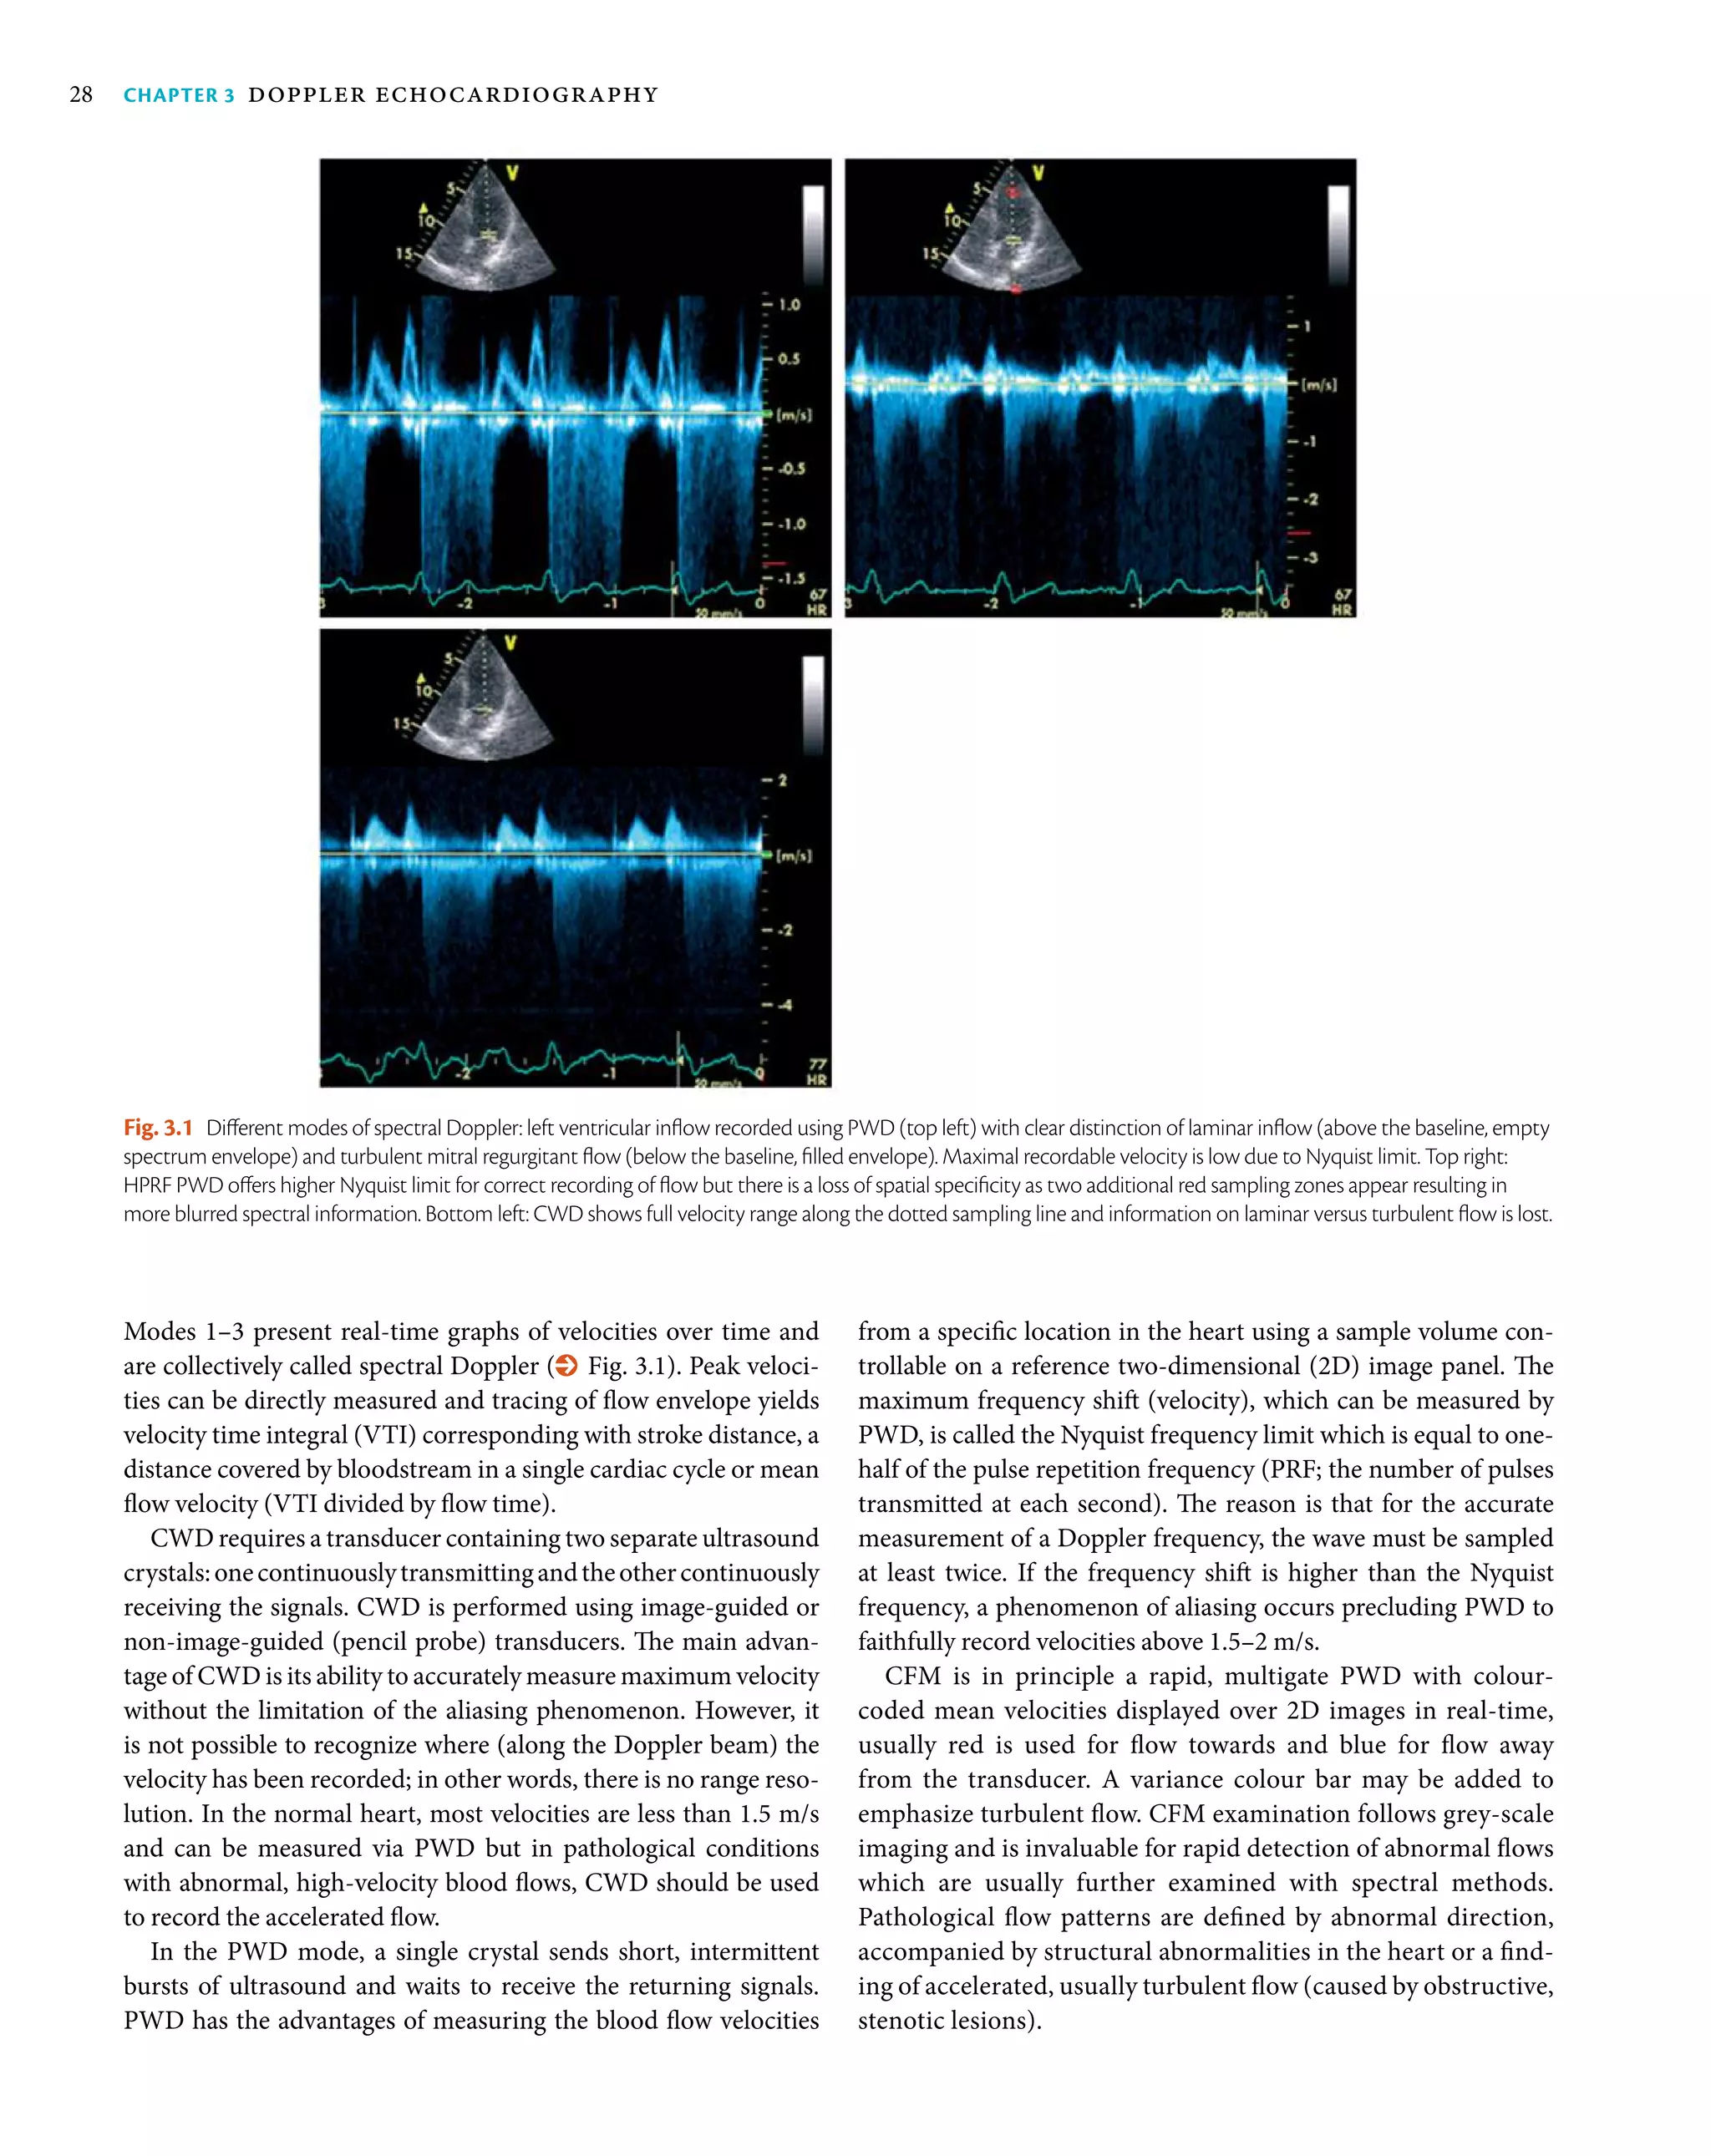
Spectral Doppler assessment of the
heart
Blood flow velocity measurement by Doppler echocardiography is
the foundation of the non-invasive haemodynamic assessment of
the cardiovascular system. Normal cardiac flow is usually laminar
with velocities less than 1.5 m/s. Two important equations—the
Bernoulli equation and the continuity equation—can help reli-
ably determine intracardiac pressures, pressure gradients, stroke
volume, and cardiac output. Standard study should report peak
valvular velocities whereas calculated mean and peak transval-
vular gradient together with area estimate is necessary whenever
stenosis is suspected.
Fig. 3.2 Three-dimensional Doppler display of regurgitant jets origin outside a mitral prosthetic valve ring — a periprosthetic leak (left panel). Right panel shows
a multiplanar presentation of proximal tricuspid regurgitant jet with volume-rendered (right bottom panel) display of triangular flow convergence region on the
right ventricular side of the valve.](https://image.slidesharecdn.com/dopplerechocardiography-200413043036/75/Doppler-echocardiography-3-2048.jpg)
![spectral doppler assessment of the heart 31
The second approach (proximal isovelocity convergence area
(PISA) method) is based on proximal flow convergence phenom-
enon detectable in colour Doppler (% Fig. 3.5). Flow forming
regurgitation must rapidly accelerate proximally to orifice, cre-
ating concentric aliasing borders (defined by Nyquist limit, VN
)
similar to hemisphere corresponding with flow area. Any distinct
Assessing regurgitant valves
Regurgitant jets are turbulent, fast flows in counter-physiologic
direction which can be quantified by Doppler. Formulas used
for quantification of regurgitant flow volume (RegV) are supe-
rior to visual assessment of jet mapped with colour Doppler and
are recommended for clinical decision-making. As no single
Doppler parameter is robust enough for definite assessment of
valve regurgitation, an integrated approach is recommended—
incorporating the imaging of proximal and distal jet segment as
well as assessing impact of regurgitation on intracardiac or great
vessels flow. The intensity and shape of regurgitant flow spec-
trum is related to regurgitant volume. An important parameter
is vena contracta width (VCW) defined as a width of proximal
jet segment adjacent to regurgitant orifice which is strongly cor-
related to jet volume. While specific values differ slightly for
individual valves, VCW ≥ 7 mm is usually detected in significant
regurgitation (% Fig. 3.5).
Effective regurgitant orifice area (EROA, defined as peak flow
rate/peak regurgitant flow velocity) or regurgitant flow volume
(RegV = EROA × VTIregurgitant flow
) and secondary parameters such
as regurgitant fraction (defined as RegV/forward flow across an
orifice) can be derived in two ways [4]. First, regurgitant flow
results in a change in local stroke volume and can be calculated
as a difference of a stroke volume proximal to regurgitant lesion
and that calculated distally (e.g. in mitral regurgitation, LVOT and
mitral annulus stroke volumes can be used).
Fig. 3.4 Examples of quantification of haemodynamics using spectral Doppler. Top left: pressure halftime across stenotic mitral valve of 224 ms equivalent to
0.98 cm2
orifice area. Top right: CWD recording of patent ductus arteriosus flow indicating peak systolic gradient of 102.5 mmHg between the aorta and
pulmonary trunk, corresponding with systolic pulmonary artery pressure whereas end-diastolic gradient (3 m/s — 36 mmHg, arrow) allows calculation of diastolic
pulmonary pressure Bottom left: tracing of CWD flow spectrum across the tricuspid valve to derive mean and peak velocities (V) and gradients (PG); Bottom right:
RV–RA pressure gradient of 81 mmHg can be estimated according to simplified Bernoulli equation applied for peak tricuspid regurgitation velocity of 4.5 m/s.
Fig. 3.5 Quantification of mitral regurgitant jet. Cross-shaped callipers
measure the vena contracta width of 5.5 mm. Black arrow corresponds with
PISA radius, which together with averaged traced regurgitant flow envelope
(white dotted line) yields the values for effective regurgitant orifice of 0.29 cm2
and regurgitant volume of 48 mL.](https://image.slidesharecdn.com/dopplerechocardiography-200413043036/75/Doppler-echocardiography-5-2048.jpg)
![Chapter 3 doppler echocardiography32
Mean pulmonary artery pressure =
4 × (Vmax pulmonary regurgitant flow
)2
+ mean right atrial pressure
Mean pulmonary artery pressure is also strongly correlated with
acceleration time (AcT) of RVOT flow and can be estimated by
empiric equations:
Mean pulmonary artery pressure = 79 − (0.45 × AcT) or
Mean pulmonary artery pressure = 90 − (0.62 × AcT)—more
exact estimate when AcT less than 120 ms
Shunt lesions are easy to identify using CFM and analysis of
flow spectrum allows the calculation of pressure gradient driv-
ing abnormal flow, which can be used for estimation of pressures
inside right-sided cavities, for example:
In patients with ventricular septal defect (VSD):
Systolic RV pressure = systolic systemic blood
pressure − 4 × Vmax VSD flow
In patients with patent ductus arteriosus (PDA):
Systolic RV pressure = systolic systemic blood
pressure − 4 × Vmax systolic PDA flow
Diastolic RV pressure = diastolic systemic blood
pressure − 4 × Vmax diastolic PDA flow
Finally, abnormal vascular flow can be recorded during the
echocardiogram indicating great vessels disease (e.g. aortic
isthmus, pulmonary trunk or veins), or coronary flow abnor-
malities—stenoses (diastolic flow 1.5 m/s is strongly suggestive of
significant coronary stenosis [5]) or fistulas.
Tissue Doppler echocardiography
TDE allows the measurements of tissue velocity with several
options (% Fig. 3.6)—colour TDE (colour-coded myocardial
motion overlaid on grey-scale image, allowing offline quantifica-
tion of myocardial velocities), or pulsed wave TDE (usually with
sample volume of 5–7 mm allowing real-time quantification of
the regional velocities during the cardiac cycle with high tempo-
ral resolution). Saving myocardial colour Doppler loops with raw
velocity data allows offline post-processing including tracking of
the sample volume and calculating derived parameters (e.g. veloci-
ties, displacement, and deformation) or presenting reformatted
data as curvilinear tissue colour Doppler M-mode. Optimal acqui-
sition process requires a high frame rate, preferably greater than
100 frames/s, and ideally at least 140 frames/s. Importantly, the
velocitiesobtainedwithofflineanalysisareapproximately20%lower
than those obtained from PWD due to lower sampling rates. When
usedformeasuringcardiaccycleintervals,low-velocityfiltersshould
be set at low values to correctly detect onset and end of motion.
Spectral TDE data can be retrieved for any segment of LV or RV
wall. However, systolic and diastolic velocities of the mitral annu-
lus[1,3]reflectinglongitudinalfunctionoftheselectedventricular
PISA at usual Nyquist limits of 50–60 cm/s requires more detailed
investigation. The calculation requires measuring the radius
of hemispheric aliasing (rPISA
) and tracing of regurgitant flow
spectrum:
EROA = Peak regurgitant flow/Vmax regurgitant flow
= 2 π rPISA
2
× VN
/Vmax regurgitant flow
RegV (mL) = EROA × VTIregurgitant flow
PISA is best imaged in zoomed image with colour VN
reduced to
15–40 cm/s, without variance colour map, and the first aliasing
border should be measured at peak flow. Despite many limitations
(non-hemispheric PISA shape, angle dependency, multiple jets
problem,technicaldifficultiesinsomepatients,andlearningcurve),
quantitative methods should be routinely used in assessing valvu-
lar regurgitation exceeding trivial. Cut-off values vary between the
valvesandarediscussedelsewherebutgenerally,significantorganic
regurgitation is characterized by regurgitant volumes greater than
50%, volumes of 60 mL/beat or greater, and EROA of 30–40 mm2
or higher are found in severe valvular insufficiency. Recently, direct
3D echocardiographic measurement of colour-coded PISA or vena
contracta area has been proposed as more accurate than quantifica-
tion based on 2D colour flow imaging.
Other abnormal flow patterns
PWD is commonly used to define ventricular diastolic function
with sample volume placed over the tips of opened atrioventric-
ular valves in order to define patterns of abnormal relaxation or
decreased compliance, together with pulmonary veins flow and
mitral/tricuspid tissue Doppler study.
Transtricuspid regurgitant flow velocity should be reported if
measurable as it carries information on right ventricular systolic
pressure (RVSP, which is equal to systolic pulmonary artery pres-
sure in the absence of obstructive lesions in RVOT), according to
the formula:
Systolic RV−RA pressure gradient = 4 × (Vmax tricuspid regurgitant flow
)2
RVSP = systolic RV−RA pressure gradient
+ mean right atrial pressure (estimated by inferior vena
cava diameter and respiratory variability)
Estimated peak transtricuspid gradient greater than 50 mmHg is
strongly suggestive and less than 36 mmHg is usually exclusive
of pulmonary hypertension (% Fig. 3.4). Several formulas were
proposed to estimate pulmonary vascular resistance based on
Doppler RVSP corrected by RVOT stroke volume but are not com-
monly accepted as equivalent to invasive values.
Peak pulmonary valve regurgitant flow spectrum can also be
used to estimate mean and diastolic pulmonary artery pressure
by the formula:
Diastolic pulmonary artery pressure =
4 × (end-diastolic pulmonary regurgitant flow
)2
+ mean right atrial pressure
(estimated by inferior vena cava diameter and respiratory variability)](https://image.slidesharecdn.com/dopplerechocardiography-200413043036/75/Doppler-echocardiography-6-2048.jpg)
![tissue doppler echocardiography 33
◆ a′ (late diastolic myocardial velocity): negative peak of the sec-
ond diastolic wave, corresponding to late diastolic LV filling by
the atrial contraction. The main haemodynamic determinants
of the a′ wave are LA contractility and end-diastolic LV pressure.
Myocardial velocities obtained from the septal annulus are lower
than in the lateral wall, therefore different cut-offs should be
applied. Consensus documents recommend measuring both at the
septalandthelateralsiteandreportingtheaverageofthetwovalues.
It is important to optimize gain and filter settings, because higher
gain and filters can lead to an incorrect identification of peak values.
Derived parameters such as E/e′ ratio play a role in the non-invasive
estimation of LV filling pressures (see Chapter 21 in this textbook).
Myocardial isovolumic contraction time (IVCT), and myocardial
acceleration can be measured from a′ wave ending to S′ wave begin-
ning reflecting inotropy during the isovolumic period. The most
important clinical applications of TDE velocities include quantifica-
tion of regional systolic and diastolic function including synchrony:
◆ Early detection of systolic or diastolic LV or RV dysfunction
◆ Non-invasive estimation of LV filling pressures (E/e′)
wall are usually recorded. It is noteworthy that the technique is
angle dependent just like flow Doppler (recommended angle of
insonation should not exceed 15°) and is less useful for the assess-
ment of the left ventricular apical segments.
Clinical applications of tissue Doppler
The most used measurements in TDE are systolic myocardial
velocity (s′), early (e′), and late (a′) diastolic myocardial velocities.
Clinically relevant parameters derived from TDE can be measured
in the LV or in the RV, including:
◆ s′ (peak systolic myocardial velocity): measured as the peak
positive value during the ejection period
◆ e′ (early diastolic myocardial velocity): negative peak of the
first diastolic wave, corresponding to early diastolic LV fill-
ing. Magnitude of e′ is influenced by LV relaxation, preload,
LV systolic function, and LV minimal pressure. Additionally,
e′ velocity is usually reduced in patients with significant annu-
lar calcification, surgical rings, mitral stenosis, and prosthetic
mitral valves [6]
Fig. 3.6 Tissue Doppler echocardiography modes. Top left: colour Doppler myocardial imaging of the left ventricle: short-axis view. Top right: pulsed Doppler
recording of myocardial velocities: septal mitral annulus velocity profile. Bottom left: offline analysis of septal myocardial velocities: decreasing base-to-apex
velocities are displayed from a single heartbeat. AVC, aortic valve closure; AVO, aortic valve opening; MVC, mitral valve closure; MVO, mitral valve opening.](https://image.slidesharecdn.com/dopplerechocardiography-200413043036/75/Doppler-echocardiography-7-2048.jpg)
![Chapter 3 doppler echocardiography34
Artefacts originate from inappropriate equipment settings such
as incorrect gain, velocity, and angle beam and may be overcome
by taking appropriate steps such as altering the power, gain, and
window. The two most important Doppler artefacts are velocity
underestimation, which occurs with either PWD or CWD, and
signal aliasing, which is inherent to pulsed wave (and colour)
Doppler study.
Conclusion
Doppler echocardiography has become an indispensable tool
for understanding of cardiac function, offering a non-invasive
haemodynamic laboratory, virtually obviating the need for inva-
sivehaemodynamicmeasurements.ColourDopplerflowmapping
allows rapid identification of abnormal flow patterns (stenosis,
regurgitation, shunt, abnormal cavities connection) and spectral
Doppler is used to record peak velocities of valvular flow jets or
quantify local aberrant bloodstream. Tissue Doppler has become
a practical method for quantification of longitudinal ventricu-
lar function, mainly represented by mitral or tricuspid annular
velocities. Three-dimensional colour data sets offer potential for
optimized measurements of cross-sectional area corresponding
with flow, for example, in proximal isovelocity region of regurgi-
tant jets. The knowledge of specific Doppler artefacts is critical for
proper use of the technique.
◆ Differential diagnosis between restrictive myocardial pathol-
ogy and constrictive pericarditis, with higher velocities on
septal rather than free LV wall (annulus reversus) [7]
◆ Detection of myocardial ischaemia (postsystolic contraction)
◆ Study of cardiac asynchrony.
Doppler artefacts
Since many therapeutic plans and surgical interventions are based
on Doppler haemodynamic findings, knowledge of the capabili-
ties and limitations of echocardiography is critical. Artefacts are
deemed the Achilles heel of echocardiography and result from
acoustics principles and the physical interaction between ultra-
sound and tissue; artefacts are common and inevitable.
‘Doppler artefact’ means recording the signals that falsify the true
anatomy of physiology, for example, detecting signals with no corre-
spondinganatomicstructureorflowinthecorrectlocationorfailing
torecognizesignalsthatarepresent.Thismayleadtoimproperdiag-
nosis and even treatment. Artefacts in general differ from true flow
signals in that the latter have correct anatomical origin and destina-
tion, appropriate duration, laminar component, and convergence
zone, whereas the former are anatomically incorrect with signals
that are too brief to be real. They appear and disappear when the
view is changed and can usually be eliminated with corrective steps.
References
1. Yoshida T, Mori M, Nimura Y, et al. Analysis of heart motion with
ultrasonic Doppler method and its clinical application. Am Heart J
1961; 61:61–75.
2. McDicken WN, Sutherland GR, Moran CM, Gordon LN. Colour
Doppler velocity imaging of the myocardium. Ultrasound Med Biol
1992; 18:651–4.
3. BaumgartnerH,HungJ,BermejoJ,etal.Echocardiographicassessment
of valve stenosis: EAE/ASE recommendations for clinical practice. Eur
J Echocardiogr 2009; 10(1):1–25.
4. Lancellotti P, Tribouilloy C, Hagendorff A, et al. Recommendations
for the echocardiographic assessment of native valve regurgitation:
an executive summary from European Association of Cardiovascular
Imaging. Eur Heart J Cardiovasc Imaging 2013; 14:611–44.
5. Kasprzak JD, Drozdz J, Peruga JZ, Rafalska K, Krzemińska-Pakuła M.
Definitionofflowparametersinproximalnonstenoticcoronaryarteries
using transesophageal Doppler echocardiography. Echocardiography
2000; 17:141–50.
6. Nagueh SF, Appleton CP, Gillebert TC, et al. Recommendations for the
evaluation of left ventricular diastolic function by echocardiography.
Eur J Echocardiogr 2009; 10:165–93.
7. Reuss CS, Wilansky SM, Lester SJ, et al. Using mitral ‘annulus rever-
sus’ to diagnose constrictive pericarditis. Eur J Echocardiogr 2009;
10(3):372–5.](https://image.slidesharecdn.com/dopplerechocardiography-200413043036/75/Doppler-echocardiography-8-2048.jpg)


