The document discusses various mathematical concepts related to functions and graphs including:
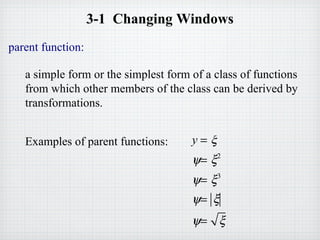
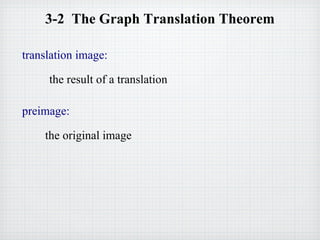
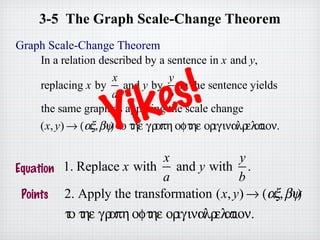
1) Transformations of graphs such as translations, reflections, and rotations. It also discusses parent functions and their derivatives.
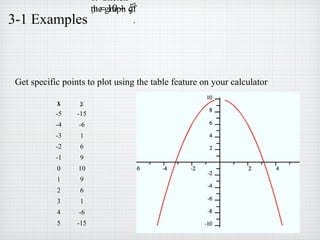
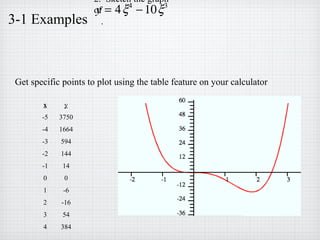
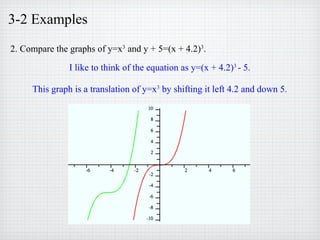
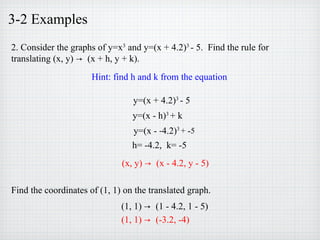
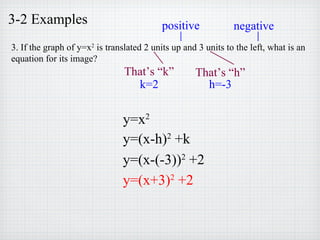
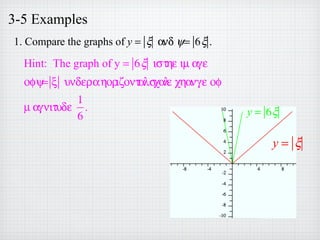
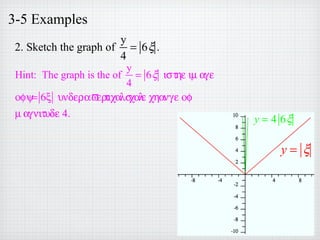
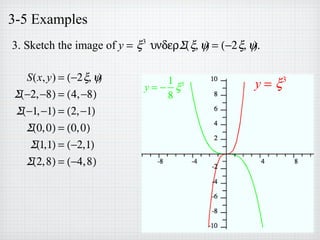
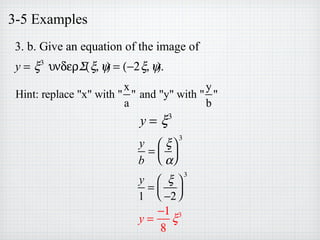
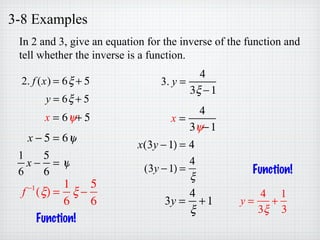
2) Examples of graphing functions after applying transformations to translate, scale, or reflect the original graphs. Equations are provided for the transformed graphs.
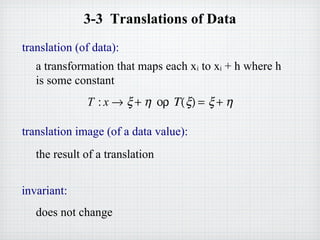
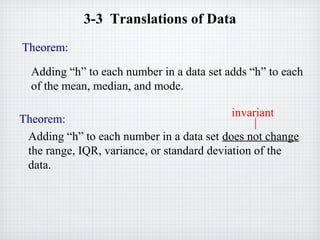
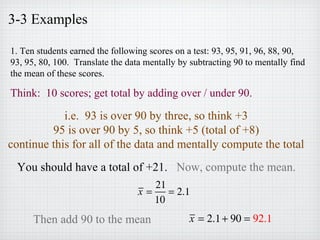
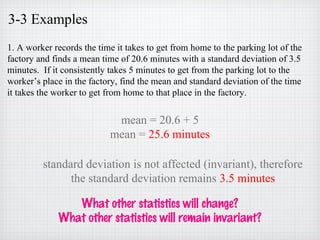
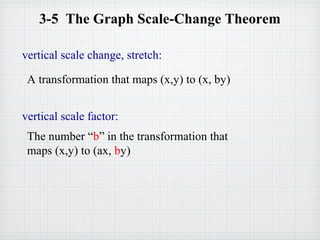
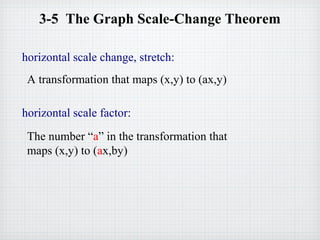
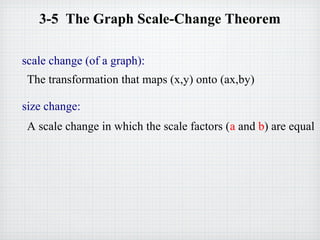
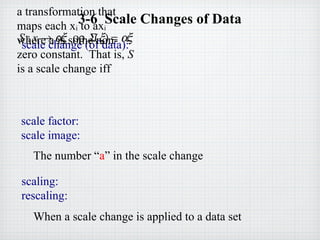
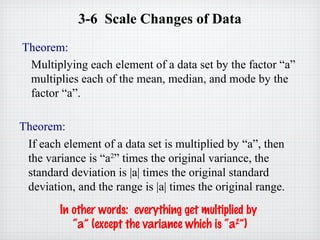
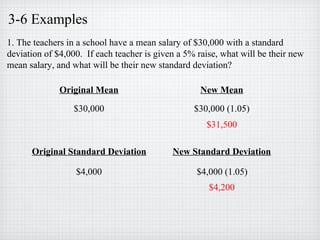
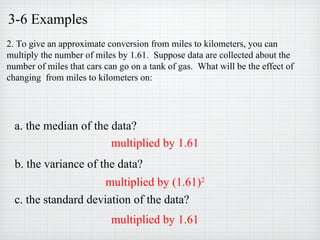
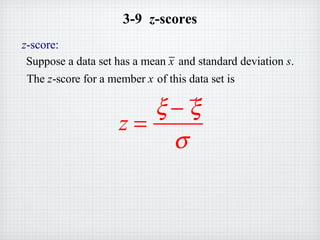
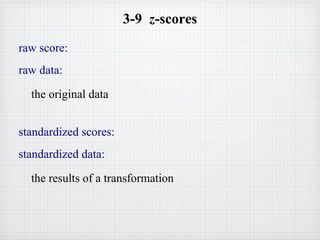
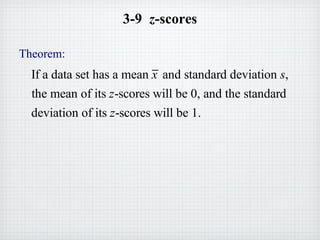
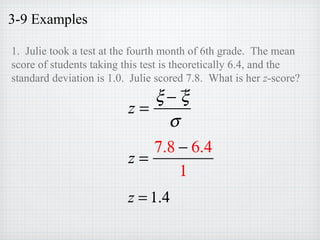
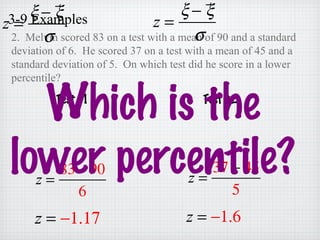
3) Theorems related to how statistics of data change after translations or scale changes. For example, the mean, median and mode change proportionally but variance, standard deviation, and range change in specific ways.
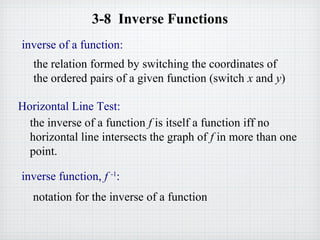
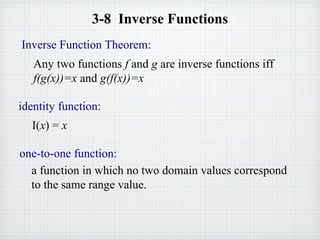
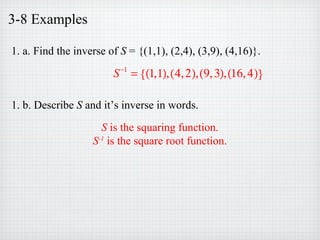
4) Concepts involving inverse functions, including using the horizontal line test to determine if an inverse is a function and notations for inverse functions