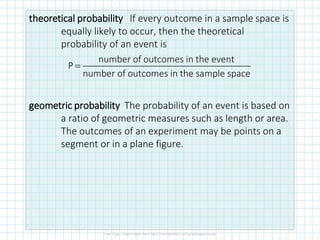
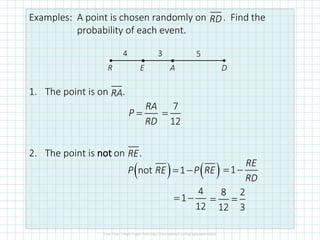
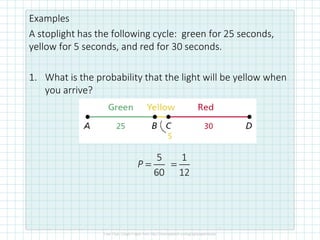
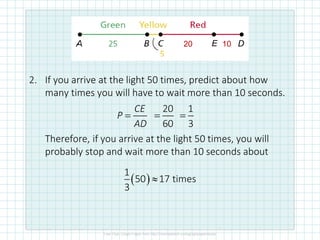
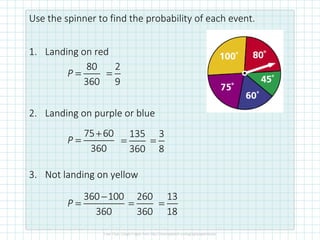
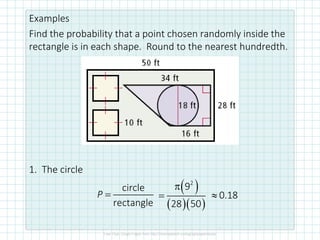
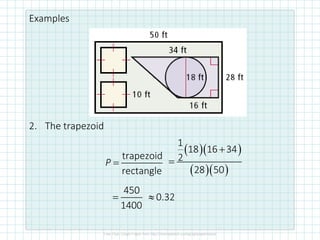
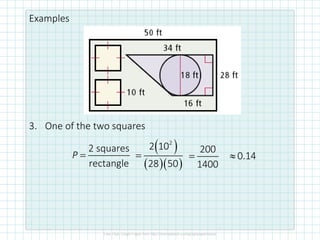
5.13.3 Geometric Probability and Changing Dimensionssmiller5
Students will
* Calculate geometric probabilities
* Use geometric probability to predict results in real-world situations
* Predict the effects of changing dimensions on the perimeter/circumference and area of a figure.
- random error theory
- probability, experiments, plots of combining observations
- normal distribution curve,
- properties of the normal distribution function
- properties of the standard error
- linear error probable
- linear interpolation
* Model exponential growth and decay
* Use Newton's Law of Cooling
* Use logistic-growth models
* Choose an appropriate model for data
* Express an exponential model in base e
* Construct perpendicular and angle bisectors
* Use bisectors to solve problems
* Identify the circumcenter and incenter of a triangle
* Use triangle segments to solve problems
* Identify, write, and analyze conditional statements
* Write the inverse, converse, and contrapositive of a conditional statement
* Write a counterexample to a fake conjecture
* Find the distance between two points
* Find the midpoint of two given points
* Find the coordinates of an endpoint given one endpoint and a midpoint
* Find the coordinates of a point a fractional distance from one end of a segment
* Connect functions to their graphs
* Graph piecewise-defined functions
* Graph absolute value functions
* Graph greatest-integer functions
* Interpret graphs
* Use the vertical line test to determine a function
* Connect functions to their graphs
* Graph piecewise-defined functions
* Graph absolute value functions
* Graph greatest-integer functions
* Interpret graphs
* Use the vertical line test to determine a function
* Introduce functions and function notation
* Develop skills in constructing and interpreting the graphs of functions
* Learn to apply this knowledge in a variety of situations
* Recognize graphs of common functions.
* Graph functions using vertical and horizontal shifts.
* Graph functions using reflections about the x-axis and the y-axis.
* Graph functions using compressions and stretches.
* Combine transformations.
* Identify intervals on which a function increases, decreases, or is constant
* Use graphs to locate relative maxima or minima
* Test for symmetry
* Identify even or odd functions and recognize their symmetries
* Understand and use piecewise functions
* Solve polynomial equations by factoring
* Solve equations with radicals and check the solutions
* Solve equations with rational exponents
* Solve equations that are quadratic in form
* Solve absolute value equations
* Determine whether a relation or an equation represents a function.
* Evaluate a function.
* Use the vertical line test to identify functions.
* Identify the domain and range of a function from its graph
* Identify intercepts from a function’s graph
* Solve counting problems using the Addition Principle.
* Solve counting problems using the Multiplication Principle.
* Solve counting problems using permutations involving n distinct objects.
* Solve counting problems using combinations.
* Find the number of subsets of a given set.
* Solve counting problems using permutations involving n non-distinct objects.
* Use summation notation.
* Use the formula for the sum of the first n terms of an arithmetic series.
* Use the formula for the sum of the first n terms of a geometric series.
* Use the formula for the sum of an infinite geometric series.
* Solve annuity problems.
* Find the common ratio for a geometric sequence.
* List the terms of a geometric sequence.
* Use a recursive formula for a geometric sequence.
* Use an explicit formula for a geometric sequence.
* Find the common difference for an arithmetic sequence.
* Write terms of an arithmetic sequence.
* Use a recursive formula for an arithmetic sequence.
* Use an explicit formula for an arithmetic sequence.
Unit 8 - Information and Communication Technology (Paper I).pdfThiyagu K
This slides describes the basic concepts of ICT, basics of Email, Emerging Technology and Digital Initiatives in Education. This presentations aligns with the UGC Paper I syllabus.
Palestine last event orientationfvgnh .pptxRaedMohamed3
An EFL lesson about the current events in Palestine. It is intended to be for intermediate students who wish to increase their listening skills through a short lesson in power point.
Read| The latest issue of The Challenger is here! We are thrilled to announce that our school paper has qualified for the NATIONAL SCHOOLS PRESS CONFERENCE (NSPC) 2024. Thank you for your unwavering support and trust. Dive into the stories that made us stand out!
The Indian economy is classified into different sectors to simplify the analysis and understanding of economic activities. For Class 10, it's essential to grasp the sectors of the Indian economy, understand their characteristics, and recognize their importance. This guide will provide detailed notes on the Sectors of the Indian Economy Class 10, using specific long-tail keywords to enhance comprehension.
For more information, visit-www.vavaclasses.com
Model Attribute Check Company Auto PropertyCeline George
In Odoo, the multi-company feature allows you to manage multiple companies within a single Odoo database instance. Each company can have its own configurations while still sharing common resources such as products, customers, and suppliers.
Ethnobotany and Ethnopharmacology:
Ethnobotany in herbal drug evaluation,
Impact of Ethnobotany in traditional medicine,
New development in herbals,
Bio-prospecting tools for drug discovery,
Role of Ethnopharmacology in drug evaluation,
Reverse Pharmacology.
This is a presentation by Dada Robert in a Your Skill Boost masterclass organised by the Excellence Foundation for South Sudan (EFSS) on Saturday, the 25th and Sunday, the 26th of May 2024.
He discussed the concept of quality improvement, emphasizing its applicability to various aspects of life, including personal, project, and program improvements. He defined quality as doing the right thing at the right time in the right way to achieve the best possible results and discussed the concept of the "gap" between what we know and what we do, and how this gap represents the areas we need to improve. He explained the scientific approach to quality improvement, which involves systematic performance analysis, testing and learning, and implementing change ideas. He also highlighted the importance of client focus and a team approach to quality improvement.
How to Make a Field invisible in Odoo 17Celine George
It is possible to hide or invisible some fields in odoo. Commonly using “invisible” attribute in the field definition to invisible the fields. This slide will show how to make a field invisible in odoo 17.
Basic phrases for greeting and assisting costumers
13.1 Geometric Probability
1. Geometric Probability
The student is able to (I can):
• Calculate geometric probabilites
• Use geometric probability to predict results in real-world
situations
2. theoretical probability If every outcome in a sample space is
equally likely to occur, then the theoretical
probability of an event is
geometric probability The probability of an event is based on
a ratio of geometric measures such as length or area.
The outcomes of an experiment may be points on a
segment or in a plane figure.
=
number of outcomes in the event
P
number of outcomes in the sample space
3. Examples: A point is chosen randomly on . Find the
probability of each event.
1. The point is on .
2. The point is not on .
RD
•
•
D
A
E
R
4 3 5
RA
RA
P
RD
=
7
12
=
RE
( ) ( )
not 1
P RE P RE
= − 1
RE
RD
= −
4
1
12
= −
8 2
12 3
= =
4. Examples
A stoplight has the following cycle: green for 25 seconds,
yellow for 5 seconds, and red for 30 seconds.
1. What is the probability that the light will be yellow when
you arrive?
5
60
P =
1
12
=
5. 2. If you arrive at the light 50 times, predict about how
many times you will have to wait more than 10 seconds.
Therefore, if you arrive at the light 50 times, you will
probably stop and wait more than 10 seconds about
•
10
E
20
CE
P
AD
=
20
60
=
1
3
=
( )
1
50 17 times
3
6. Use the spinner to find the probability of each event.
1. Landing on red
2. Landing on purple or blue
3. Not landing on yellow
80
360
P =
2
9
=
75 60
360
+
=
P
135
360
=
3
8
=
360 100
360
−
=
P
260
360
=
13
18
=
7. Examples
Find the probability that a point chosen randomly inside the
rectangle is in each shape. Round to the nearest hundredth.
1. The circle
circle
rectangle
=
P
( )
( )( )
2
9
28 50
= 0.18