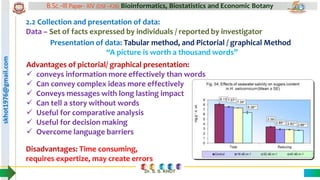
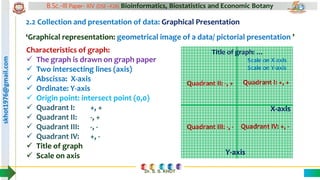
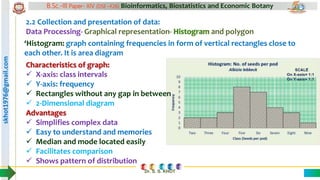
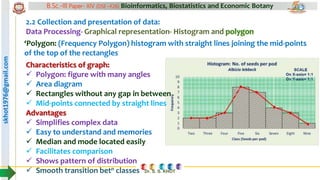
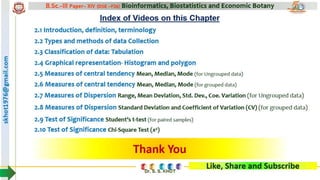
The data may be represented textually or graphically. The graphical presentation includes the arrangement of data in 2D or 3D figures. Bar graph, histogram, line graph, pie graph are some of the examples of graphical presentations.
This presentation explains the characteristics of Histogram
4. Biostatistics graphical representation histogram and polygon
1. skhot1976@gmail.com B.Sc.-III Paper- XIV (DSE –F26) Bioinformatics, Biostatistics and Economic Botany
skhot1976@gmail.com
Paper XIV
Unit. 2. Biostatistics
2.4 Graphical representation- Histogram and polygon
Dr. Sudhakar Sambhaji Khot
M.Sc., Ph.D., SET
Assistant Professor in Botany
Y. C. Warana Mahavidyalaya, Warananagar
2. skhot1976@gmail.com B.Sc.-III Paper- XIV (DSE –F26) Bioinformatics, Biostatistics and Economic Botany
Dr. S. S. KHOT 2
B.Sc. Part- III Botany
Paper- XIV DSE –F26
Bioinformatics, Biostatistics and Economic Botany
Unit 2: Biostatistics (11)
2.2 Collection and presentation of data:
Types of data, techniques of data collection- Census method,
sampling method- simple random, stratified and systematic sampling.
Classification, tabulation, graphical representation- Histogram and polygon.
3. skhot1976@gmail.com B.Sc.-III Paper- XIV (DSE –F26) Bioinformatics, Biostatistics and Economic Botany
Dr. S. S. KHOT
2.2 Collection and presentation of data:
Data – Set of facts expressed by individuals / reported by investigator
Presentation of data: Tabular method, and Pictorial / graphical Method
“A picture is worth a thousand words”
Advantages of pictorial/ graphical presentation:
conveys information more effectively than words
Can convey complex ideas more effectively
Conveys messages with long lasting impact
Can tell a story without words
Useful for comparative analysis
Useful for decision making
Overcome language barriers
Disadvantages: Time consuming,
requires expertize, may create errors
4. skhot1976@gmail.com B.Sc.-III Paper- XIV (DSE –F26) Bioinformatics, Biostatistics and Economic Botany
Dr. S. S. KHOT
2.2 Collection and presentation of data: Graphical Presentation
‘Graphical representation: geometrical image of a data/ pictorial presentation ’
Characteristics of graph:
The graph is drawn on graph paper
Two intersecting lines (axis)
Abscissa: X-axis
Ordinate: Y-axis
Origin point: intersect point (0,0)
Quadrant I: +, +
Quadrant II: -, +
Quadrant III: -, -
Quadrant IV: +, -
Title of graph
Scale on axis
Quadrant I: +, +
Quadrant II: -, +
Quadrant III: -, - Quadrant IV: +, -
Title of graph: …
Scale on X-axis
Scale on Y-axis
X-axis
Y-axis
5. skhot1976@gmail.com B.Sc.-III Paper- XIV (DSE –F26) Bioinformatics, Biostatistics and Economic Botany
Dr. S. S. KHOT
2.2 Collection and presentation of data:
Data Processing- Graphical representation- Histogram and polygon
‘Histogram: graph containing frequencies in form of vertical rectangles close to
each other. It is area diagram
Characteristics of graph:
X-axis: class intervals
Y-axis: frequency
Rectangles without any gap in between
2-Dimensional diagram
Advantages
Simplifies complex data
Easy to understand and memories
Median and mode located easily
Facilitates comparison
Shows pattern of distribution
6. skhot1976@gmail.com B.Sc.-III Paper- XIV (DSE –F26) Bioinformatics, Biostatistics and Economic Botany
Dr. S. S. KHOT
2.2 Collection and presentation of data:
Data Processing- Graphical representation- Histogram and polygon
‘Polygon: (Frequency Polygon) histogram with straight lines joining the mid-points
of the top of the rectangles
Characteristics of graph:
Polygon: figure with many angles
Area diagram
Rectangles without any gap in between
Mid-points connected by straight lines
Advantages
Simplifies complex data
Easy to understand and memories
Median and mode located easily
Facilitates comparison
Shows pattern of distribution
Smooth transition betn classes