
Recommended
Recommended
More Related Content
What's hot
What's hot (12)
Similar to 7. Biostatistics dispersion range, mean dev., std. dev. cv for ungrouped data
Similar to 7. Biostatistics dispersion range, mean dev., std. dev. cv for ungrouped data (20)
Recently uploaded
Recently uploaded (20)
7. Biostatistics dispersion range, mean dev., std. dev. cv for ungrouped data
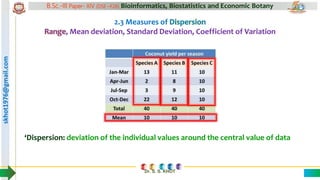
- 1. skhot1976@gmail.com B.Sc.-III Paper- XIV (DSE –F26) Bioinformatics, Biostatistics and Economic Botany Dr. S. S. KHOT 2.3 Measures of Dispersion Range, Mean deviation, Standard Deviation, Coefficient of Variation ‘Dispersion: deviation of the individual values around the central value of data
- 2. skhot1976@gmail.com B.Sc.-III Paper- XIV (DSE –F26) Bioinformatics, Biostatistics and Economic Botany skhot1976@gmail.com Paper XIV Unit. 2. Biostatistics 2.7 Measures of Dispersion Dr. Sudhakar Sambhaji Khot M.Sc., Ph.D., SET Assistant Professor in Botany Y. C. Warana Mahavidyalaya, Warananagar Range, Mean Deviation, Standard Deviation, Coefficient of Variation (CV) (for Ungrouped data)
- 3. skhot1976@gmail.com B.Sc.-III Paper- XIV (DSE –F26) Bioinformatics, Biostatistics and Economic Botany Dr. S. S. KHOT 2.3 Measures of Dispersion ‘Dispersion: deviation of the individual values around the central value of data Dispersion Range, Mean deviation, Standard Deviation, Coefficient of Variation
- 4. skhot1976@gmail.com B.Sc.-III Paper- XIV (DSE –F26) Bioinformatics, Biostatistics and Economic Botany Dr. S. S. KHOT 2.3 Measures of Dispersion
- 5. skhot1976@gmail.com B.Sc.-III Paper- XIV (DSE –F26) Bioinformatics, Biostatistics and Economic Botany Dr. S. S. KHOT 2.3 Measures of Dispersion Range, Mean deviation, Standard Deviation, Coefficient of Variation ‘Dispersion: deviation of the individual values around the central value of data Range: difference between the lowest and highest value of item in the set of data Range for species A= 22-02 = 20 Range for species B= 12-08 = 04 Range for species C= 10-10 = 00
- 6. skhot1976@gmail.com B.Sc.-III Paper- XIV (DSE –F26) Bioinformatics, Biostatistics and Economic Botany Dr. S. S. KHOT 2.3 Measures of Dispersion Range, Mean deviation, Standard Deviation, Coefficient of Variation ‘Mean Deviation: Average of deviation of the individual values from mean. Mean Deviation (MD) MD= ∑IDI /n (for ungrouped data) MD= ∑f IDI /n (for grouped data) Where I D I = Deviation from mean (without sign) f= Frequency n = total number of items
- 7. skhot1976@gmail.com B.Sc.-III Paper- XIV (DSE –F26) Bioinformatics, Biostatistics and Economic Botany Dr. S. S. KHOT 2.3 Measures of Dispersion Range, Mean deviation, Standard Deviation, Coefficient of Variation ‘Standard Deviation: Square Root of mean of squares of deviation from the mean. • Standard deviation (sigma ‘σ’ or SD) is the most widely used measure of dispersion. • σ is the positive SQRT of the arithmetic mean of the squares of deviations. • Summarizes the deviation in one figure used as a unit of variation. • S.D. is based on all the observations. Coconut yield per season Species A Species B Species C Jan-Mar 13 11 10 Apr-Jun 2 8 10 Jul-Sep 3 9 10 Oct-Dec 22 12 10 Total 40 40 40 Mean 10 10 10
- 8. skhot1976@gmail.com B.Sc.-III Paper- XIV (DSE –F26) Bioinformatics, Biostatistics and Economic Botany Dr. S. S. KHOT 2.3 Measures of Dispersion Range, Mean deviation, Standard Deviation, Coefficient of Variation ‘Standard Deviation: Square Root of mean of squares of deviation from the mean. Coconut yield per season Species A (x) Deviation dx= x-x̄ Sq Dev. dx2 Jan-Mar 13 3 9 Apr-Jun 2 -8 64 Jul-Sep 3 -7 49 Oct-Dec 22 12 144 Total (∑) 40 ∑ lDl =30 ∑dx2 = 266 Mean (x̄) 10 MD=7.5 𝝈 = 9.41 𝝈 = ∑𝒅𝒙 𝑵 − 𝟏 𝟐 𝝈 = 266 3 𝝈 = 9.41 coconuts
- 9. skhot1976@gmail.com B.Sc.-III Paper- XIV (DSE –F26) Bioinformatics, Biostatistics and Economic Botany Dr. S. S. KHOT 9 Story of SIX SIGMA (6σ) SIX SIGMA (6σ): defined and disciplined business methodology to increase customer satisfaction and profitability by streamlining operations, improving quality and eliminating defects in any organization-wide process. Originated at Motorola in 1980s 6σ = 99.99966 % Chance of defect = 0.00034 % = 3.4 defects /10,00,000
- 10. skhot1976@gmail.com B.Sc.-III Paper- XIV (DSE –F26) Bioinformatics, Biostatistics and Economic Botany Dr. S. S. KHOT 2.3 Measures of Dispersion Range, Mean deviation, Standard Deviation, Coefficient of Variation ‘Coefficient of variation (CV): It is Std. Dev. (SD) expressed as a percentage of mean CV = SD/x ̄ X 100 CV = 9.41/10 X 100 CV = 94.1 % • Method developed by Pearson • It is expressed in percentage • It is relative measure of dispersion • Useful to compare dispersion of different data • Higher CV represents more variability and less uniformity within the set of data
- 11. skhot1976@gmail.com B.Sc.-III Paper- XIV (DSE –F26) Bioinformatics, Biostatistics and Economic Botany Dr. S. S. KHOT Questions, if any ? Thank You