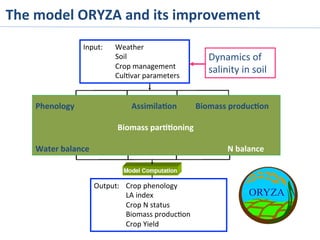
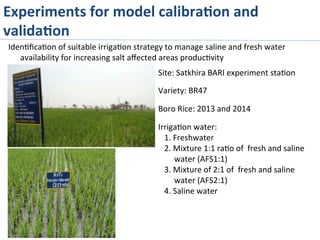
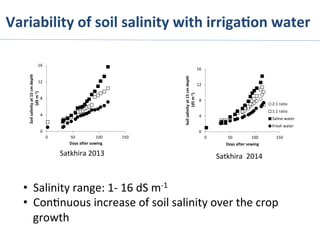
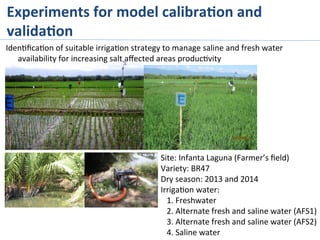
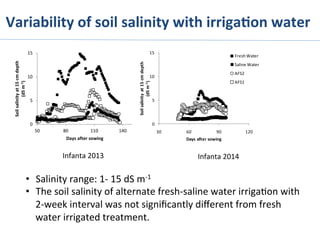
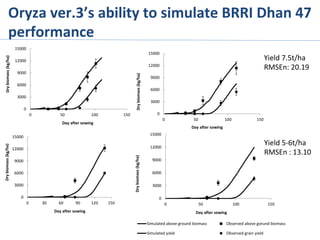
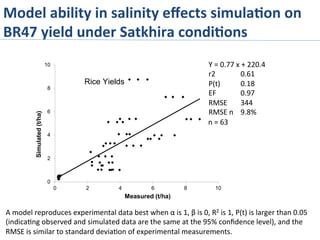
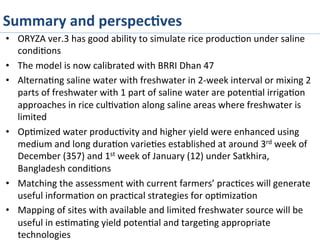
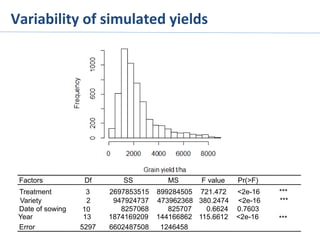
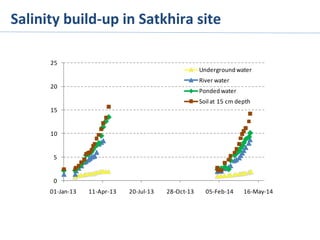
Iden%fying	
  op%mized	
  use	
  of	
  fresh	
  and	
  
saline	
  water	
  for	
  irriga%on	
  on	
  salt	
  
affected	
  rice	
  systems	
  in	
  Bangladesh	
  
using	
  ORYZA	
  ver.3	
  
Radanielson	
  A.M.	
  ,	
  O.	
  Angeles,	
  T.Li,	
  A.K.	
  
Rahman,	
  D.	
  Gaydon.	
  
Revitalizing	
  the	
  Ganges	
  coastal	
  zones	
  conference	
  
Dhaka	
  Oct	
  21-­‐23,	
  2014	
  
Outline	
  
1.  Ra>onale	
  and	
  objec>ves	
  
2.  Methodology	
  	
  
3.  Results	
  
4.  Summary	
  and	
  perspec>ves	
  
Rice	
  produc%on	
  challenges	
  in	
  Bangladesh	
  
•  Rice	
  demand	
  brought	
  by	
  increasing	
  popula>on:	
  	
  
– 	
  By	
  2030,	
  40.0	
  M	
  tons	
  	
  of	
  rice	
  for	
  about	
  190	
  M	
  
popula>on	
  
•  Limited	
  resources	
  :	
  	
  land,	
  water,	
  labour	
  
•  Environmental	
  constraints	
  aggravated	
  by	
  climate	
  
change	
  	
  
– Soil	
  salinity	
  
– Sea	
  level	
  rise	
  
– Extreme	
  weather	
  events	
  
Farmers livelihood
Opportuni%es	
  to	
  improve	
  rice	
  produc%on	
  in	
  
salt-­‐affected	
  areas	
  
•  Over	
  30%	
  of	
  cropped	
  
land	
  is	
  saline	
  
•  Saline-­‐tolerant	
  rice	
  
varie>es	
  are	
  available	
  
•  Need	
  a	
  suitable	
  
management	
  for	
  
produc>ve	
  and	
  
sustainable	
  cropping	
  
systems	
  
Objec%ves	
  
1.  Evaluate	
  irriga>on	
  water	
  management	
  op>ons	
  
to	
  reduce	
  salinity-­‐stress	
  on	
  rice	
  produc>on	
  
–  Calibra>on	
  and	
  valida>on	
  of	
  a	
  modified	
  version	
  of	
  the	
  
rice	
  model	
  ORYZA	
  ver.3	
  
–  Scenario	
  analyses	
  to	
  evaluate	
  performance	
  of	
  
management	
  strategies	
  using	
  different	
  sowing	
  dates,	
  
adapted	
  virtual	
  varie>es	
  and	
  the	
  mixing	
  fresh-­‐saline	
  
water	
  as	
  an	
  irriga>on	
  approach	
  targeted	
  to	
  op>mize	
  
yield	
  and	
  water	
  produc>vity	
  
2.  Iden>fy	
  poten>al	
  adapta>ve	
  strategies	
  for	
  salt-­‐
affected	
  rice	
  systems	
  
Input:	
   	
  Weather	
  
	
  Soil	


  Crop	
  management	
  
	
  Cul>var	
  parameters	
  
Output:	
   	
  Crop	
  phenology	
  
	
  LA	
  index	
  
	
  Crop	
  N	
  status	
  
	
  Biomass	
  produc>on	
  
	
  Crop	
  Yield	
  
Phenology 	
   	
  Assimila%on 	
  Biomass	
  produc%on	


  Biomass	
  par%%oning	


Water	
  balance	


  N	
  balance	
  
Dynamics	
  of	
  
salinity	
  in	
  soil	
  
The	
  model	
  ORYZA	
  and	
  its	
  improvement	
  
Iden>fica>on	
  of	
  suitable	
  irriga>on	
  strategy	
  to	
  manage	
  saline	
  and	
  fresh	
  water	
  
availability	
  for	
  increasing	
  salt	
  affected	
  areas	
  produc>vity	
  
Site:	
  Satkhira	
  BARI	
  experiment	
  sta>on	


Variety:	
  BR47	


Boro	
  Rice:	
  2013	
  and	
  2014	


Irriga>on	
  water:	


  1.	
  Freshwater	


  2.	
  Mixture	
  1:1	
  ra>o	
  of	
  	
  fresh	
  and	
  saline	
  
water	
  (AFS1:1)	


  3.	
  Mixture	
  of	
  2:1	
  of	
  	
  fresh	
  and	
  saline	
  
water	
  (AFS2:1)	


  4.	
  Saline	
  water	
  
Experiments	
  for	
  model	
  calibra%on	
  and	
  
valida%on	
  
Satkhira	
  2013	
   Satkhira	
  	
  2014	
  
Variability	
  of	
  soil	
  salinity	
  with	
  irriga%on	
  water	
  
•  Salinity	
  range:	
  1-­‐	
  16	
  dS	
  m-­‐1	
  
•  Con>nuous	
  increase	
  of	
  soil	
  salinity	
  over	
  the	
  crop	
  
growth	
  
0
4
8
12
16
0 50 100 150
Soil	
  salinity	
  at	
  15	
  cm	
  depth
(dS	
  m-­‐1)
Days	
  after	
  sowing
2:1	
  ratio
1:1	
  ratio
Saline	
  water
Fresh	
  water
0
4
8
12
16
0 50 100 150
Soil	
  salinity	
  at	
  15	
  cm	
  depth
(dS	
  m-­‐1)
Days	
  after	
  sowing
Iden>fica>on	
  of	
  suitable	
  irriga>on	
  strategy	
  to	
  manage	
  saline	
  and	
  fresh	
  water	
  
availability	
  for	
  increasing	
  salt	
  affected	
  areas	
  produc>vity	
  
Site:	
  Infanta	
  Laguna	
  (Farmer’s	
  field)	
  
Variety:	
  BR47	
  
Dry	
  season:	
  2013	
  and	
  2014	
  
Irriga>on	
  water:	


  1.	
  Freshwater	


  2.	
  Alternate	
  fresh	
  and	
  saline	
  water	
  (AFS1)	


  3.	
  Alternate	
  fresh	
  and	
  saline	
  water	
  (AFS2)	


  4.	
  Saline	
  water	
  
Experiments	
  for	
  model	
  calibra%on	
  and	
  
valida%on	
  
Variability	
  of	
  soil	
  salinity	
  with	
  irriga%on	
  water	
  
Infanta	
  2013	
   Infanta	
  2014	
  
•  Salinity	
  range:	
  1-­‐	
  15	
  dS	
  m-­‐1	
  
•  The	
  soil	
  salinity	
  of	
  alternate	
  fresh-­‐saline	
  water	
  irriga>on	
  with	
  
2-­‐week	
  interval	
  was	
  not	
  significantly	
  different	
  from	
  fresh	
  
water	
  irrigated	
  treatment.	
  
0
5
10
15
50 80 110 140
Soil	
  salinity	
  at	
  15	
  cm	
  depth	
  
(dS	
  m-­‐1)
Days	
  after	
  sowing
0
5
10
15
30 60 90 120
Soil	
  salinity	
  at	
  15	
  cm	
  depth	
  
(dS	
  m-­‐1)
Days	
  after	
  sowing
Fresh	
  Water
Saline	
  Water
AFS2
AFS1
Oryza	
  ver.3’s	
  ability	
  to	
  simulate	
  BRRI	
  Dhan	
  47	
  
performance	
  
Yield	
  7.5t/ha	
  
RMSEn:	
  20.19	
  
Yield	
  5-­‐6t/ha	
  
RMSEn	
  :	
  13.10	
  
0
3000
6000
9000
12000
15000
0 30 60 90 120 150
Dry	
  biomass	
  (kg/ha)
Day	
  after	
  sowing
0
3000
6000
9000
12000
15000
0 50 100 150
Dry	
  biomass	
  (kg/ha)
Day	
  after	
  sowing
0
3000
6000
9000
12000
15000
0 50 100 150
Dry	
  biomass	
  (kg/ha)
Day	
  after	
  sowing
0
3000
6000
9000
12000
15000
0 50 100 150
Dry	
  biomass	
  (kg/ha)
Day	
  after	
  sowing
Simulated	
  above	
  ground	
  biomass Observed	
  above	
  gorund	
  biomass
Simulated	
  yield Observed	
  grain	
  yield
Model	
  ability	
  in	
  salinity	
  effects	
  simula%on	
  on	
  
BR47	
  yield	
  under	
  Satkhira	
  condi%ons	
  
0
2
4
6
8
10
0 2 4 6 8 10
Simulated(t/ha)
Measured (t/ha)
Rice Yields
Y	
  =	
  0.77	
  x	
  +	
  220.4	
  
r2 	
  0.61	
  
P(t) 	
  0.18	
  
EF 	
  0.97	
  
RMSE 	
  344	
  
RMSE	
  n	


  9.8%	
  
n	
  =	
  63	
  
A	
  model	
  reproduces	
  experimental	
  data	
  best	
  when	
  α	
  is	
  1,	
  β	
  is	
  0,	
  R2	
  is	
  1,	
  P(t)	
  is	
  larger	
  than	
  0.05	
  
(indica>ng	
  observed	
  and	
  simulated	
  data	
  are	
  the	
  same	
  at	
  the	
  95%	
  confidence	
  level),	
  and	
  the	
  
RMSE	
  is	
  similar	
  to	
  standard	
  devia>on	
  of	
  experimental	
  measurements.	
  
 Scenario	
  simula%ons	
  
Factors:	


•  Satkhira	
  weather	
  data	
  over	
  15	
  years:	
  2000	
  -­‐2014	
  
•  Virtual	
  varie>es:	
  BR47	
  with	
  long,	
  medium,	
  and	
  
short	
  crop	
  dura>on	
  
•  Sowing	
  dates:	
  weekly	
  from	
  Dec	
  1	
  to	
  Feb	
  10	
  
•  Irriga>on	
  water	
  management	
  
–  Fresh	
  water	
  
–  Saline	
  water	
  
–  1:	
  1	
  ra>o	
  fresh	
  to	
  saline	
  water	
  
–  2:	
  1	
  ra>o	
  fresh	
  to	
  saline	
  water	
  
Variability	
  of	
  yields	
  	
  and	
  water	
  produc%vity	
  
among	
  varie%es	
  
0
0.05
0.1
0.15
0.2
0.25
Transpired	
  water	
  productivity	
  
(mm/kg) Variety	
  X	
  water	
  irrigation	
  management
0
1000
2000
3000
4000
5000
Grain	
  yield	
  (t/ha)
Varieties	
  X	
  Irrigation	
  water	
  management
•  Higher	
  yield	
  was	
  observed	
  for	
  long	
  dura>on	
  variety	
  
•  Higher	
  water	
  produc>vity	
  was	
  observed	
  for	
  medium	
  	
  dura>on	
  
variety	
  
•  Op>mized	
  produc>vity	
  for	
  medium	
  	
  variety	
  under	
  mixture	
  2	
  :1	
  
ra>o	


  SW	
  	
  FW	
  2W	
  1W	
  
SHORT	


SW	
  	
  FW	
  2W	
  1W	
  
LONG	


SW	
  	
  FW	
  2W	
  1W	
  
MEDIUM	


  SW	
  	
  FW	
  2W	
  1W	
  
SHORT	


SW	
  	
  FW	
  2W	
  1W	
  
LONG	


SW	
  	
  FW	
  2W	
  1W	
  
MEDIUM	


Trends	
  of	
  yield	
  and	
  water	
  produc%vity	
  over	
  
sowing	
  dates	
  
0.1
0.12
0.14
0.16
0.18
0.2
5 12 19 26 33 40 336 343 350 357 364
Transpired	
  water	
  productivity	
  (mm/kg)
Date	
  of	
  sowing	
  (Julian	
  day)
2000
2100
2200
2300
2400
2500
5 12 19 26 33 40 336 343 350 357 364
Grain	
  yield	
  	
  (kg/ha)
Date	
  of	
  sowing	
  (Julian	
  day)
•  Windows	
  of	
  cropping	
  calendar	
  tested	
  was	
  op>mized	
  
for	
  a	
  yield	
  mean	
  
•  Efficient	
  water	
  use	
  and	
  higher	
  yield	
  were	
  observed	
  for	
  
third	
  week	
  of	
  December	
  and	
  second	
  week	
  of	
  January	
  
Summary	
  and	
  perspec%ves	
  
•  ORYZA	
  ver.3	
  has	
  good	
  ability	
  to	
  simulate	
  rice	
  produc>on	
  under	
  saline	
  
condi>ons	
  
•  The	
  model	
  is	
  now	
  calibrated	
  with	
  BRRI	
  Dhan	
  47	
  
•  Alterna>ng	
  saline	
  water	
  with	
  freshwater	
  in	
  2-­‐week	
  interval	
  or	
  mixing	
  2	
  
parts	
  of	
  freshwater	
  with	
  1	
  part	
  of	
  saline	
  water	
  are	
  poten>al	
  irriga>on	
  
approaches	
  in	
  rice	
  cul>va>on	
  along	
  saline	
  areas	
  where	
  freshwater	
  is	
  
limited	
  
•  Op>mized	
  water	
  produc>vity	
  and	
  higher	
  yield	
  were	
  enhanced	
  using	
  
medium	
  and	
  long	
  dura>on	
  varie>es	
  established	
  at	
  around	
  3rd	
  week	
  of	
  
December	
  (357)	
  and	
  1st	
  week	
  of	
  January	
  (12)	
  under	
  Satkhira,	
  
Bangladesh	
  condi>ons	
  
•  Matching	
  the	
  assessment	
  with	
  current	
  farmers’	
  prac>ces	
  will	
  generate	
  
useful	
  informa>on	
  on	
  prac>cal	
  strategies	
  for	
  op>miza>on	
  
•  Mapping	
  of	
  sites	
  with	
  available	
  and	
  limited	
  freshwater	
  source	
  will	
  be	
  
useful	
  in	
  es>ma>ng	
  yield	
  poten>al	
  and	
  targe>ng	
  appropriate	
  
technologies	
  
THANK	
  YOU	


Variability	
  of	
  simulated	
  yields	
  
Factors Df SS MS F value Pr(>F)
Year 13 1874169209 144166862 115.6612 <2e-16 ***
Date of sowing 10 8257068 825707 0.6624 0.7603
Treatment 3 2697853515 899284505 721.472 <2e-16 ***
Variety 2 947924737 473962368 380.2474 <2e-16 ***
Error 5297 6602487508 1246458
0
5
10
15
20
25
01-­‐Jan-­‐13 11-­‐Apr-­‐13 20-­‐Jul-­‐13 28-­‐Oct-­‐13 05-­‐Feb-­‐14 16-­‐May-­‐14
Underground	
  water
River	
  water
Ponded	
  water
Soil	
  at	
  15	
  cm	
  depth
Salinity	
  build-­‐up	
  in	
  Satkhira	
  site	
  

Identifying optimized use of fresh and saline water for irrigation on salt affected rice systems in Bangladesh using ORYZA ver.3

  • 1.
    Iden%fying  op%mized  use  of  fresh  and   saline  water  for  irriga%on  on  salt   affected  rice  systems  in  Bangladesh   using  ORYZA  ver.3   Radanielson  A.M.  ,  O.  Angeles,  T.Li,  A.K.   Rahman,  D.  Gaydon.   Revitalizing  the  Ganges  coastal  zones  conference   Dhaka  Oct  21-­‐23,  2014  
  • 2.
    Outline   1.  Ra>onale  and  objec>ves   2.  Methodology     3.  Results   4.  Summary  and  perspec>ves  
  • 3.
    Rice  produc%on  challenges  in  Bangladesh   •  Rice  demand  brought  by  increasing  popula>on:     –   By  2030,  40.0  M  tons    of  rice  for  about  190  M   popula>on   •  Limited  resources  :    land,  water,  labour   •  Environmental  constraints  aggravated  by  climate   change     – Soil  salinity   – Sea  level  rise   – Extreme  weather  events   Farmers livelihood
  • 4.
    Opportuni%es  to  improve  rice  produc%on  in   salt-­‐affected  areas   •  Over  30%  of  cropped   land  is  saline   •  Saline-­‐tolerant  rice   varie>es  are  available   •  Need  a  suitable   management  for   produc>ve  and   sustainable  cropping   systems  
  • 5.
    Objec%ves   1.  Evaluate  irriga>on  water  management  op>ons   to  reduce  salinity-­‐stress  on  rice  produc>on   –  Calibra>on  and  valida>on  of  a  modified  version  of  the   rice  model  ORYZA  ver.3   –  Scenario  analyses  to  evaluate  performance  of   management  strategies  using  different  sowing  dates,   adapted  virtual  varie>es  and  the  mixing  fresh-­‐saline   water  as  an  irriga>on  approach  targeted  to  op>mize   yield  and  water  produc>vity   2.  Iden>fy  poten>al  adapta>ve  strategies  for  salt-­‐ affected  rice  systems  
  • 6.
    Input:    Weather    Soil      Crop  management    Cul>var  parameters   Output:    Crop  phenology    LA  index    Crop  N  status    Biomass  produc>on    Crop  Yield   Phenology    Assimila%on  Biomass  produc%on                          Biomass  par%%oning       Water  balance            N  balance   Dynamics  of   salinity  in  soil   The  model  ORYZA  and  its  improvement  
  • 7.
    Iden>fica>on  of  suitable  irriga>on  strategy  to  manage  saline  and  fresh  water   availability  for  increasing  salt  affected  areas  produc>vity   Site:  Satkhira  BARI  experiment  sta>on     Variety:  BR47     Boro  Rice:  2013  and  2014     Irriga>on  water:        1.  Freshwater        2.  Mixture  1:1  ra>o  of    fresh  and  saline   water  (AFS1:1)        3.  Mixture  of  2:1  of    fresh  and  saline   water  (AFS2:1)        4.  Saline  water   Experiments  for  model  calibra%on  and   valida%on  
  • 8.
    Satkhira  2013  Satkhira    2014   Variability  of  soil  salinity  with  irriga%on  water   •  Salinity  range:  1-­‐  16  dS  m-­‐1   •  Con>nuous  increase  of  soil  salinity  over  the  crop   growth   0 4 8 12 16 0 50 100 150 Soil  salinity  at  15  cm  depth (dS  m-­‐1) Days  after  sowing 2:1  ratio 1:1  ratio Saline  water Fresh  water 0 4 8 12 16 0 50 100 150 Soil  salinity  at  15  cm  depth (dS  m-­‐1) Days  after  sowing
  • 9.
    Iden>fica>on  of  suitable  irriga>on  strategy  to  manage  saline  and  fresh  water   availability  for  increasing  salt  affected  areas  produc>vity   Site:  Infanta  Laguna  (Farmer’s  field)   Variety:  BR47   Dry  season:  2013  and  2014   Irriga>on  water:        1.  Freshwater        2.  Alternate  fresh  and  saline  water  (AFS1)        3.  Alternate  fresh  and  saline  water  (AFS2)        4.  Saline  water   Experiments  for  model  calibra%on  and   valida%on  
  • 10.
    Variability  of  soil  salinity  with  irriga%on  water   Infanta  2013   Infanta  2014   •  Salinity  range:  1-­‐  15  dS  m-­‐1   •  The  soil  salinity  of  alternate  fresh-­‐saline  water  irriga>on  with   2-­‐week  interval  was  not  significantly  different  from  fresh   water  irrigated  treatment.   0 5 10 15 50 80 110 140 Soil  salinity  at  15  cm  depth   (dS  m-­‐1) Days  after  sowing 0 5 10 15 30 60 90 120 Soil  salinity  at  15  cm  depth   (dS  m-­‐1) Days  after  sowing Fresh  Water Saline  Water AFS2 AFS1
  • 11.
    Oryza  ver.3’s  ability  to  simulate  BRRI  Dhan  47   performance   Yield  7.5t/ha   RMSEn:  20.19   Yield  5-­‐6t/ha   RMSEn  :  13.10   0 3000 6000 9000 12000 15000 0 30 60 90 120 150 Dry  biomass  (kg/ha) Day  after  sowing 0 3000 6000 9000 12000 15000 0 50 100 150 Dry  biomass  (kg/ha) Day  after  sowing 0 3000 6000 9000 12000 15000 0 50 100 150 Dry  biomass  (kg/ha) Day  after  sowing 0 3000 6000 9000 12000 15000 0 50 100 150 Dry  biomass  (kg/ha) Day  after  sowing Simulated  above  ground  biomass Observed  above  gorund  biomass Simulated  yield Observed  grain  yield
  • 12.
    Model  ability  in  salinity  effects  simula%on  on   BR47  yield  under  Satkhira  condi%ons   0 2 4 6 8 10 0 2 4 6 8 10 Simulated(t/ha) Measured (t/ha) Rice Yields Y  =  0.77  x  +  220.4   r2  0.61   P(t)  0.18   EF  0.97   RMSE  344   RMSE  n        9.8%   n  =  63   A  model  reproduces  experimental  data  best  when  α  is  1,  β  is  0,  R2  is  1,  P(t)  is  larger  than  0.05   (indica>ng  observed  and  simulated  data  are  the  same  at  the  95%  confidence  level),  and  the   RMSE  is  similar  to  standard  devia>on  of  experimental  measurements.  
  • 13.
     Scenario  simula%ons   Factors:     •  Satkhira  weather  data  over  15  years:  2000  -­‐2014   •  Virtual  varie>es:  BR47  with  long,  medium,  and   short  crop  dura>on   •  Sowing  dates:  weekly  from  Dec  1  to  Feb  10   •  Irriga>on  water  management   –  Fresh  water   –  Saline  water   –  1:  1  ra>o  fresh  to  saline  water   –  2:  1  ra>o  fresh  to  saline  water  
  • 14.
    Variability  of  yields    and  water  produc%vity   among  varie%es   0 0.05 0.1 0.15 0.2 0.25 Transpired  water  productivity   (mm/kg) Variety  X  water  irrigation  management 0 1000 2000 3000 4000 5000 Grain  yield  (t/ha) Varieties  X  Irrigation  water  management •  Higher  yield  was  observed  for  long  dura>on  variety   •  Higher  water  produc>vity  was  observed  for  medium    dura>on   variety   •  Op>mized  produc>vity  for  medium    variety  under  mixture  2  :1   ra>o            SW    FW  2W  1W   SHORT                           SW    FW  2W  1W   LONG                           SW    FW  2W  1W   MEDIUM                                    SW    FW  2W  1W   SHORT                           SW    FW  2W  1W   LONG                           SW    FW  2W  1W   MEDIUM                          
  • 15.
    Trends  of  yield  and  water  produc%vity  over   sowing  dates   0.1 0.12 0.14 0.16 0.18 0.2 5 12 19 26 33 40 336 343 350 357 364 Transpired  water  productivity  (mm/kg) Date  of  sowing  (Julian  day) 2000 2100 2200 2300 2400 2500 5 12 19 26 33 40 336 343 350 357 364 Grain  yield    (kg/ha) Date  of  sowing  (Julian  day) •  Windows  of  cropping  calendar  tested  was  op>mized   for  a  yield  mean   •  Efficient  water  use  and  higher  yield  were  observed  for   third  week  of  December  and  second  week  of  January  
  • 16.
    Summary  and  perspec%ves   •  ORYZA  ver.3  has  good  ability  to  simulate  rice  produc>on  under  saline   condi>ons   •  The  model  is  now  calibrated  with  BRRI  Dhan  47   •  Alterna>ng  saline  water  with  freshwater  in  2-­‐week  interval  or  mixing  2   parts  of  freshwater  with  1  part  of  saline  water  are  poten>al  irriga>on   approaches  in  rice  cul>va>on  along  saline  areas  where  freshwater  is   limited   •  Op>mized  water  produc>vity  and  higher  yield  were  enhanced  using   medium  and  long  dura>on  varie>es  established  at  around  3rd  week  of   December  (357)  and  1st  week  of  January  (12)  under  Satkhira,   Bangladesh  condi>ons   •  Matching  the  assessment  with  current  farmers’  prac>ces  will  generate   useful  informa>on  on  prac>cal  strategies  for  op>miza>on   •  Mapping  of  sites  with  available  and  limited  freshwater  source  will  be   useful  in  es>ma>ng  yield  poten>al  and  targe>ng  appropriate   technologies  
  • 17.
  • 18.
    Variability  of  simulated  yields   Factors Df SS MS F value Pr(>F) Year 13 1874169209 144166862 115.6612 <2e-16 *** Date of sowing 10 8257068 825707 0.6624 0.7603 Treatment 3 2697853515 899284505 721.472 <2e-16 *** Variety 2 947924737 473962368 380.2474 <2e-16 *** Error 5297 6602487508 1246458
  • 19.
    0 5 10 15 20 25 01-­‐Jan-­‐13 11-­‐Apr-­‐13 20-­‐Jul-­‐1328-­‐Oct-­‐13 05-­‐Feb-­‐14 16-­‐May-­‐14 Underground  water River  water Ponded  water Soil  at  15  cm  depth Salinity  build-­‐up  in  Satkhira  site