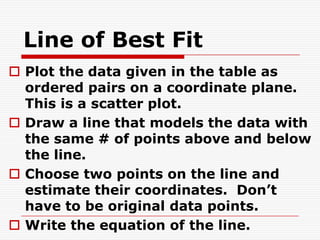
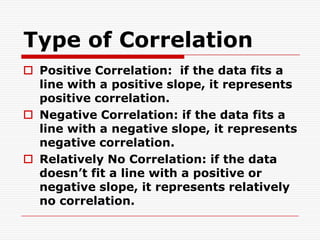
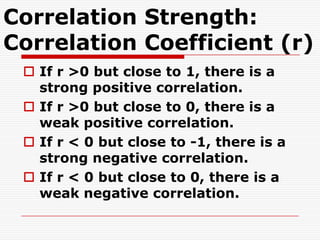
2.5 Correlation &
  Best-Fitting Lines
Today’s objectives:
1. I will use linear regression to
   approximate the best-fitting line
   for a set of data.
Line of Best Fit
 Plot the data given in the table as
  ordered pairs on a coordinate plane.
  This is a scatter plot.
 Draw a line that models the data with
  the same # of points above and below
  the line.
 Choose two points on the line and
  estimate their coordinates. Don’t
  have to be original data points.
 Write the equation of the line.
Type of Correlation
 Positive Correlation: if the data fits a
  line with a positive slope, it represents
  positive correlation.
 Negative Correlation: if the data fits a
  line with a negative slope, it represents
  negative correlation.
 Relatively No Correlation: if the data
  doesn’t fit a line with a positive or
  negative slope, it represents relatively
  no correlation.
Correlation Strength:
Correlation Coefficient (r)
  If r >0 but close to 1, there is a
   strong positive correlation.
  If r >0 but close to 0, there is a
   weak positive correlation.
  If r < 0 but close to -1, there is a
   strong negative correlation.
  If r < 0 but close to 0, there is a
   weak negative correlation.

2.5 a correlation & best fitting lines

  • 1.
    2.5 Correlation & Best-Fitting Lines Today’s objectives: 1. I will use linear regression to approximate the best-fitting line for a set of data.
  • 2.
    Line of BestFit  Plot the data given in the table as ordered pairs on a coordinate plane. This is a scatter plot.  Draw a line that models the data with the same # of points above and below the line.  Choose two points on the line and estimate their coordinates. Don’t have to be original data points.  Write the equation of the line.
  • 3.
    Type of Correlation Positive Correlation: if the data fits a line with a positive slope, it represents positive correlation.  Negative Correlation: if the data fits a line with a negative slope, it represents negative correlation.  Relatively No Correlation: if the data doesn’t fit a line with a positive or negative slope, it represents relatively no correlation.
  • 4.
    Correlation Strength: Correlation Coefficient(r)  If r >0 but close to 1, there is a strong positive correlation.  If r >0 but close to 0, there is a weak positive correlation.  If r < 0 but close to -1, there is a strong negative correlation.  If r < 0 but close to 0, there is a weak negative correlation.