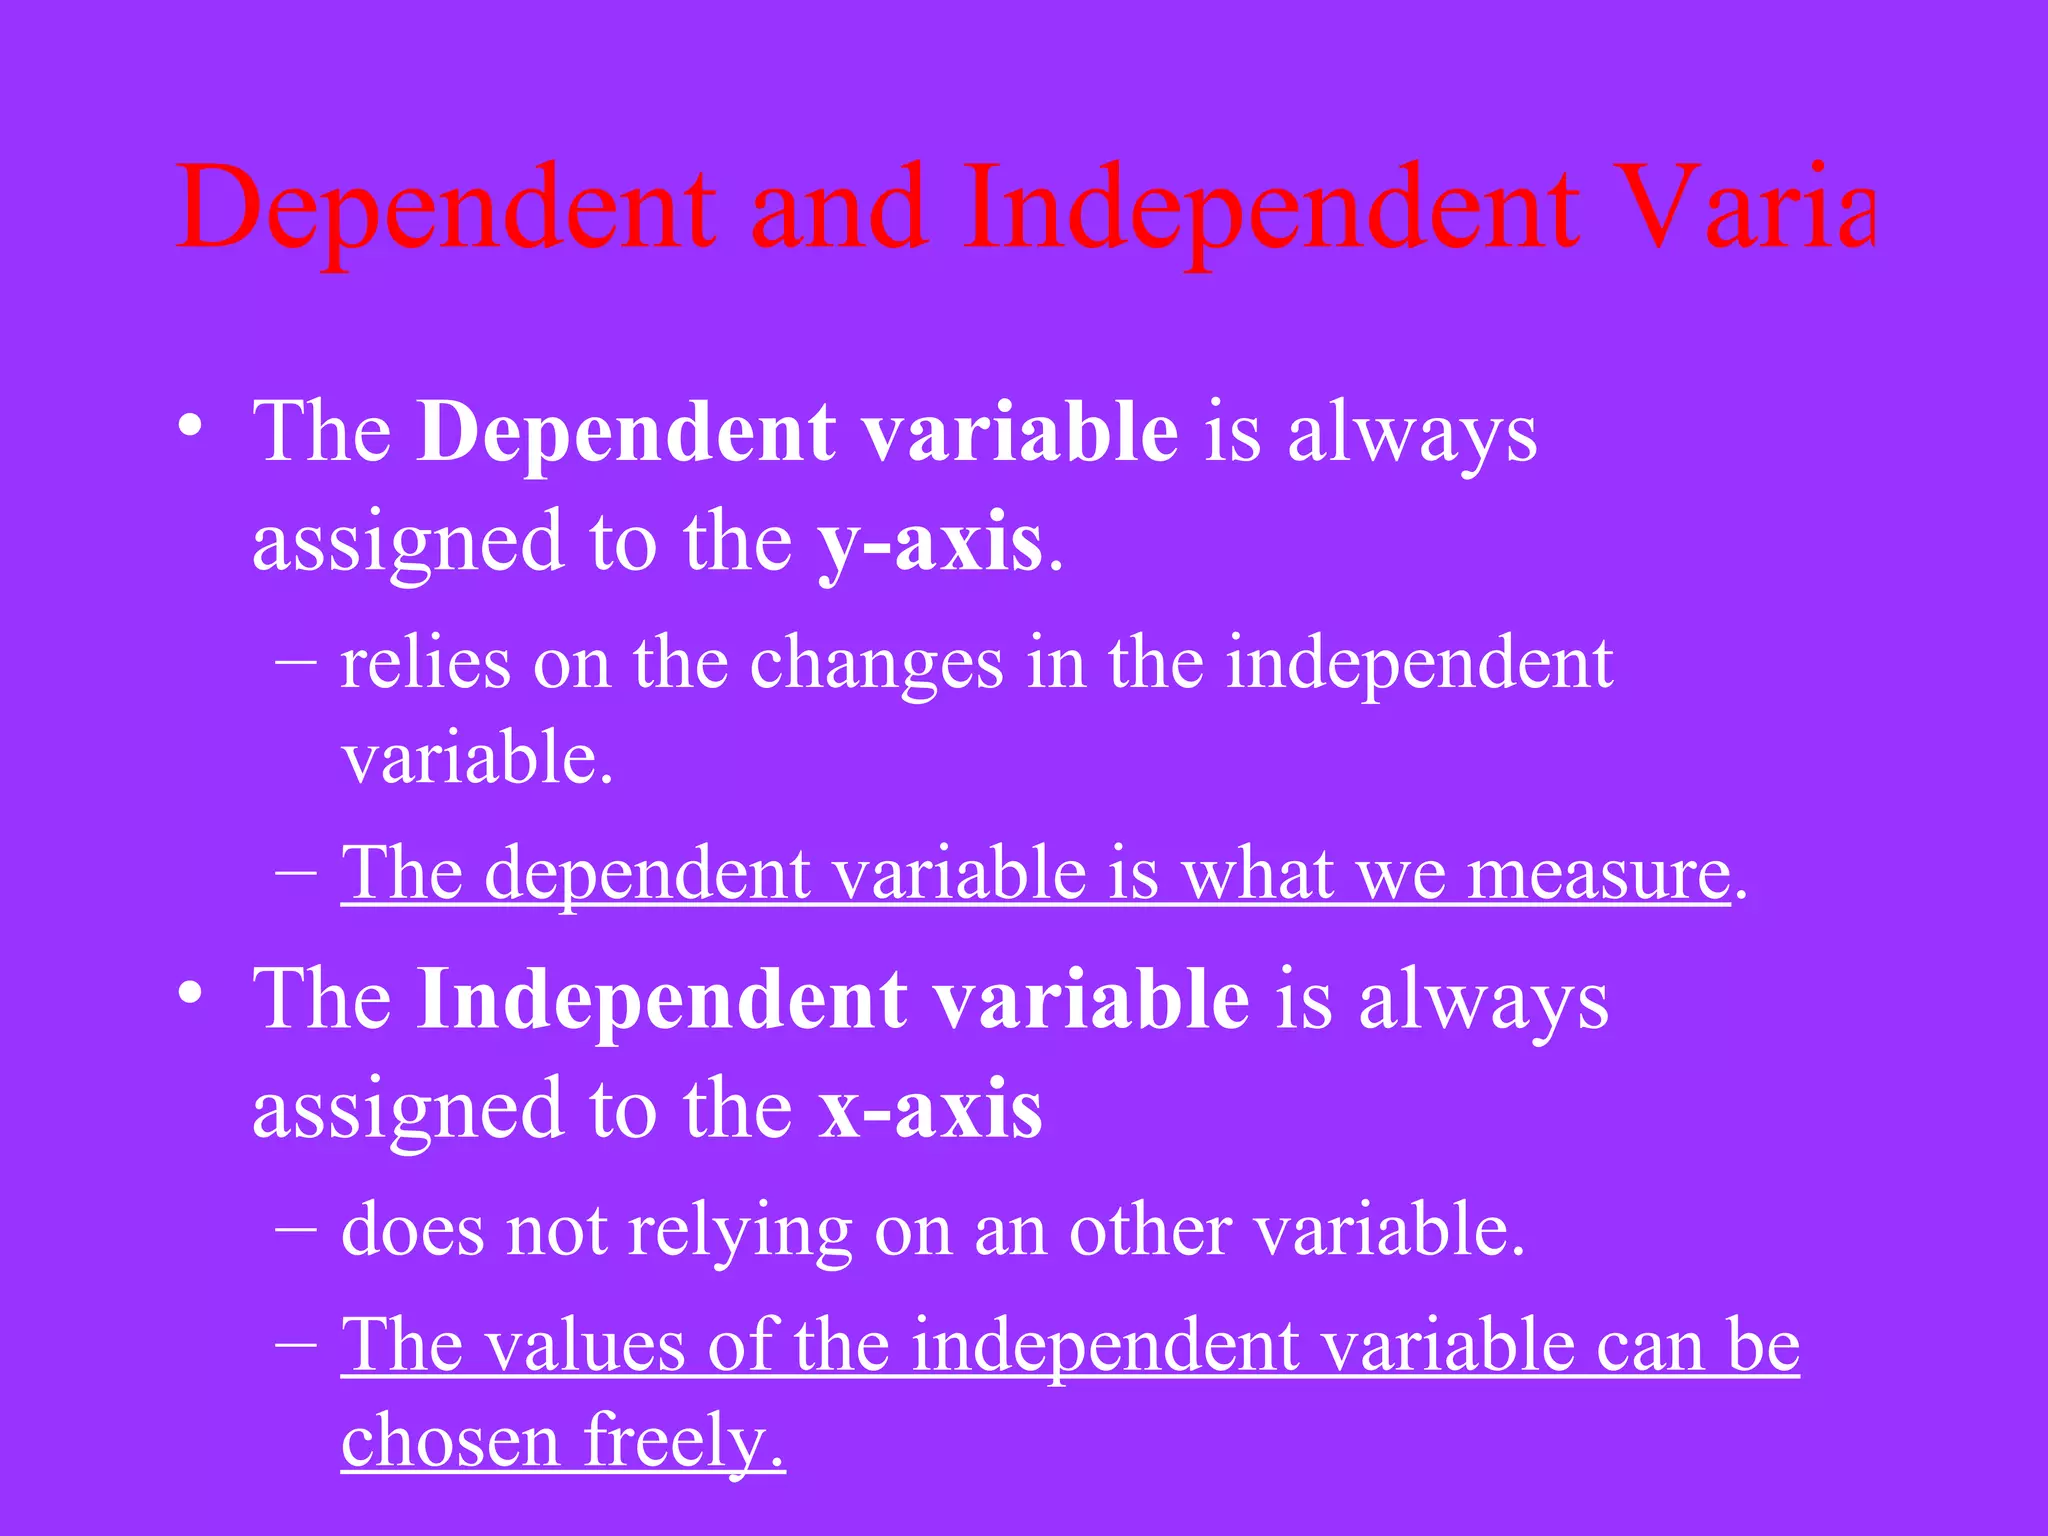
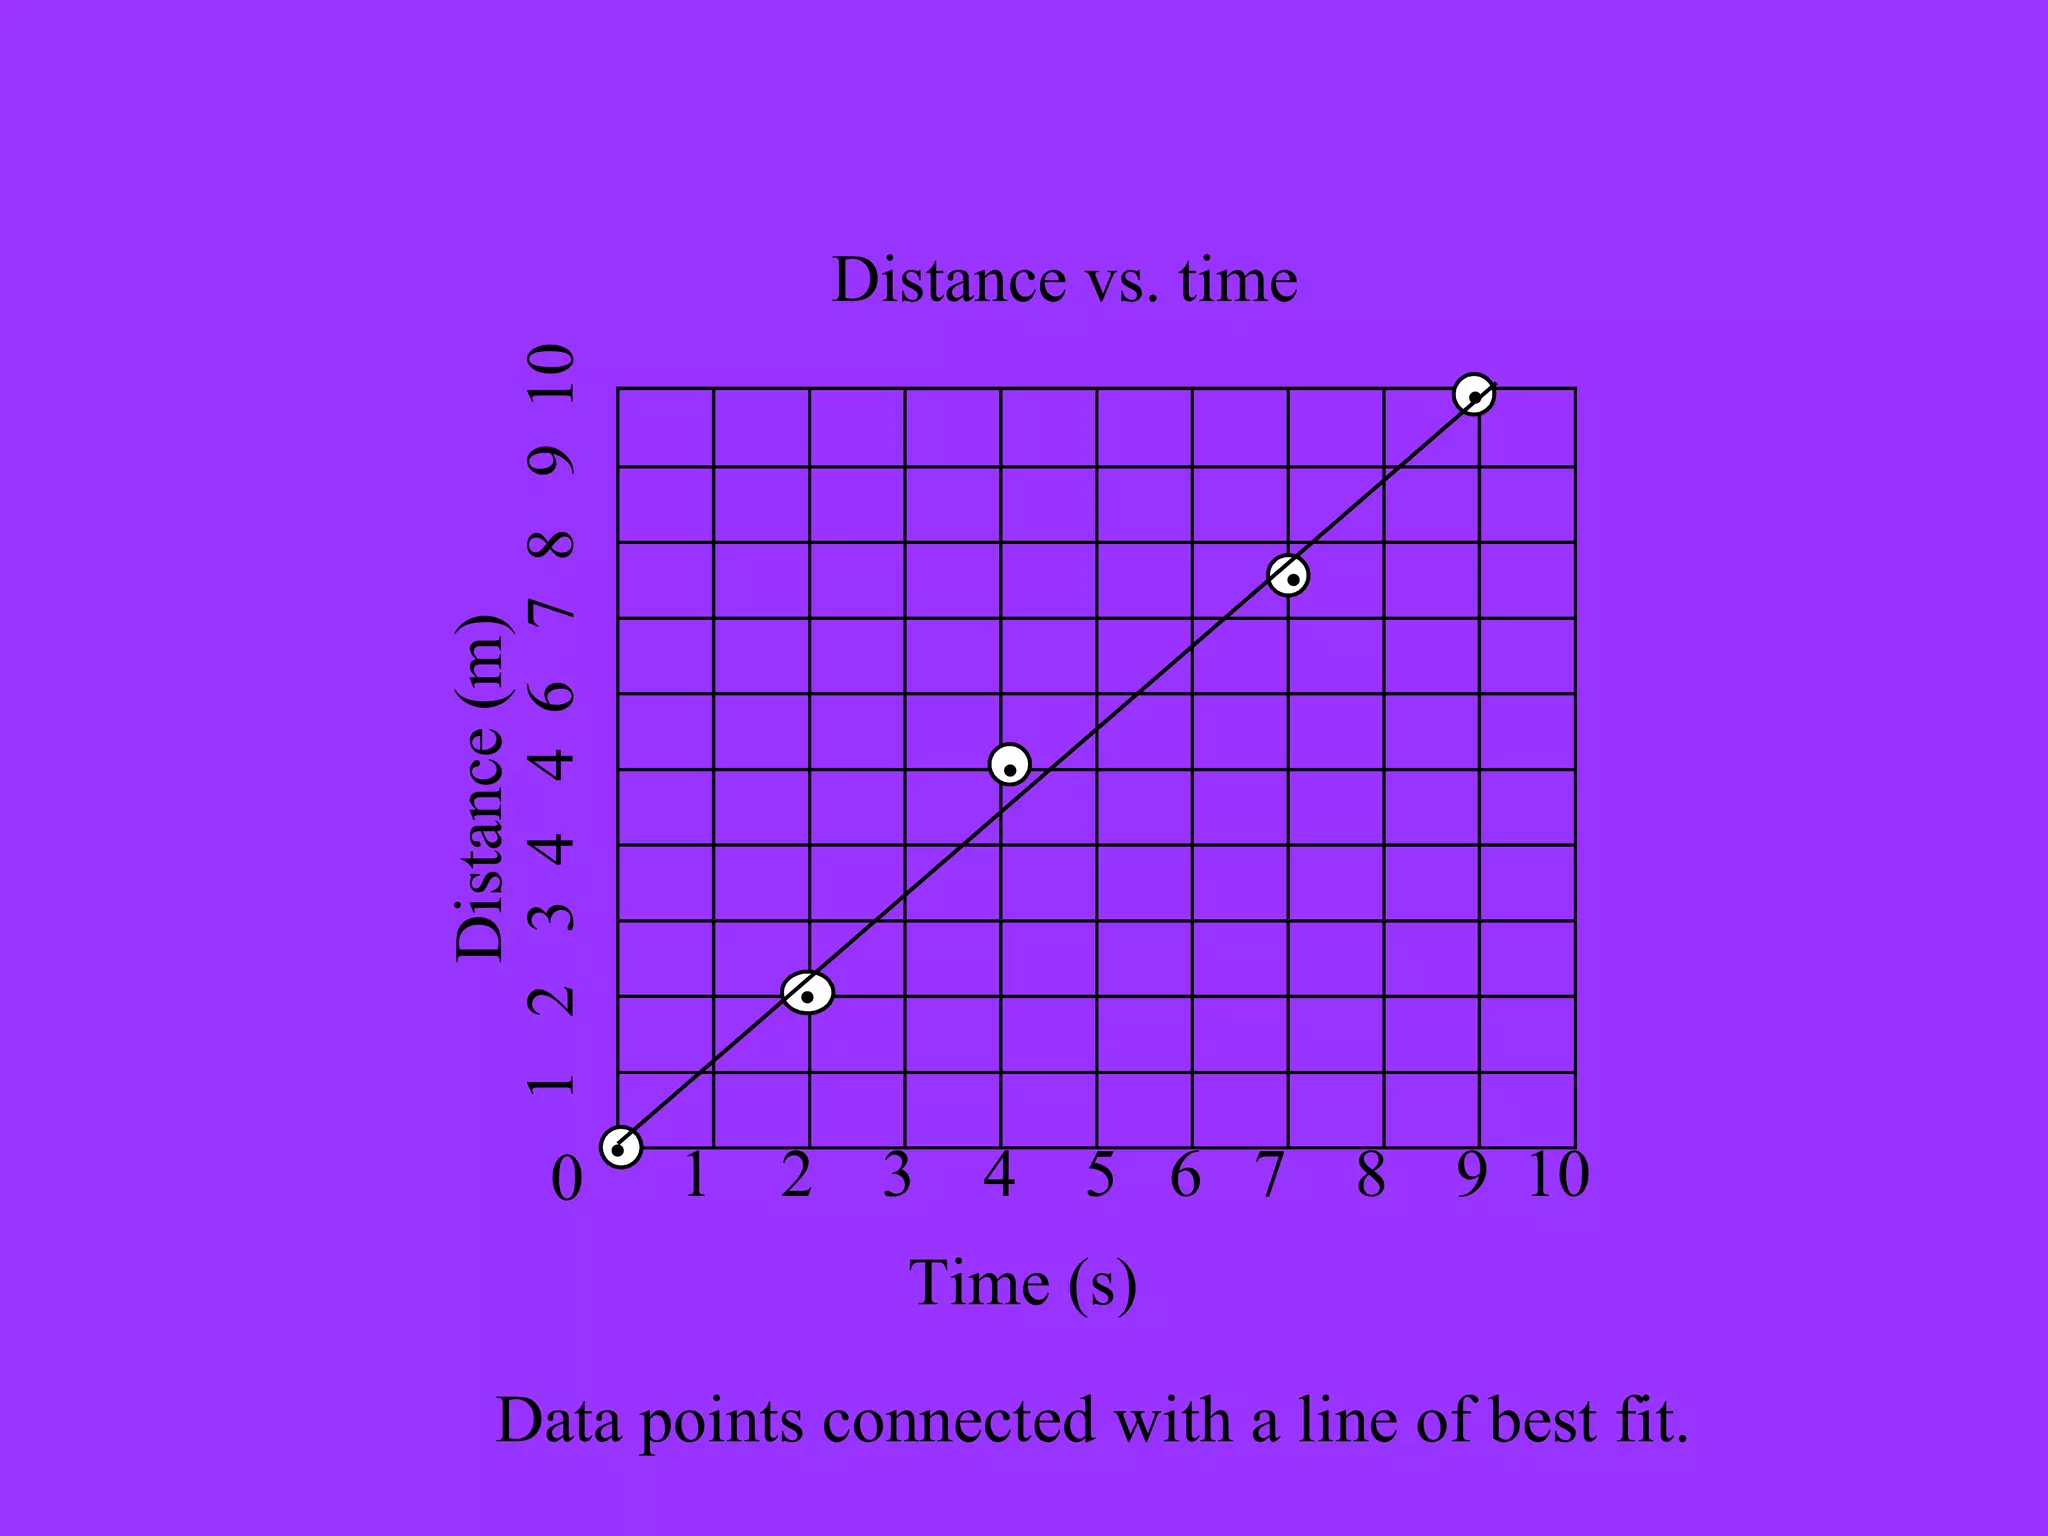
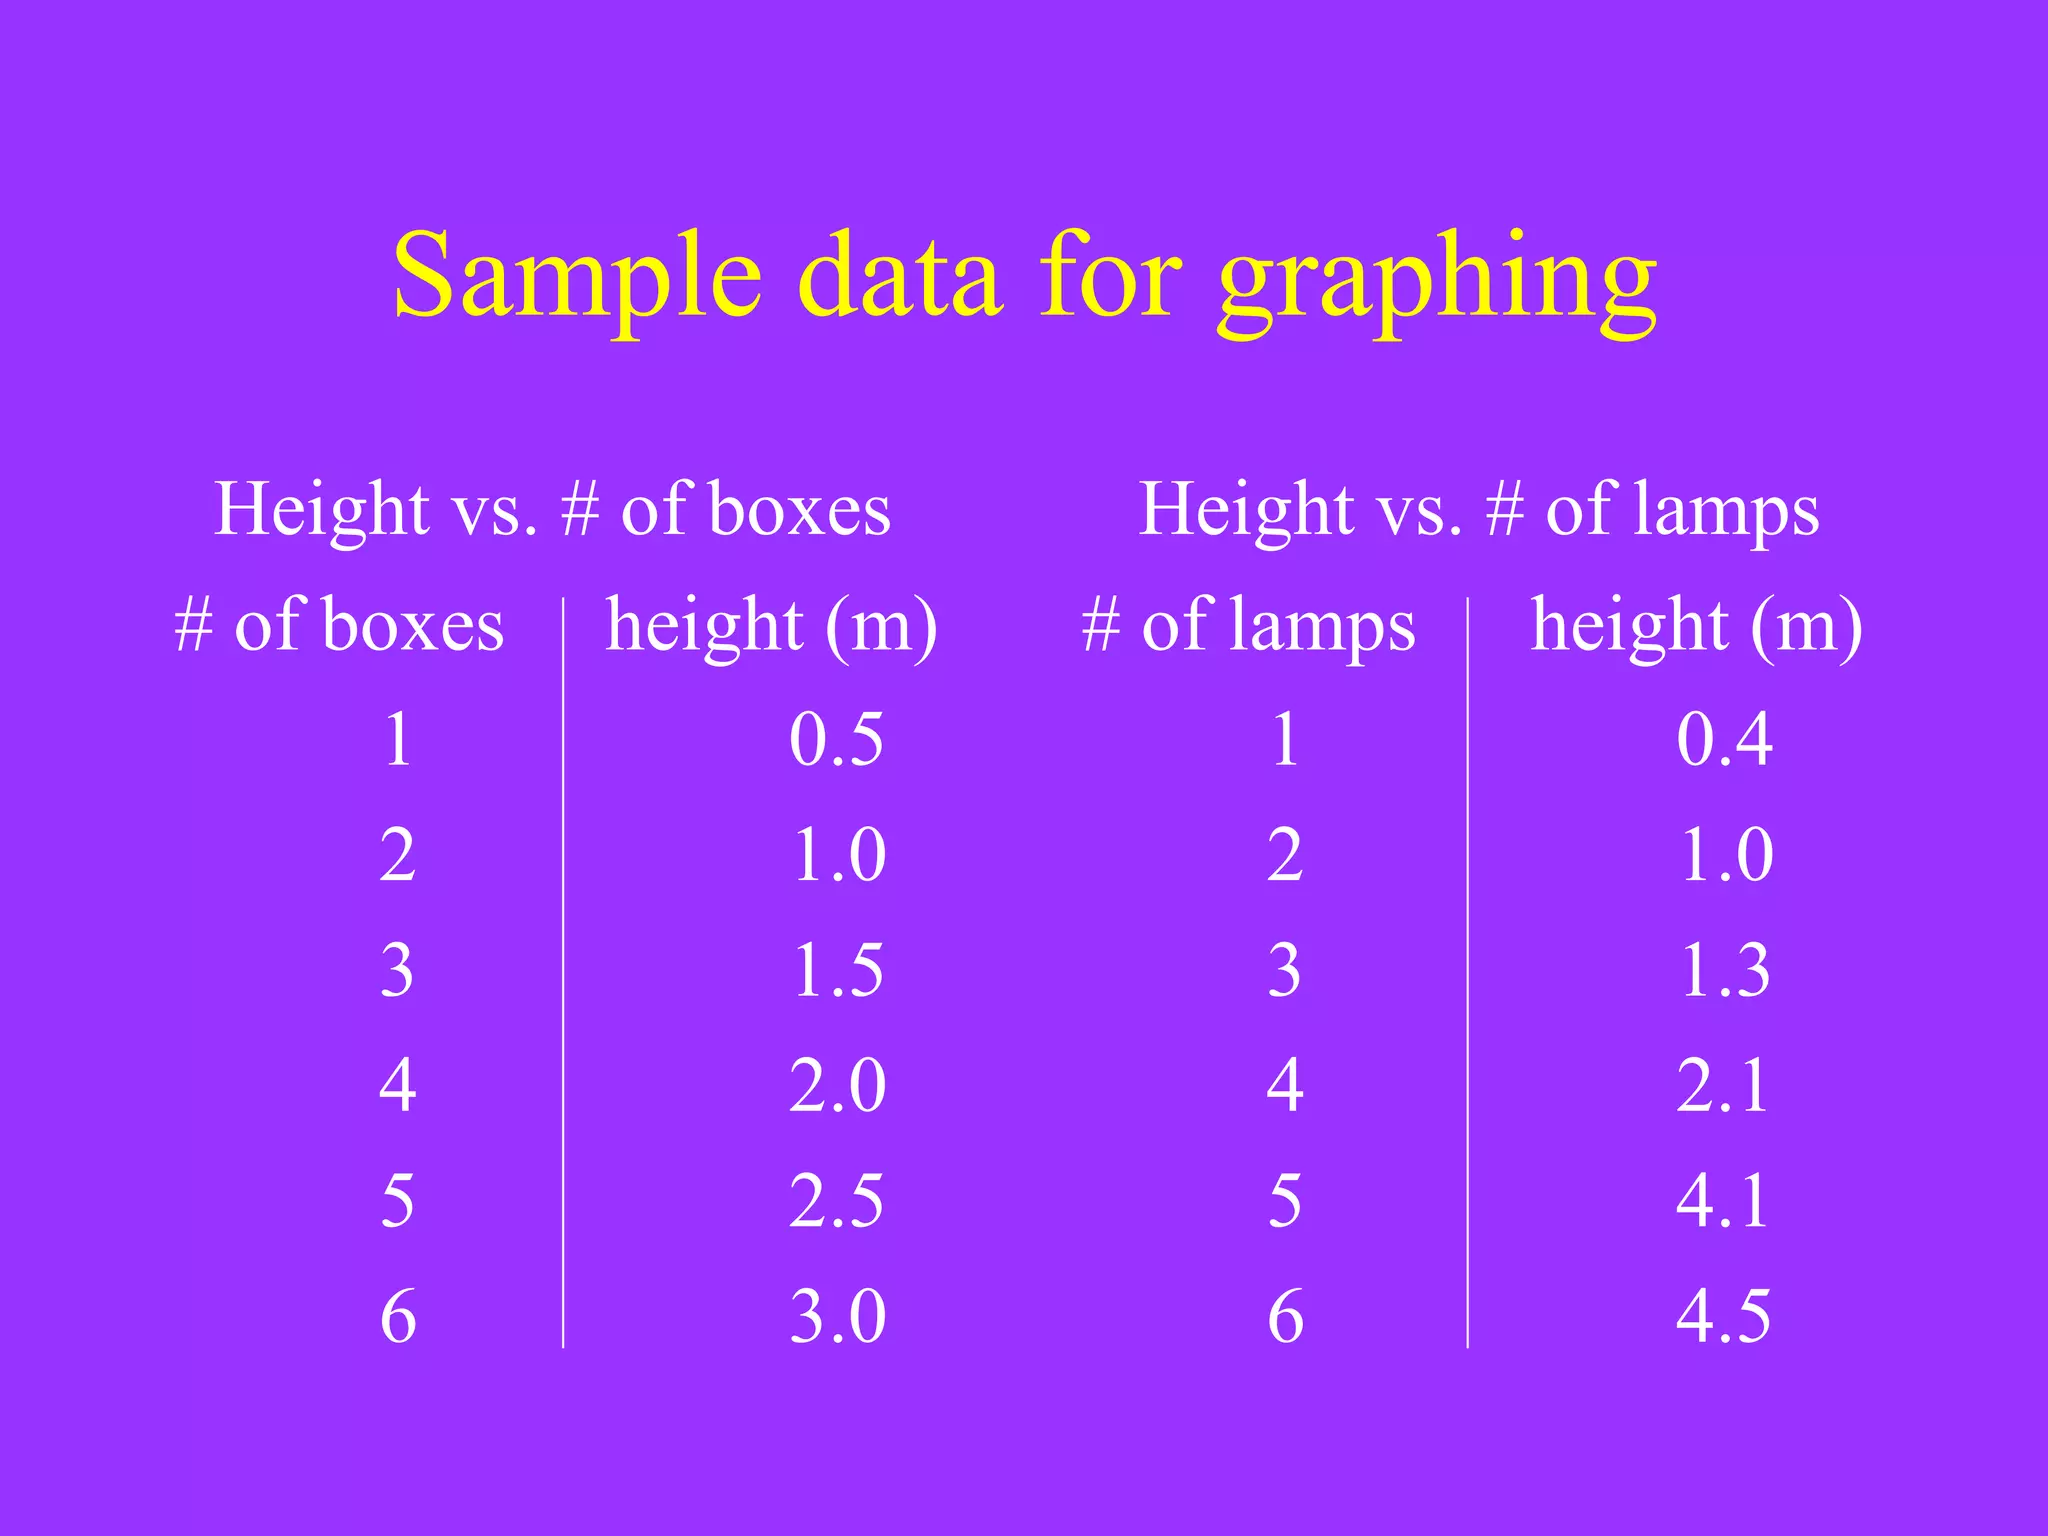
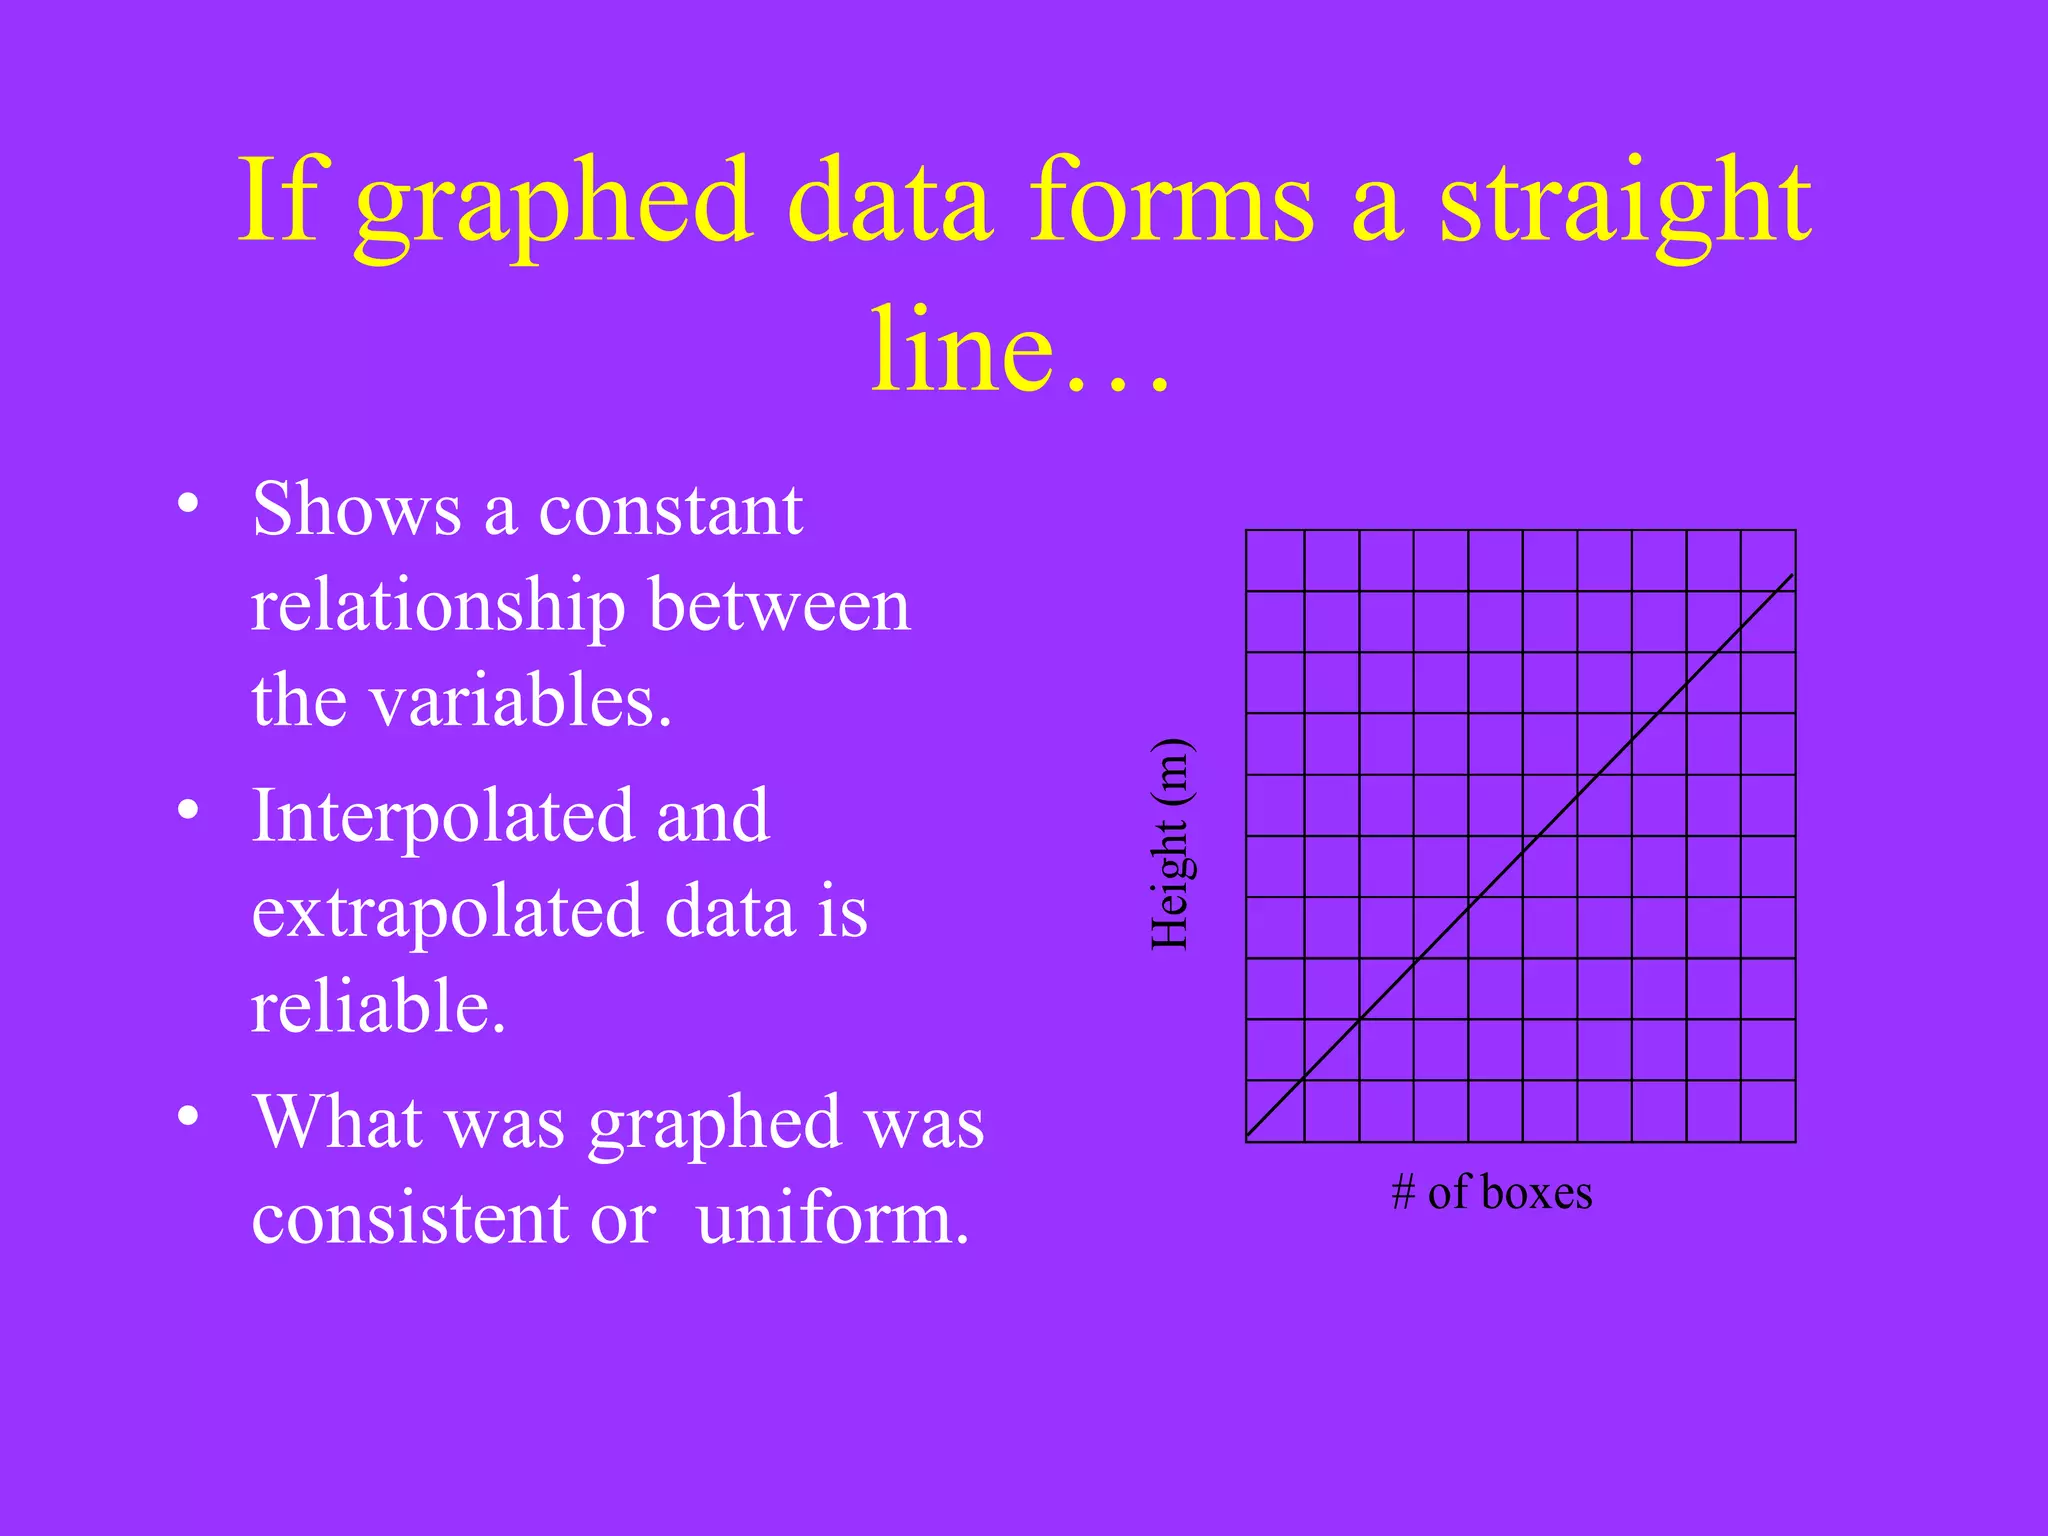
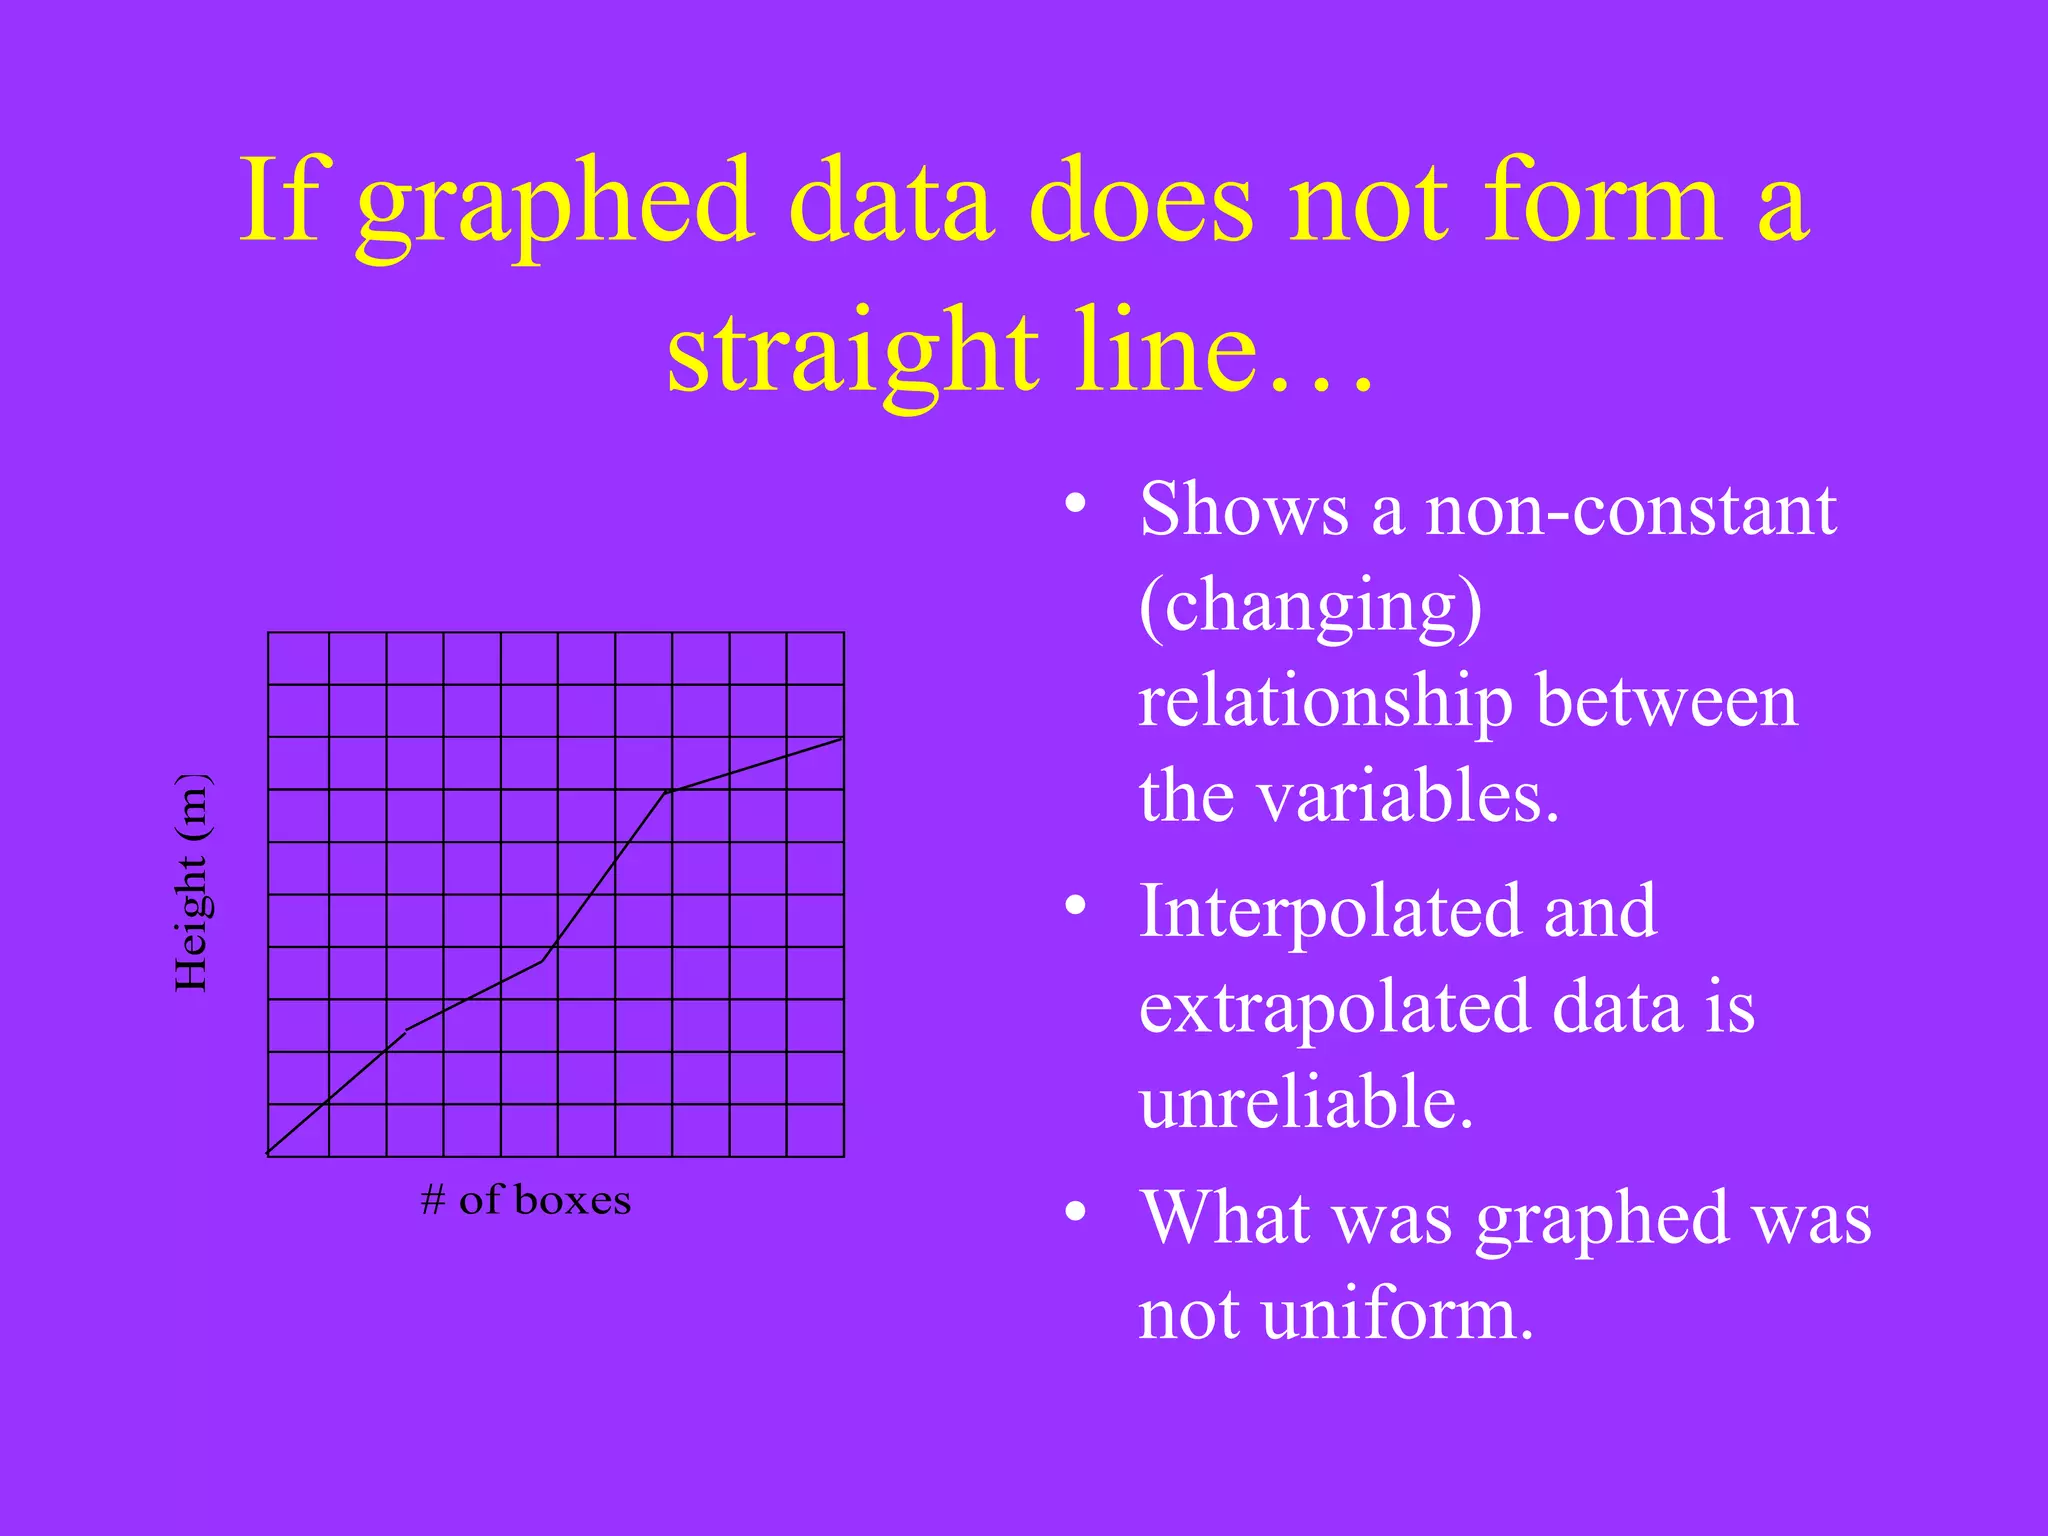
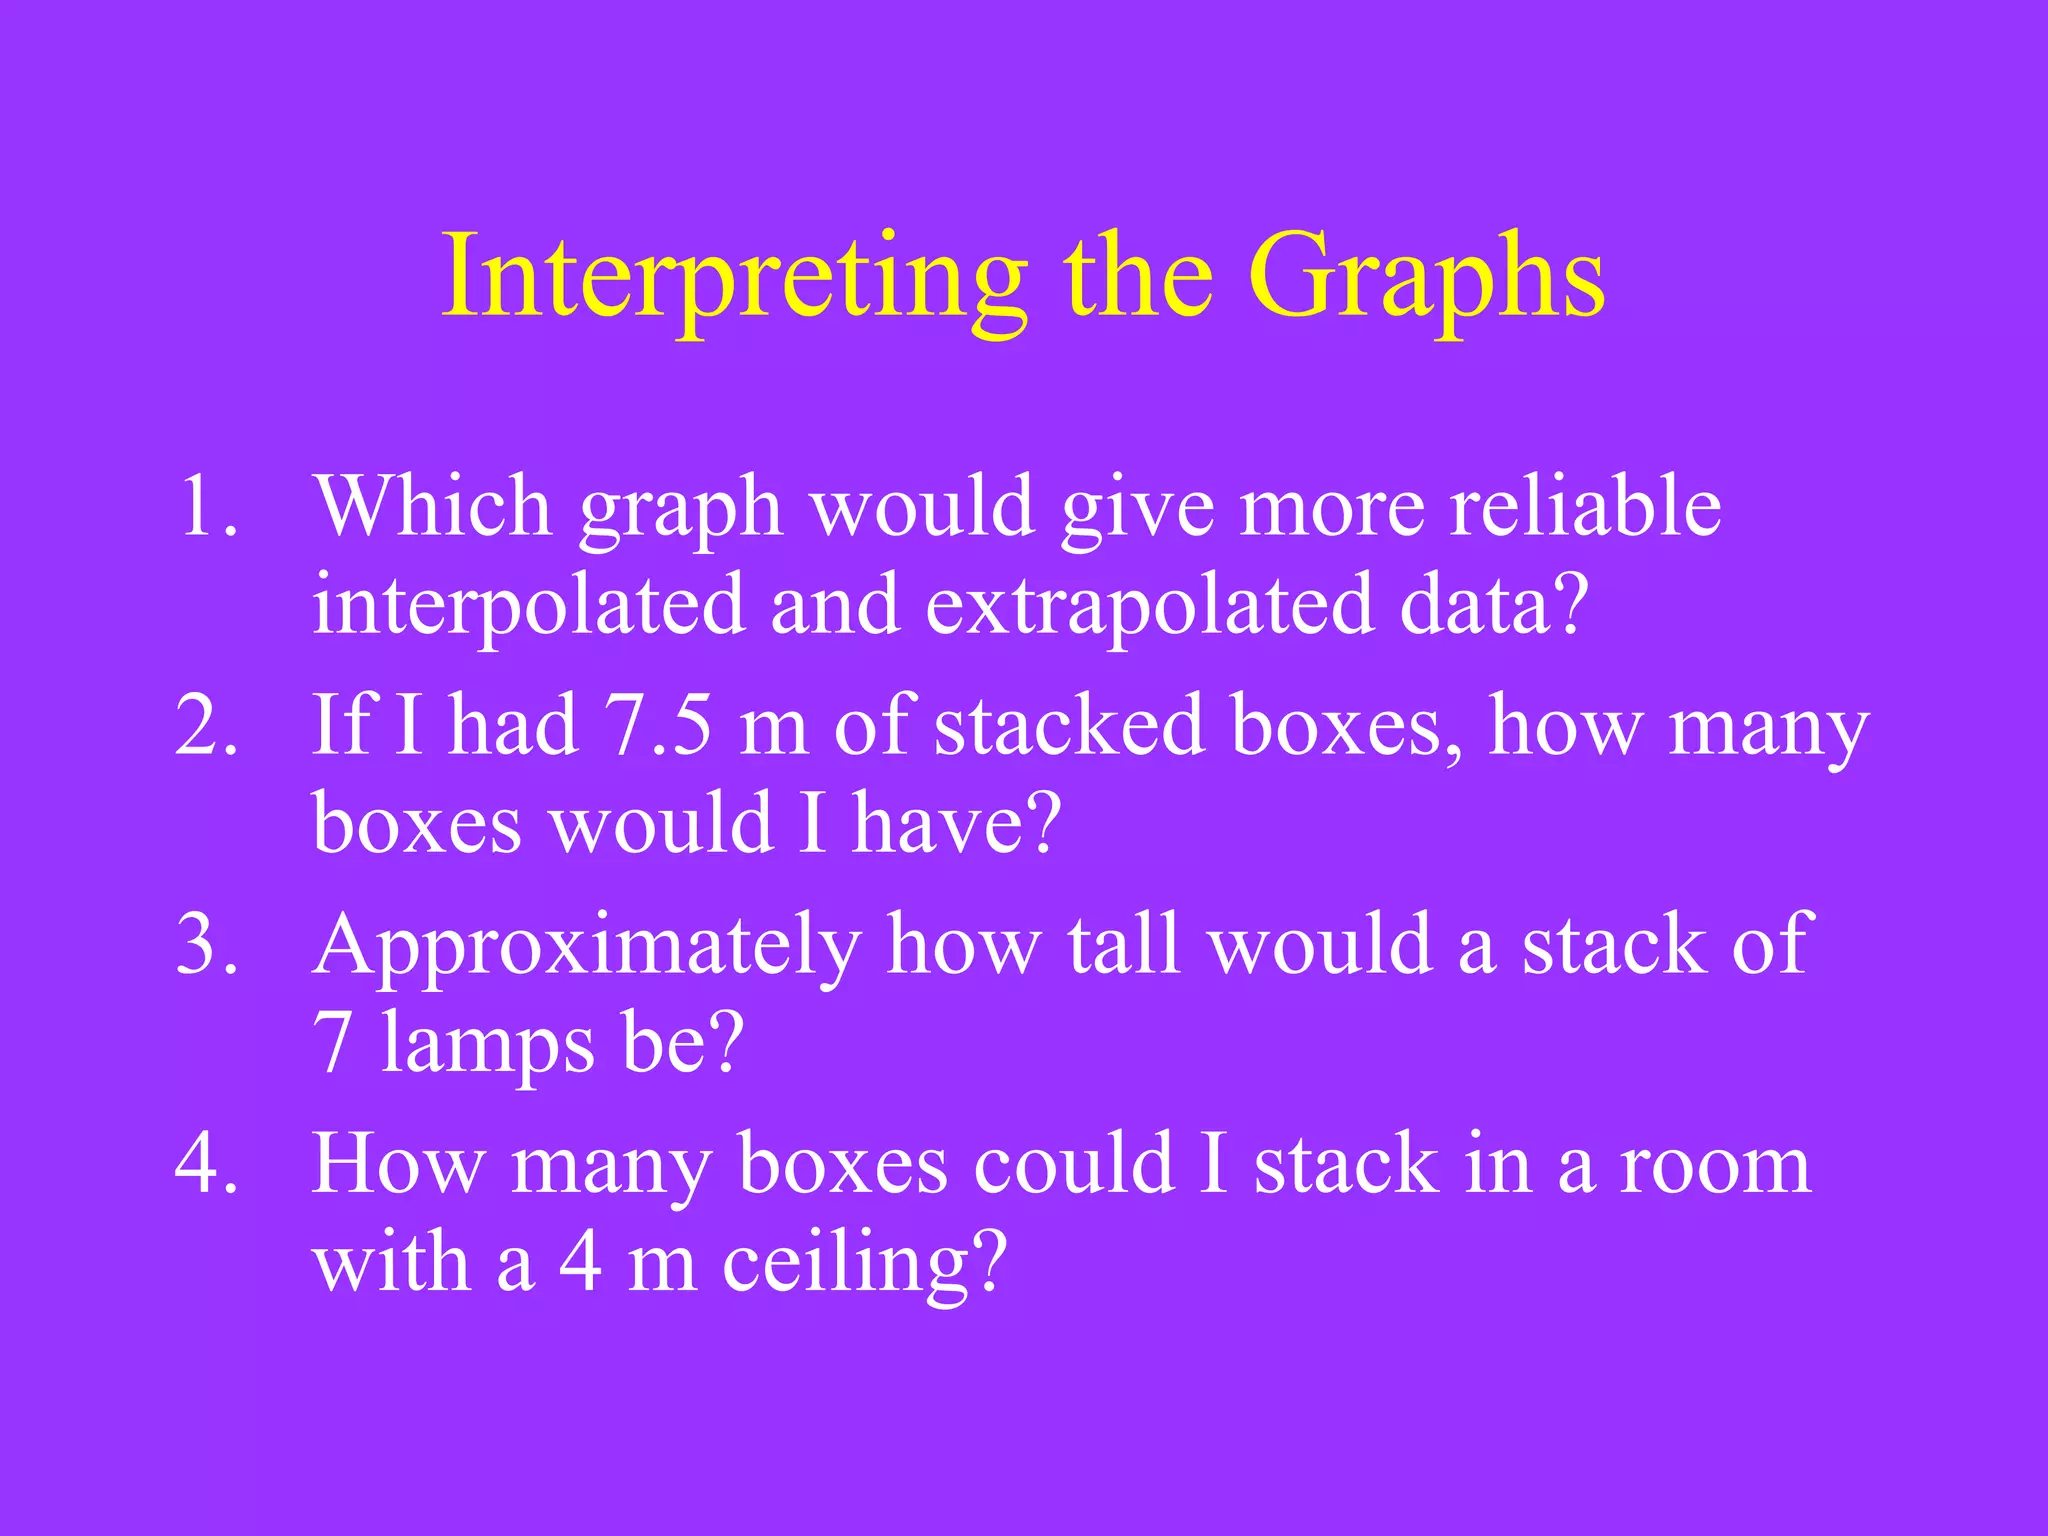
While reviewing this presentation answer the following questions. Explain to me what the purpose is behind graphing. What are Dependent and Independent Variables ? What does it mean to interpolate and extrapolate? What does a straight line in a line graph mean?
Why do we graph data? To show the relationship between the graphed variables. (Without calculations) To gain interpolated and extrapolated data.  “ inter” – in between data points. “ extra” – outside of data points.
Graphing is NOT: Easier – Quitting after data collection is easier than graphing the data! More visual – A data table is also a visual! More organized – A data table is organized, by its very design!
Rules for Graphing Label x and y axes.  Include units. Title your graph.  (y vs. x will always work if you can’t be more descriptive!) Number axes consistently and consecutively.  Use > 75% of each axis. Plot data with a fine, accurate point.  Circle data points so they are easily located. Connect data points with a smooth curve or with a line of best fit.
Dependent and Independent Variables The  Dependent variable  is always assigned to the  y-axis .  relies on the changes in the independent variable. The dependent variable is what we measure . The  Independent variable  is always assigned to the  x-axis   does not relying on an other variable. The values of the independent variable can be chosen freely.
 
Sample data for graphing Height vs. # of boxes # of boxes  height (m) 1 0.5 2 1.0 3 1.5 4 2.0 5 2.5 6 3.0 Height vs. # of lamps # of lamps   height (m) 1 0.4 2 1.0 3 1.3 4 2.1 5 4.1 6 4.5
If graphed data forms a straight line… Shows a constant relationship between the variables. Interpolated and extrapolated data is reliable. What was graphed was consistent or  uniform.
If graphed data does not form a straight line… Shows a non-constant (changing) relationship between the variables. Interpolated and extrapolated data is unreliable. What was graphed was not uniform.
Interpreting the Graphs Which graph would give more reliable interpolated and extrapolated data? If I had 7.5 m of stacked boxes, how many boxes would I have? Approximately how tall would a stack of 7 lamps be? How many boxes could I stack in a room with a 4 m ceiling?

Graphing Notes

  • 1.
    While reviewing thispresentation answer the following questions. Explain to me what the purpose is behind graphing. What are Dependent and Independent Variables ? What does it mean to interpolate and extrapolate? What does a straight line in a line graph mean?
  • 2.
    Why do wegraph data? To show the relationship between the graphed variables. (Without calculations) To gain interpolated and extrapolated data. “ inter” – in between data points. “ extra” – outside of data points.
  • 3.
    Graphing is NOT:Easier – Quitting after data collection is easier than graphing the data! More visual – A data table is also a visual! More organized – A data table is organized, by its very design!
  • 4.
    Rules for GraphingLabel x and y axes. Include units. Title your graph. (y vs. x will always work if you can’t be more descriptive!) Number axes consistently and consecutively. Use > 75% of each axis. Plot data with a fine, accurate point. Circle data points so they are easily located. Connect data points with a smooth curve or with a line of best fit.
  • 5.
    Dependent and IndependentVariables The Dependent variable is always assigned to the y-axis . relies on the changes in the independent variable. The dependent variable is what we measure . The Independent variable is always assigned to the x-axis does not relying on an other variable. The values of the independent variable can be chosen freely.
  • 6.
  • 7.
    Sample data forgraphing Height vs. # of boxes # of boxes height (m) 1 0.5 2 1.0 3 1.5 4 2.0 5 2.5 6 3.0 Height vs. # of lamps # of lamps height (m) 1 0.4 2 1.0 3 1.3 4 2.1 5 4.1 6 4.5
  • 8.
    If graphed dataforms a straight line… Shows a constant relationship between the variables. Interpolated and extrapolated data is reliable. What was graphed was consistent or uniform.
  • 9.
    If graphed datadoes not form a straight line… Shows a non-constant (changing) relationship between the variables. Interpolated and extrapolated data is unreliable. What was graphed was not uniform.
  • 10.
    Interpreting the GraphsWhich graph would give more reliable interpolated and extrapolated data? If I had 7.5 m of stacked boxes, how many boxes would I have? Approximately how tall would a stack of 7 lamps be? How many boxes could I stack in a room with a 4 m ceiling?