SlideShare a Scribd company logo
1 of 18
Mrs.P.Kalaiselvi, M.Sc.,,M.A.,
Ms.S.Swathi Sundari, M.Sc.,M.Phil.,
Assumptions :
1. The sample of paired data (x,y) is a
random sample.
2. The pairs of (x,y) data are normally
distributed.
 Measures the degree of linear association
between two scaled variables analysis of the
relationship between two quantitative outcomes,.
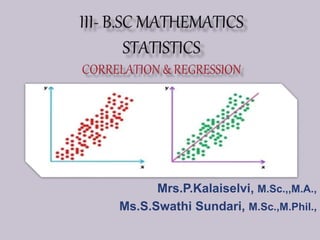
 Scatterplot (or scatter diagram)
is a graph in which the paired
(x,y) sample data are plotted with
a horizontal x axis and a vertical
y axis. Each individual (x,y) pair
is plotted as a single point.
 POSITIVE CORRELATION
Examples :
 Height and weight of a batch of students
 Income and expenditure of a family
 NEGATIVE CORRELATION
Examples :
 Price and demand
 Volume v and pressure p of a perfect gas
Scatter Diagram of Paired Data
Restaurant Bill (x) and Tip (y)
x x
yy y
x
Sample Scatter Plots showing various degrees of “positive”
correlation. That is, when x increases y also increases
(a) Positive (b) Strong
positive
(c) Perfect
positive
x x
yy y
x
(d) Negative (e) Strong
negative
(f) Perfect
negative
Sample Scatter Plots showing various degrees of
“negative” correlation. When x increases y decreases
x x
yy
(g) No Correlation (h) Nonlinear Correlation
Sample Scatter Plots showing NO linear correlation. The first plot (g)
has no correlation of any kind. The other plot (h) shows a clear
correlation between x and y, but the correlation is NOT LINEAR.
Nonlinear correlation can be studied, but it is beyond this class. We
will only study LINEAR CORRELATION.
 The correlation coefficient is independent of the
change of origin and scale.
 The values of the linear correlation coefficient are ALWAYS
between -1 and +1.
 If the correlation coefficient = 1 then the correlation
is perfect and positive.
 If the correlation coefficient = -1 then the correlation
is perfect and negative.
 If the correlation coefficient = 0 then the variables
are uncorrelated.
 If the variables x and y are uncorrelated then
Cov (x,y) = 0.
The Linear Correlation Coefficient r,
can be written as
  
       
2 22 2
n xy x y
r
n x x n y y


 
  
   
 Correlation coefficient is the geometric mean
between the regression coefficients.
 If one of the regression coefficient is greater than
unity the other is less than unity.
 Arithmetic mean of the regression coefficients is
greater than or equal to the correlation coefficient.
 Regression coefficients are independent of the
change of origin but dependent on change of scale.
Regression Line Plotted on Scatter Plot
The Regression Line is the line of “best fit”
through the data points. “Best fit” means the
sum of the vertical distances between each
data point and the regression line is
minimized.
 x is the independent variable (predictor
variable)
 y-hat is the dependent variable
(response variable)
0 1
ˆy b b x 
b0 is the y-
intercept or the
value at which
the regression
line crosses the
vertical axis
b1 is the slope of
the regression line
or the amount of
change in y for
every 1 unit change
in x
y-hat is the
“dependent” or
“response” variable
because it depends
on, or responds to
the value of x
x is the “independent”
or “predictor” variable
because it acts
independently to
predict the value of y-
hat
Statistics
Statistics

More Related Content

What's hot

Regression Analysis presentation by Al Arizmendez and Cathryn Lottier
Regression Analysis presentation by Al Arizmendez and Cathryn LottierRegression Analysis presentation by Al Arizmendez and Cathryn Lottier
Regression Analysis presentation by Al Arizmendez and Cathryn LottierAl Arizmendez
 
Regression analysis
Regression analysisRegression analysis
Regression analysisRavi shankar
 
Linear correlation
Linear correlationLinear correlation
Linear correlationTech_MX
 
Simple regression and correlation
Simple regression and correlationSimple regression and correlation
Simple regression and correlationMary Grace
 
Correlation analysis
Correlation analysis Correlation analysis
Correlation analysis Anil Pokhrel
 
Regression & correlation
Regression & correlationRegression & correlation
Regression & correlationAtiq Rehman
 
Correlation
CorrelationCorrelation
CorrelationTech_MX
 
Stats 3000 Week 2 - Winter 2011
Stats 3000 Week 2 - Winter 2011Stats 3000 Week 2 - Winter 2011
Stats 3000 Week 2 - Winter 2011Lauren Crosby
 
Linear regression
Linear regressionLinear regression
Linear regressionSreerajVA
 
Presentation on regression analysis
Presentation on regression analysisPresentation on regression analysis
Presentation on regression analysisSujeet Singh
 
Correlation
CorrelationCorrelation
Correlationancytd
 

What's hot (18)

Regression Analysis presentation by Al Arizmendez and Cathryn Lottier
Regression Analysis presentation by Al Arizmendez and Cathryn LottierRegression Analysis presentation by Al Arizmendez and Cathryn Lottier
Regression Analysis presentation by Al Arizmendez and Cathryn Lottier
 
Scattergrams
ScattergramsScattergrams
Scattergrams
 
Regression analysis
Regression analysisRegression analysis
Regression analysis
 
Simple correlation
Simple correlationSimple correlation
Simple correlation
 
Linear correlation
Linear correlationLinear correlation
Linear correlation
 
Simple regression and correlation
Simple regression and correlationSimple regression and correlation
Simple regression and correlation
 
Study of Correlation
Study of Correlation Study of Correlation
Study of Correlation
 
Correlation
CorrelationCorrelation
Correlation
 
Correlation analysis
Correlation analysis Correlation analysis
Correlation analysis
 
Regression & correlation
Regression & correlationRegression & correlation
Regression & correlation
 
Correlation
CorrelationCorrelation
Correlation
 
Stats 3000 Week 2 - Winter 2011
Stats 3000 Week 2 - Winter 2011Stats 3000 Week 2 - Winter 2011
Stats 3000 Week 2 - Winter 2011
 
Correlation
Correlation Correlation
Correlation
 
Linear regression
Linear regressionLinear regression
Linear regression
 
Simple linear regression
Simple linear regressionSimple linear regression
Simple linear regression
 
Presentation on regression analysis
Presentation on regression analysisPresentation on regression analysis
Presentation on regression analysis
 
Regression
RegressionRegression
Regression
 
Correlation
CorrelationCorrelation
Correlation
 

Similar to Statistics

correlation and r3433333333333333333333333333333333333333333333333egratio111n...
correlation and r3433333333333333333333333333333333333333333333333egratio111n...correlation and r3433333333333333333333333333333333333333333333333egratio111n...
correlation and r3433333333333333333333333333333333333333333333333egratio111n...Ghaneshwer Jharbade
 
Sumit presentation
Sumit presentationSumit presentation
Sumit presentationSumit Bharti
 
Correlation and Regression
Correlation and RegressionCorrelation and Regression
Correlation and RegressionShubham Mehta
 
Correlation and regression impt
Correlation and regression imptCorrelation and regression impt
Correlation and regression imptfreelancer
 
TTests.ppt
TTests.pptTTests.ppt
TTests.pptMUzair21
 
SM_d89ccf05-7de1-4a30-a134-3143e9b3bf3f_38.pptx
SM_d89ccf05-7de1-4a30-a134-3143e9b3bf3f_38.pptxSM_d89ccf05-7de1-4a30-a134-3143e9b3bf3f_38.pptx
SM_d89ccf05-7de1-4a30-a134-3143e9b3bf3f_38.pptxManjulasingh17
 
Correlation engineering mathematics
Correlation  engineering mathematicsCorrelation  engineering mathematics
Correlation engineering mathematicsErSaurabh2
 
correlation.final.ppt (1).pptx
correlation.final.ppt (1).pptxcorrelation.final.ppt (1).pptx
correlation.final.ppt (1).pptxChieWoo1
 
Calculation of covariance and simple linear models
Calculation of covariance and simple linear models Calculation of covariance and simple linear models
Calculation of covariance and simple linear models Thendral Kumaresan
 
direct and inverse proportion
direct and inverse proportiondirect and inverse proportion
direct and inverse proportionSantosh Kumar
 

Similar to Statistics (20)

correlation and r3433333333333333333333333333333333333333333333333egratio111n...
correlation and r3433333333333333333333333333333333333333333333333egratio111n...correlation and r3433333333333333333333333333333333333333333333333egratio111n...
correlation and r3433333333333333333333333333333333333333333333333egratio111n...
 
Sumit presentation
Sumit presentationSumit presentation
Sumit presentation
 
Correlation and Regression
Correlation and RegressionCorrelation and Regression
Correlation and Regression
 
Chap04 01
Chap04 01Chap04 01
Chap04 01
 
Correlation and regression impt
Correlation and regression imptCorrelation and regression impt
Correlation and regression impt
 
Correlation and Regression
Correlation and RegressionCorrelation and Regression
Correlation and Regression
 
9. parametric regression
9. parametric regression9. parametric regression
9. parametric regression
 
Regression
RegressionRegression
Regression
 
Regression
RegressionRegression
Regression
 
Linear regression
Linear regressionLinear regression
Linear regression
 
TTests.ppt
TTests.pptTTests.ppt
TTests.ppt
 
Correlation and Regression
Correlation and Regression Correlation and Regression
Correlation and Regression
 
SM_d89ccf05-7de1-4a30-a134-3143e9b3bf3f_38.pptx
SM_d89ccf05-7de1-4a30-a134-3143e9b3bf3f_38.pptxSM_d89ccf05-7de1-4a30-a134-3143e9b3bf3f_38.pptx
SM_d89ccf05-7de1-4a30-a134-3143e9b3bf3f_38.pptx
 
Correlation engineering mathematics
Correlation  engineering mathematicsCorrelation  engineering mathematics
Correlation engineering mathematics
 
correlation.final.ppt (1).pptx
correlation.final.ppt (1).pptxcorrelation.final.ppt (1).pptx
correlation.final.ppt (1).pptx
 
Calculation of covariance and simple linear models
Calculation of covariance and simple linear models Calculation of covariance and simple linear models
Calculation of covariance and simple linear models
 
direct and inverse proportion
direct and inverse proportiondirect and inverse proportion
direct and inverse proportion
 
S1 pb
S1 pbS1 pb
S1 pb
 
Correlation
CorrelationCorrelation
Correlation
 
Correlation
CorrelationCorrelation
Correlation
 

More from SwathiSundari

Time and Distance.ppt
Time and Distance.pptTime and Distance.ppt
Time and Distance.pptSwathiSundari
 
Application of graph theory in Traffic Management
Application of graph theory in Traffic ManagementApplication of graph theory in Traffic Management
Application of graph theory in Traffic ManagementSwathiSundari
 
The instant insanity game
The instant insanity game The instant insanity game
The instant insanity game SwathiSundari
 
Kirchoff''s matrix tree theorem
Kirchoff''s matrix tree theoremKirchoff''s matrix tree theorem
Kirchoff''s matrix tree theoremSwathiSundari
 
Data transfer using bipartite graph
Data transfer using bipartite graphData transfer using bipartite graph
Data transfer using bipartite graphSwathiSundari
 
Analytical Geometry in three dimension
Analytical Geometry in three dimensionAnalytical Geometry in three dimension
Analytical Geometry in three dimensionSwathiSundari
 

More from SwathiSundari (17)

Time and Distance.ppt
Time and Distance.pptTime and Distance.ppt
Time and Distance.ppt
 
Calender.ppt
Calender.pptCalender.ppt
Calender.ppt
 
Allied maths ii
Allied maths iiAllied maths ii
Allied maths ii
 
Z transform
Z transformZ transform
Z transform
 
Cone
ConeCone
Cone
 
Boolean Algebra
Boolean AlgebraBoolean Algebra
Boolean Algebra
 
Application of graph theory in Traffic Management
Application of graph theory in Traffic ManagementApplication of graph theory in Traffic Management
Application of graph theory in Traffic Management
 
The instant insanity game
The instant insanity game The instant insanity game
The instant insanity game
 
Kirchoff''s matrix tree theorem
Kirchoff''s matrix tree theoremKirchoff''s matrix tree theorem
Kirchoff''s matrix tree theorem
 
Data transfer using bipartite graph
Data transfer using bipartite graphData transfer using bipartite graph
Data transfer using bipartite graph
 
Fuzzy sets
Fuzzy setsFuzzy sets
Fuzzy sets
 
Ancillary maths ii
Ancillary maths iiAncillary maths ii
Ancillary maths ii
 
Analytical Geometry in three dimension
Analytical Geometry in three dimensionAnalytical Geometry in three dimension
Analytical Geometry in three dimension
 
Operations Research
Operations ResearchOperations Research
Operations Research
 
Operation Research
Operation ResearchOperation Research
Operation Research
 
Theory of Equation
Theory of EquationTheory of Equation
Theory of Equation
 
Game theory
Game theoryGame theory
Game theory
 

Recently uploaded

The basics of sentences session 2pptx copy.pptx
The basics of sentences session 2pptx copy.pptxThe basics of sentences session 2pptx copy.pptx
The basics of sentences session 2pptx copy.pptxheathfieldcps1
 
Employee wellbeing at the workplace.pptx
Employee wellbeing at the workplace.pptxEmployee wellbeing at the workplace.pptx
Employee wellbeing at the workplace.pptxNirmalaLoungPoorunde1
 
Privatization and Disinvestment - Meaning, Objectives, Advantages and Disadva...
Privatization and Disinvestment - Meaning, Objectives, Advantages and Disadva...Privatization and Disinvestment - Meaning, Objectives, Advantages and Disadva...
Privatization and Disinvestment - Meaning, Objectives, Advantages and Disadva...RKavithamani
 
mini mental status format.docx
mini    mental       status     format.docxmini    mental       status     format.docx
mini mental status format.docxPoojaSen20
 
SOCIAL AND HISTORICAL CONTEXT - LFTVD.pptx
SOCIAL AND HISTORICAL CONTEXT - LFTVD.pptxSOCIAL AND HISTORICAL CONTEXT - LFTVD.pptx
SOCIAL AND HISTORICAL CONTEXT - LFTVD.pptxiammrhaywood
 
Nutritional Needs Presentation - HLTH 104
Nutritional Needs Presentation - HLTH 104Nutritional Needs Presentation - HLTH 104
Nutritional Needs Presentation - HLTH 104misteraugie
 
18-04-UA_REPORT_MEDIALITERAСY_INDEX-DM_23-1-final-eng.pdf
18-04-UA_REPORT_MEDIALITERAСY_INDEX-DM_23-1-final-eng.pdf18-04-UA_REPORT_MEDIALITERAСY_INDEX-DM_23-1-final-eng.pdf
18-04-UA_REPORT_MEDIALITERAСY_INDEX-DM_23-1-final-eng.pdfssuser54595a
 
Accessible design: Minimum effort, maximum impact
Accessible design: Minimum effort, maximum impactAccessible design: Minimum effort, maximum impact
Accessible design: Minimum effort, maximum impactdawncurless
 
CARE OF CHILD IN INCUBATOR..........pptx
CARE OF CHILD IN INCUBATOR..........pptxCARE OF CHILD IN INCUBATOR..........pptx
CARE OF CHILD IN INCUBATOR..........pptxGaneshChakor2
 
Advanced Views - Calendar View in Odoo 17
Advanced Views - Calendar View in Odoo 17Advanced Views - Calendar View in Odoo 17
Advanced Views - Calendar View in Odoo 17Celine George
 
Paris 2024 Olympic Geographies - an activity
Paris 2024 Olympic Geographies - an activityParis 2024 Olympic Geographies - an activity
Paris 2024 Olympic Geographies - an activityGeoBlogs
 
Presentation by Andreas Schleicher Tackling the School Absenteeism Crisis 30 ...
Presentation by Andreas Schleicher Tackling the School Absenteeism Crisis 30 ...Presentation by Andreas Schleicher Tackling the School Absenteeism Crisis 30 ...
Presentation by Andreas Schleicher Tackling the School Absenteeism Crisis 30 ...EduSkills OECD
 
How to Make a Pirate ship Primary Education.pptx
How to Make a Pirate ship Primary Education.pptxHow to Make a Pirate ship Primary Education.pptx
How to Make a Pirate ship Primary Education.pptxmanuelaromero2013
 
Z Score,T Score, Percential Rank and Box Plot Graph
Z Score,T Score, Percential Rank and Box Plot GraphZ Score,T Score, Percential Rank and Box Plot Graph
Z Score,T Score, Percential Rank and Box Plot GraphThiyagu K
 
URLs and Routing in the Odoo 17 Website App
URLs and Routing in the Odoo 17 Website AppURLs and Routing in the Odoo 17 Website App
URLs and Routing in the Odoo 17 Website AppCeline George
 
microwave assisted reaction. General introduction
microwave assisted reaction. General introductionmicrowave assisted reaction. General introduction
microwave assisted reaction. General introductionMaksud Ahmed
 
The Most Excellent Way | 1 Corinthians 13
The Most Excellent Way | 1 Corinthians 13The Most Excellent Way | 1 Corinthians 13
The Most Excellent Way | 1 Corinthians 13Steve Thomason
 

Recently uploaded (20)

The basics of sentences session 2pptx copy.pptx
The basics of sentences session 2pptx copy.pptxThe basics of sentences session 2pptx copy.pptx
The basics of sentences session 2pptx copy.pptx
 
Employee wellbeing at the workplace.pptx
Employee wellbeing at the workplace.pptxEmployee wellbeing at the workplace.pptx
Employee wellbeing at the workplace.pptx
 
Privatization and Disinvestment - Meaning, Objectives, Advantages and Disadva...
Privatization and Disinvestment - Meaning, Objectives, Advantages and Disadva...Privatization and Disinvestment - Meaning, Objectives, Advantages and Disadva...
Privatization and Disinvestment - Meaning, Objectives, Advantages and Disadva...
 
mini mental status format.docx
mini    mental       status     format.docxmini    mental       status     format.docx
mini mental status format.docx
 
SOCIAL AND HISTORICAL CONTEXT - LFTVD.pptx
SOCIAL AND HISTORICAL CONTEXT - LFTVD.pptxSOCIAL AND HISTORICAL CONTEXT - LFTVD.pptx
SOCIAL AND HISTORICAL CONTEXT - LFTVD.pptx
 
Nutritional Needs Presentation - HLTH 104
Nutritional Needs Presentation - HLTH 104Nutritional Needs Presentation - HLTH 104
Nutritional Needs Presentation - HLTH 104
 
Mattingly "AI & Prompt Design: The Basics of Prompt Design"
Mattingly "AI & Prompt Design: The Basics of Prompt Design"Mattingly "AI & Prompt Design: The Basics of Prompt Design"
Mattingly "AI & Prompt Design: The Basics of Prompt Design"
 
18-04-UA_REPORT_MEDIALITERAСY_INDEX-DM_23-1-final-eng.pdf
18-04-UA_REPORT_MEDIALITERAСY_INDEX-DM_23-1-final-eng.pdf18-04-UA_REPORT_MEDIALITERAСY_INDEX-DM_23-1-final-eng.pdf
18-04-UA_REPORT_MEDIALITERAСY_INDEX-DM_23-1-final-eng.pdf
 
Accessible design: Minimum effort, maximum impact
Accessible design: Minimum effort, maximum impactAccessible design: Minimum effort, maximum impact
Accessible design: Minimum effort, maximum impact
 
CARE OF CHILD IN INCUBATOR..........pptx
CARE OF CHILD IN INCUBATOR..........pptxCARE OF CHILD IN INCUBATOR..........pptx
CARE OF CHILD IN INCUBATOR..........pptx
 
Advanced Views - Calendar View in Odoo 17
Advanced Views - Calendar View in Odoo 17Advanced Views - Calendar View in Odoo 17
Advanced Views - Calendar View in Odoo 17
 
Paris 2024 Olympic Geographies - an activity
Paris 2024 Olympic Geographies - an activityParis 2024 Olympic Geographies - an activity
Paris 2024 Olympic Geographies - an activity
 
Staff of Color (SOC) Retention Efforts DDSD
Staff of Color (SOC) Retention Efforts DDSDStaff of Color (SOC) Retention Efforts DDSD
Staff of Color (SOC) Retention Efforts DDSD
 
Presentation by Andreas Schleicher Tackling the School Absenteeism Crisis 30 ...
Presentation by Andreas Schleicher Tackling the School Absenteeism Crisis 30 ...Presentation by Andreas Schleicher Tackling the School Absenteeism Crisis 30 ...
Presentation by Andreas Schleicher Tackling the School Absenteeism Crisis 30 ...
 
How to Make a Pirate ship Primary Education.pptx
How to Make a Pirate ship Primary Education.pptxHow to Make a Pirate ship Primary Education.pptx
How to Make a Pirate ship Primary Education.pptx
 
Mattingly "AI & Prompt Design: Structured Data, Assistants, & RAG"
Mattingly "AI & Prompt Design: Structured Data, Assistants, & RAG"Mattingly "AI & Prompt Design: Structured Data, Assistants, & RAG"
Mattingly "AI & Prompt Design: Structured Data, Assistants, & RAG"
 
Z Score,T Score, Percential Rank and Box Plot Graph
Z Score,T Score, Percential Rank and Box Plot GraphZ Score,T Score, Percential Rank and Box Plot Graph
Z Score,T Score, Percential Rank and Box Plot Graph
 
URLs and Routing in the Odoo 17 Website App
URLs and Routing in the Odoo 17 Website AppURLs and Routing in the Odoo 17 Website App
URLs and Routing in the Odoo 17 Website App
 
microwave assisted reaction. General introduction
microwave assisted reaction. General introductionmicrowave assisted reaction. General introduction
microwave assisted reaction. General introduction
 
The Most Excellent Way | 1 Corinthians 13
The Most Excellent Way | 1 Corinthians 13The Most Excellent Way | 1 Corinthians 13
The Most Excellent Way | 1 Corinthians 13
 

Statistics

  • 2. Assumptions : 1. The sample of paired data (x,y) is a random sample. 2. The pairs of (x,y) data are normally distributed.
  • 3.  Measures the degree of linear association between two scaled variables analysis of the relationship between two quantitative outcomes,.
  • 4.  Scatterplot (or scatter diagram) is a graph in which the paired (x,y) sample data are plotted with a horizontal x axis and a vertical y axis. Each individual (x,y) pair is plotted as a single point.
  • 5.  POSITIVE CORRELATION Examples :  Height and weight of a batch of students  Income and expenditure of a family  NEGATIVE CORRELATION Examples :  Price and demand  Volume v and pressure p of a perfect gas
  • 6.
  • 7. Scatter Diagram of Paired Data Restaurant Bill (x) and Tip (y)
  • 8. x x yy y x Sample Scatter Plots showing various degrees of “positive” correlation. That is, when x increases y also increases (a) Positive (b) Strong positive (c) Perfect positive
  • 9. x x yy y x (d) Negative (e) Strong negative (f) Perfect negative Sample Scatter Plots showing various degrees of “negative” correlation. When x increases y decreases
  • 10. x x yy (g) No Correlation (h) Nonlinear Correlation Sample Scatter Plots showing NO linear correlation. The first plot (g) has no correlation of any kind. The other plot (h) shows a clear correlation between x and y, but the correlation is NOT LINEAR. Nonlinear correlation can be studied, but it is beyond this class. We will only study LINEAR CORRELATION.
  • 11.  The correlation coefficient is independent of the change of origin and scale.  The values of the linear correlation coefficient are ALWAYS between -1 and +1.  If the correlation coefficient = 1 then the correlation is perfect and positive.  If the correlation coefficient = -1 then the correlation is perfect and negative.  If the correlation coefficient = 0 then the variables are uncorrelated.  If the variables x and y are uncorrelated then Cov (x,y) = 0.
  • 12. The Linear Correlation Coefficient r, can be written as            2 22 2 n xy x y r n x x n y y           
  • 13.
  • 14.  Correlation coefficient is the geometric mean between the regression coefficients.  If one of the regression coefficient is greater than unity the other is less than unity.  Arithmetic mean of the regression coefficients is greater than or equal to the correlation coefficient.  Regression coefficients are independent of the change of origin but dependent on change of scale.
  • 15. Regression Line Plotted on Scatter Plot The Regression Line is the line of “best fit” through the data points. “Best fit” means the sum of the vertical distances between each data point and the regression line is minimized.
  • 16.  x is the independent variable (predictor variable)  y-hat is the dependent variable (response variable) 0 1 ˆy b b x  b0 is the y- intercept or the value at which the regression line crosses the vertical axis b1 is the slope of the regression line or the amount of change in y for every 1 unit change in x y-hat is the “dependent” or “response” variable because it depends on, or responds to the value of x x is the “independent” or “predictor” variable because it acts independently to predict the value of y- hat