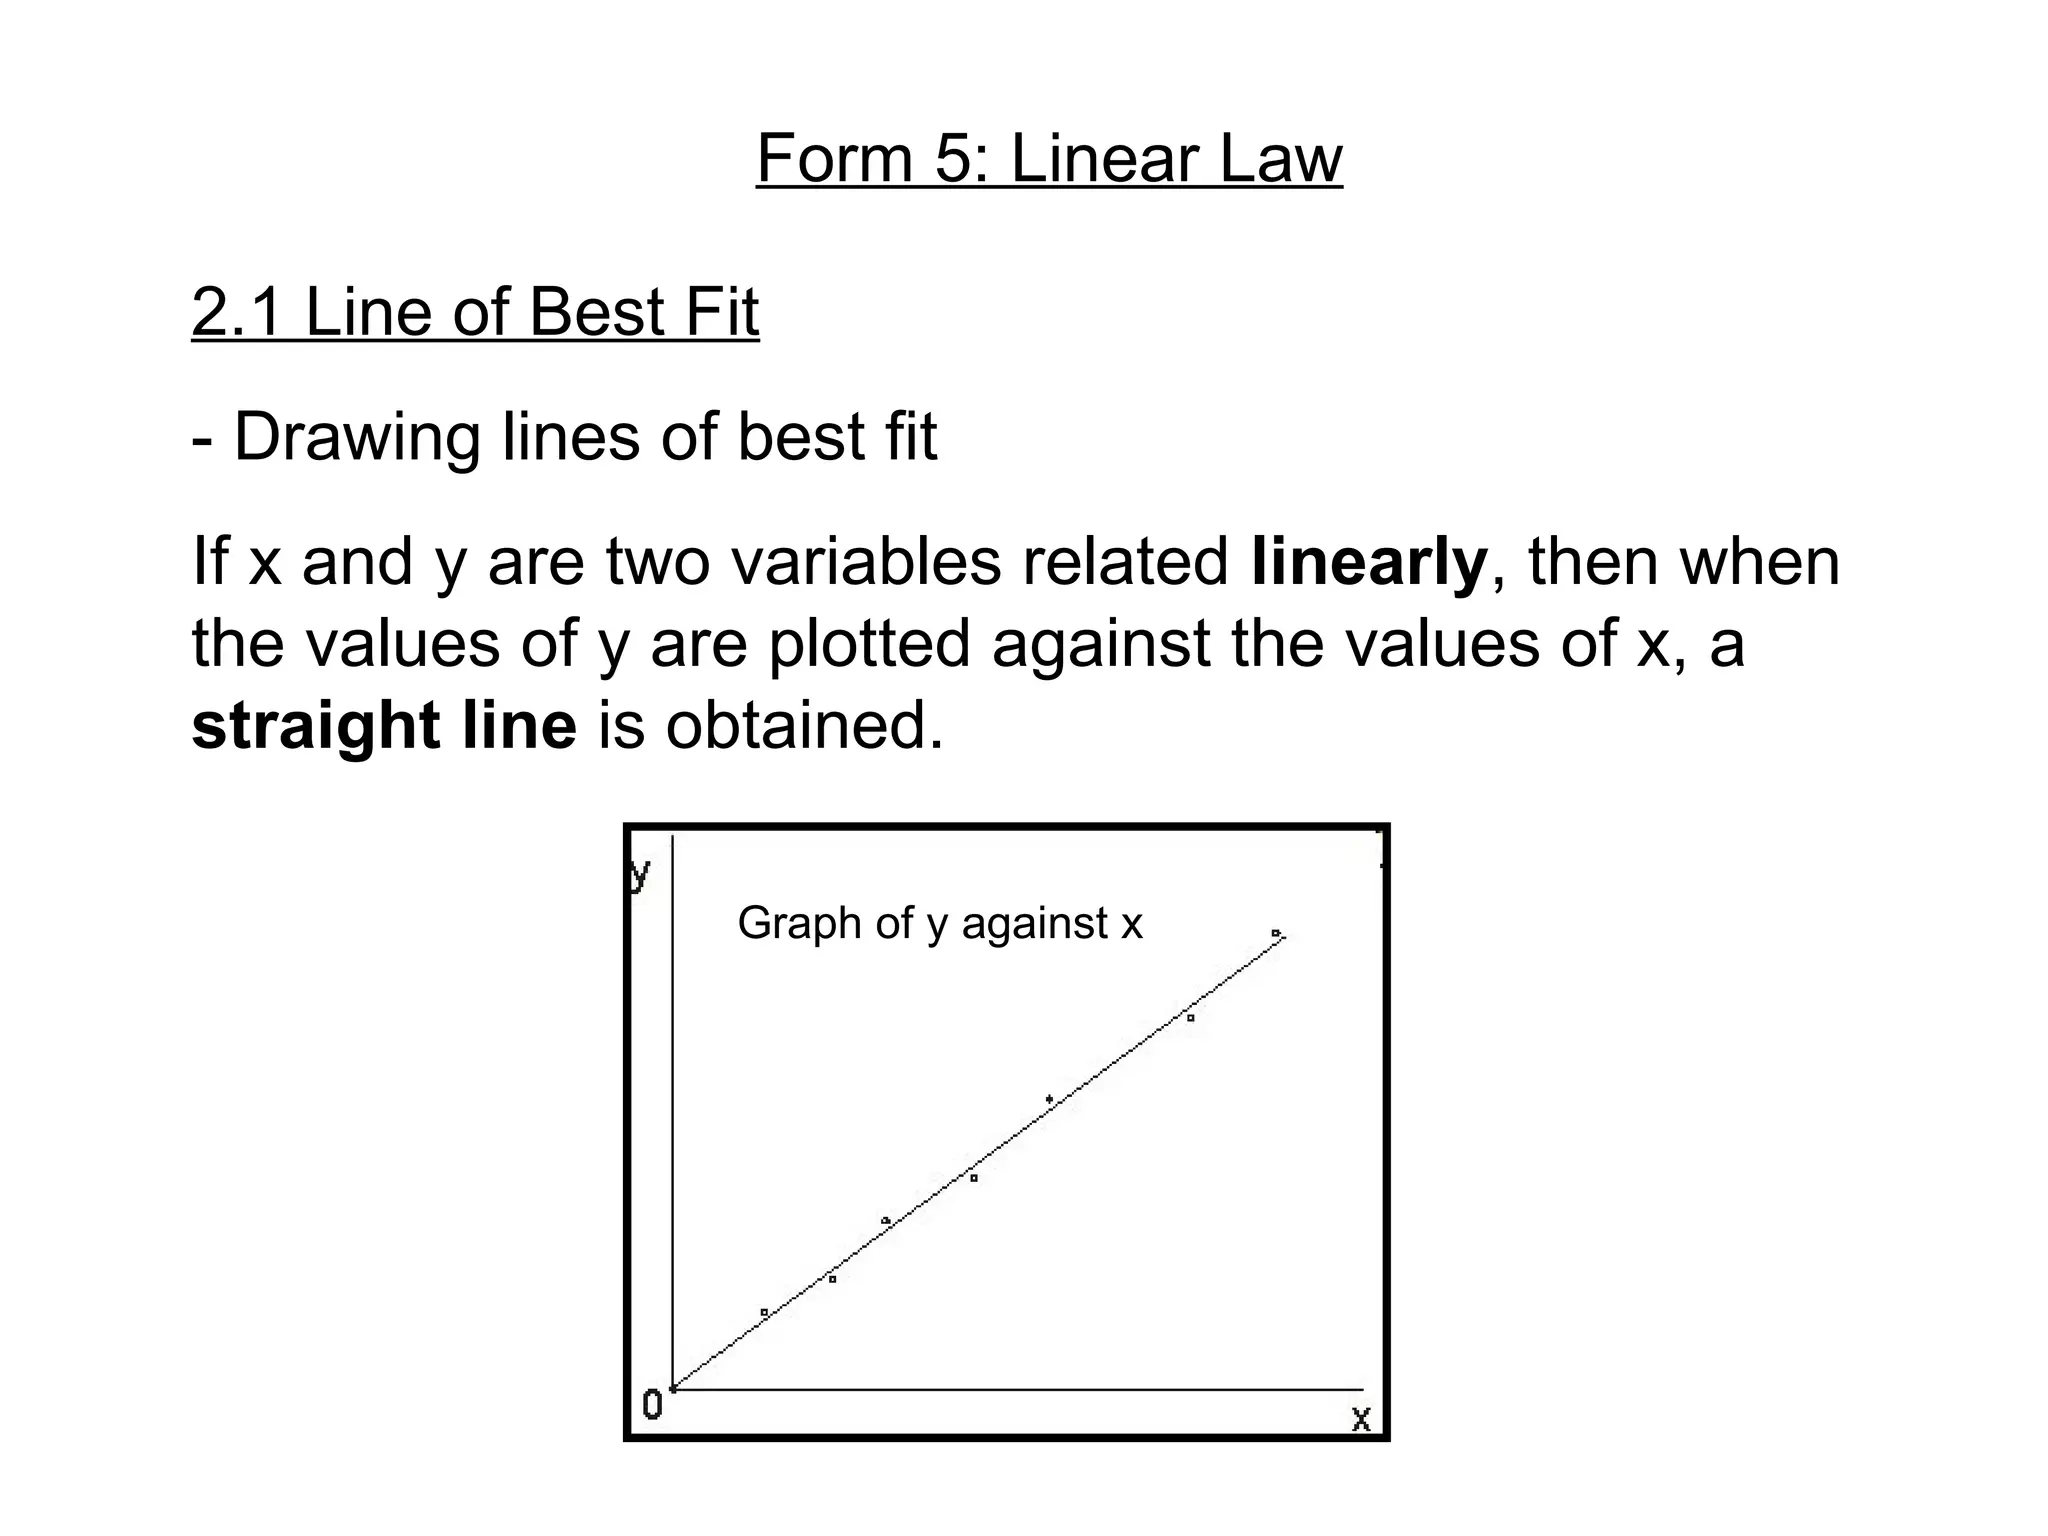
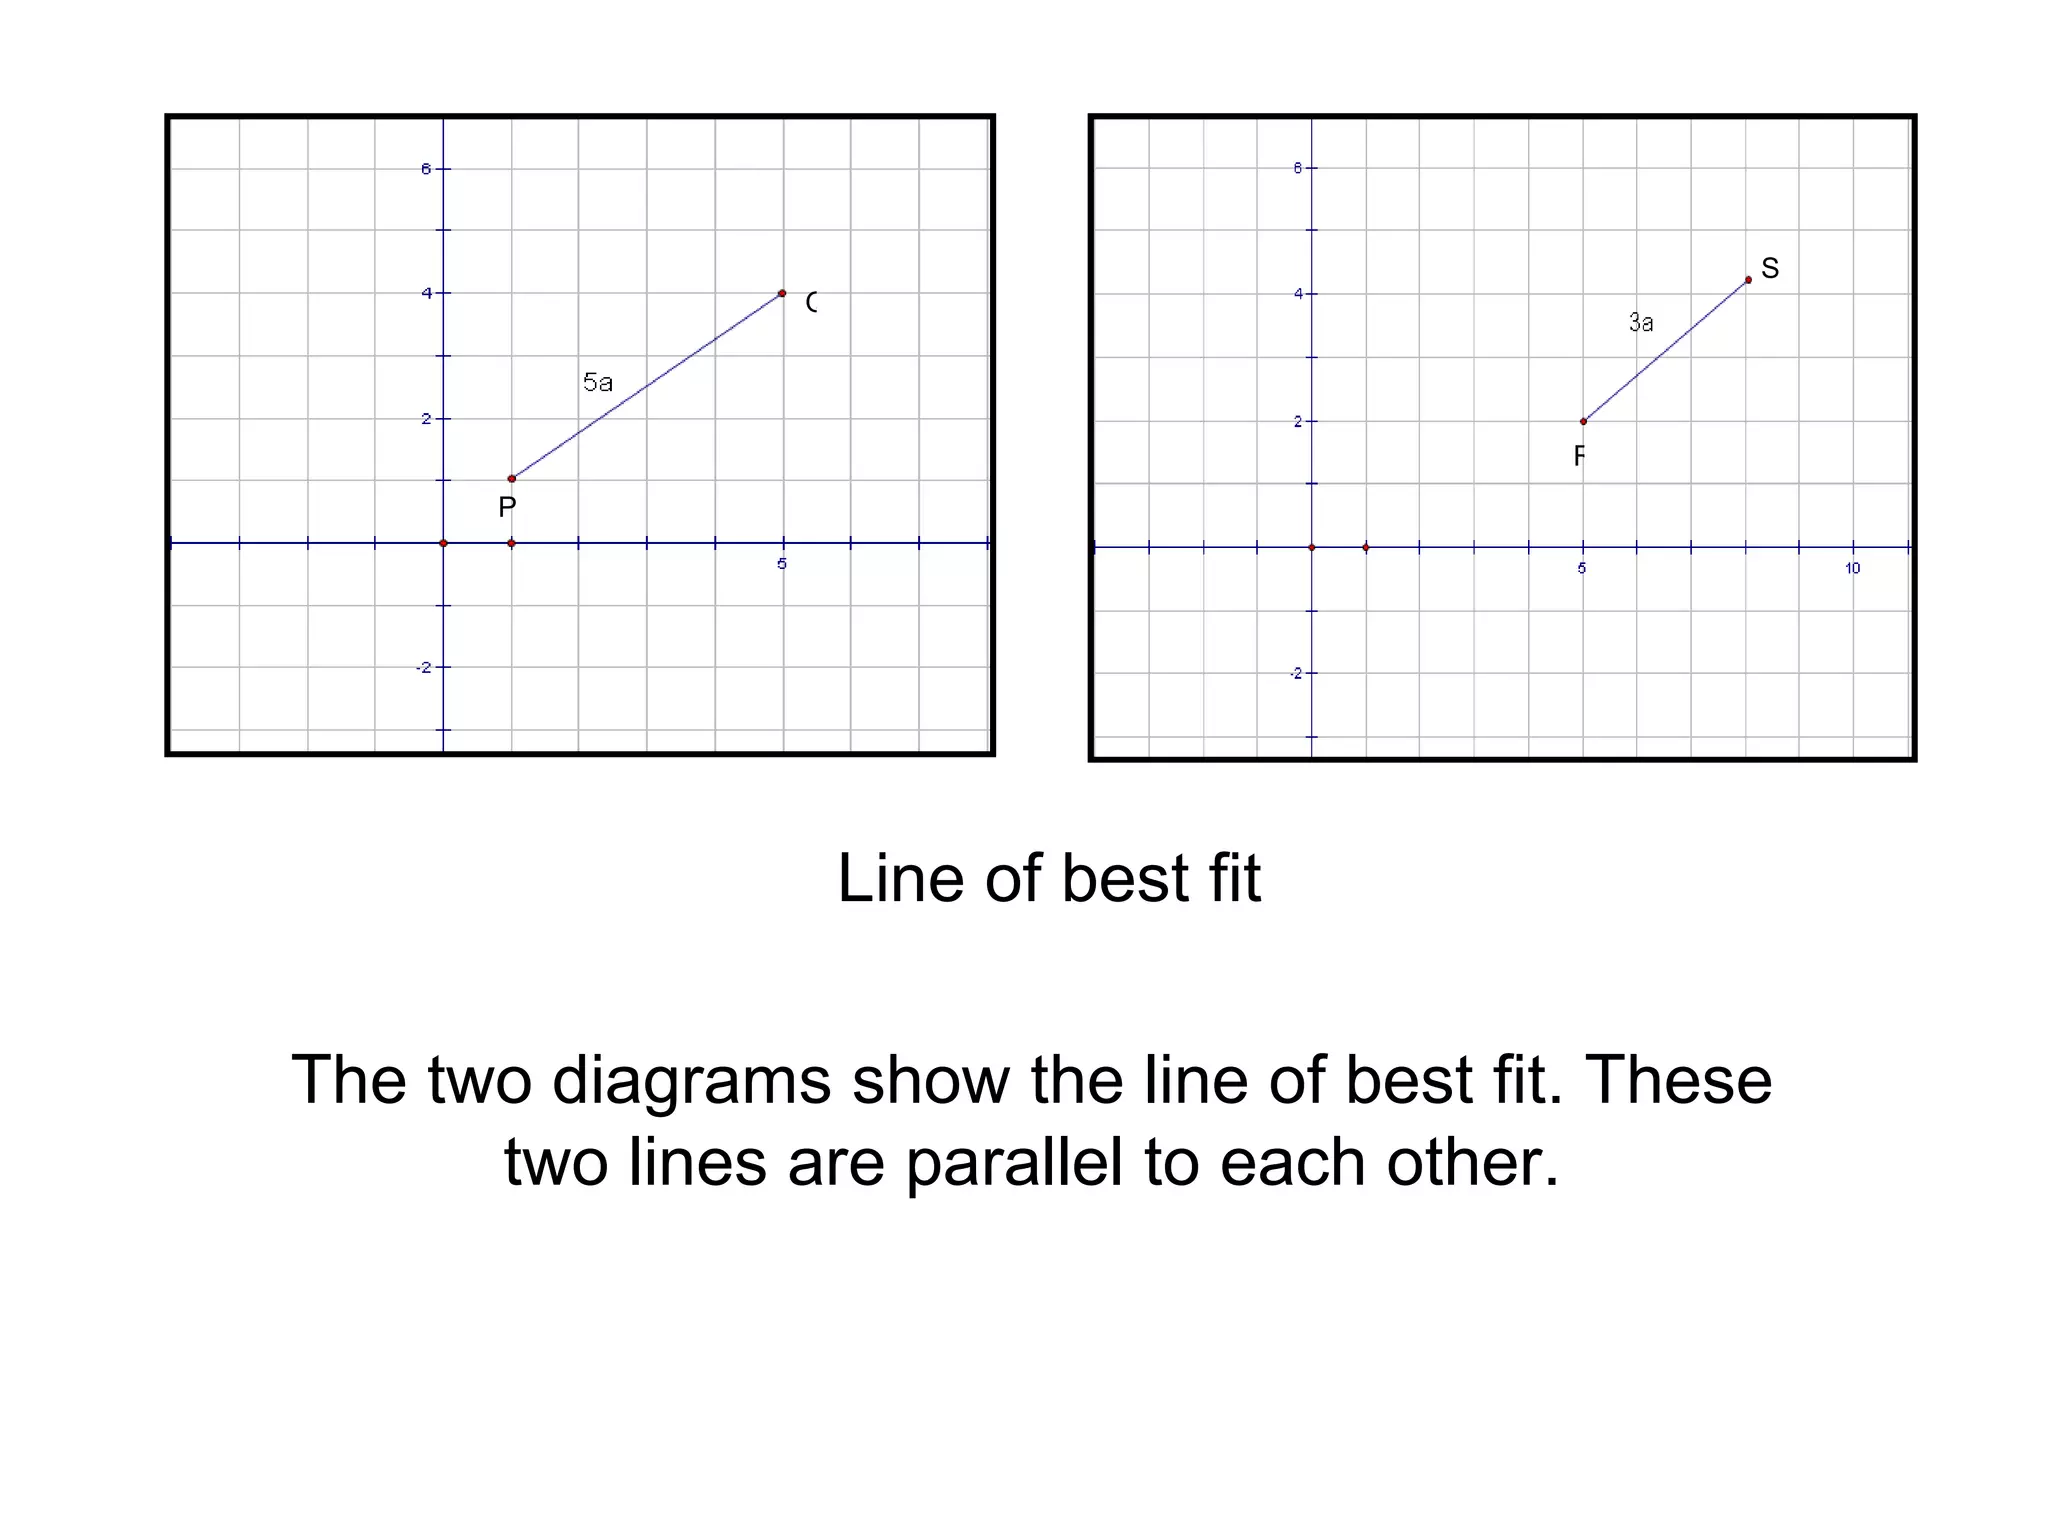
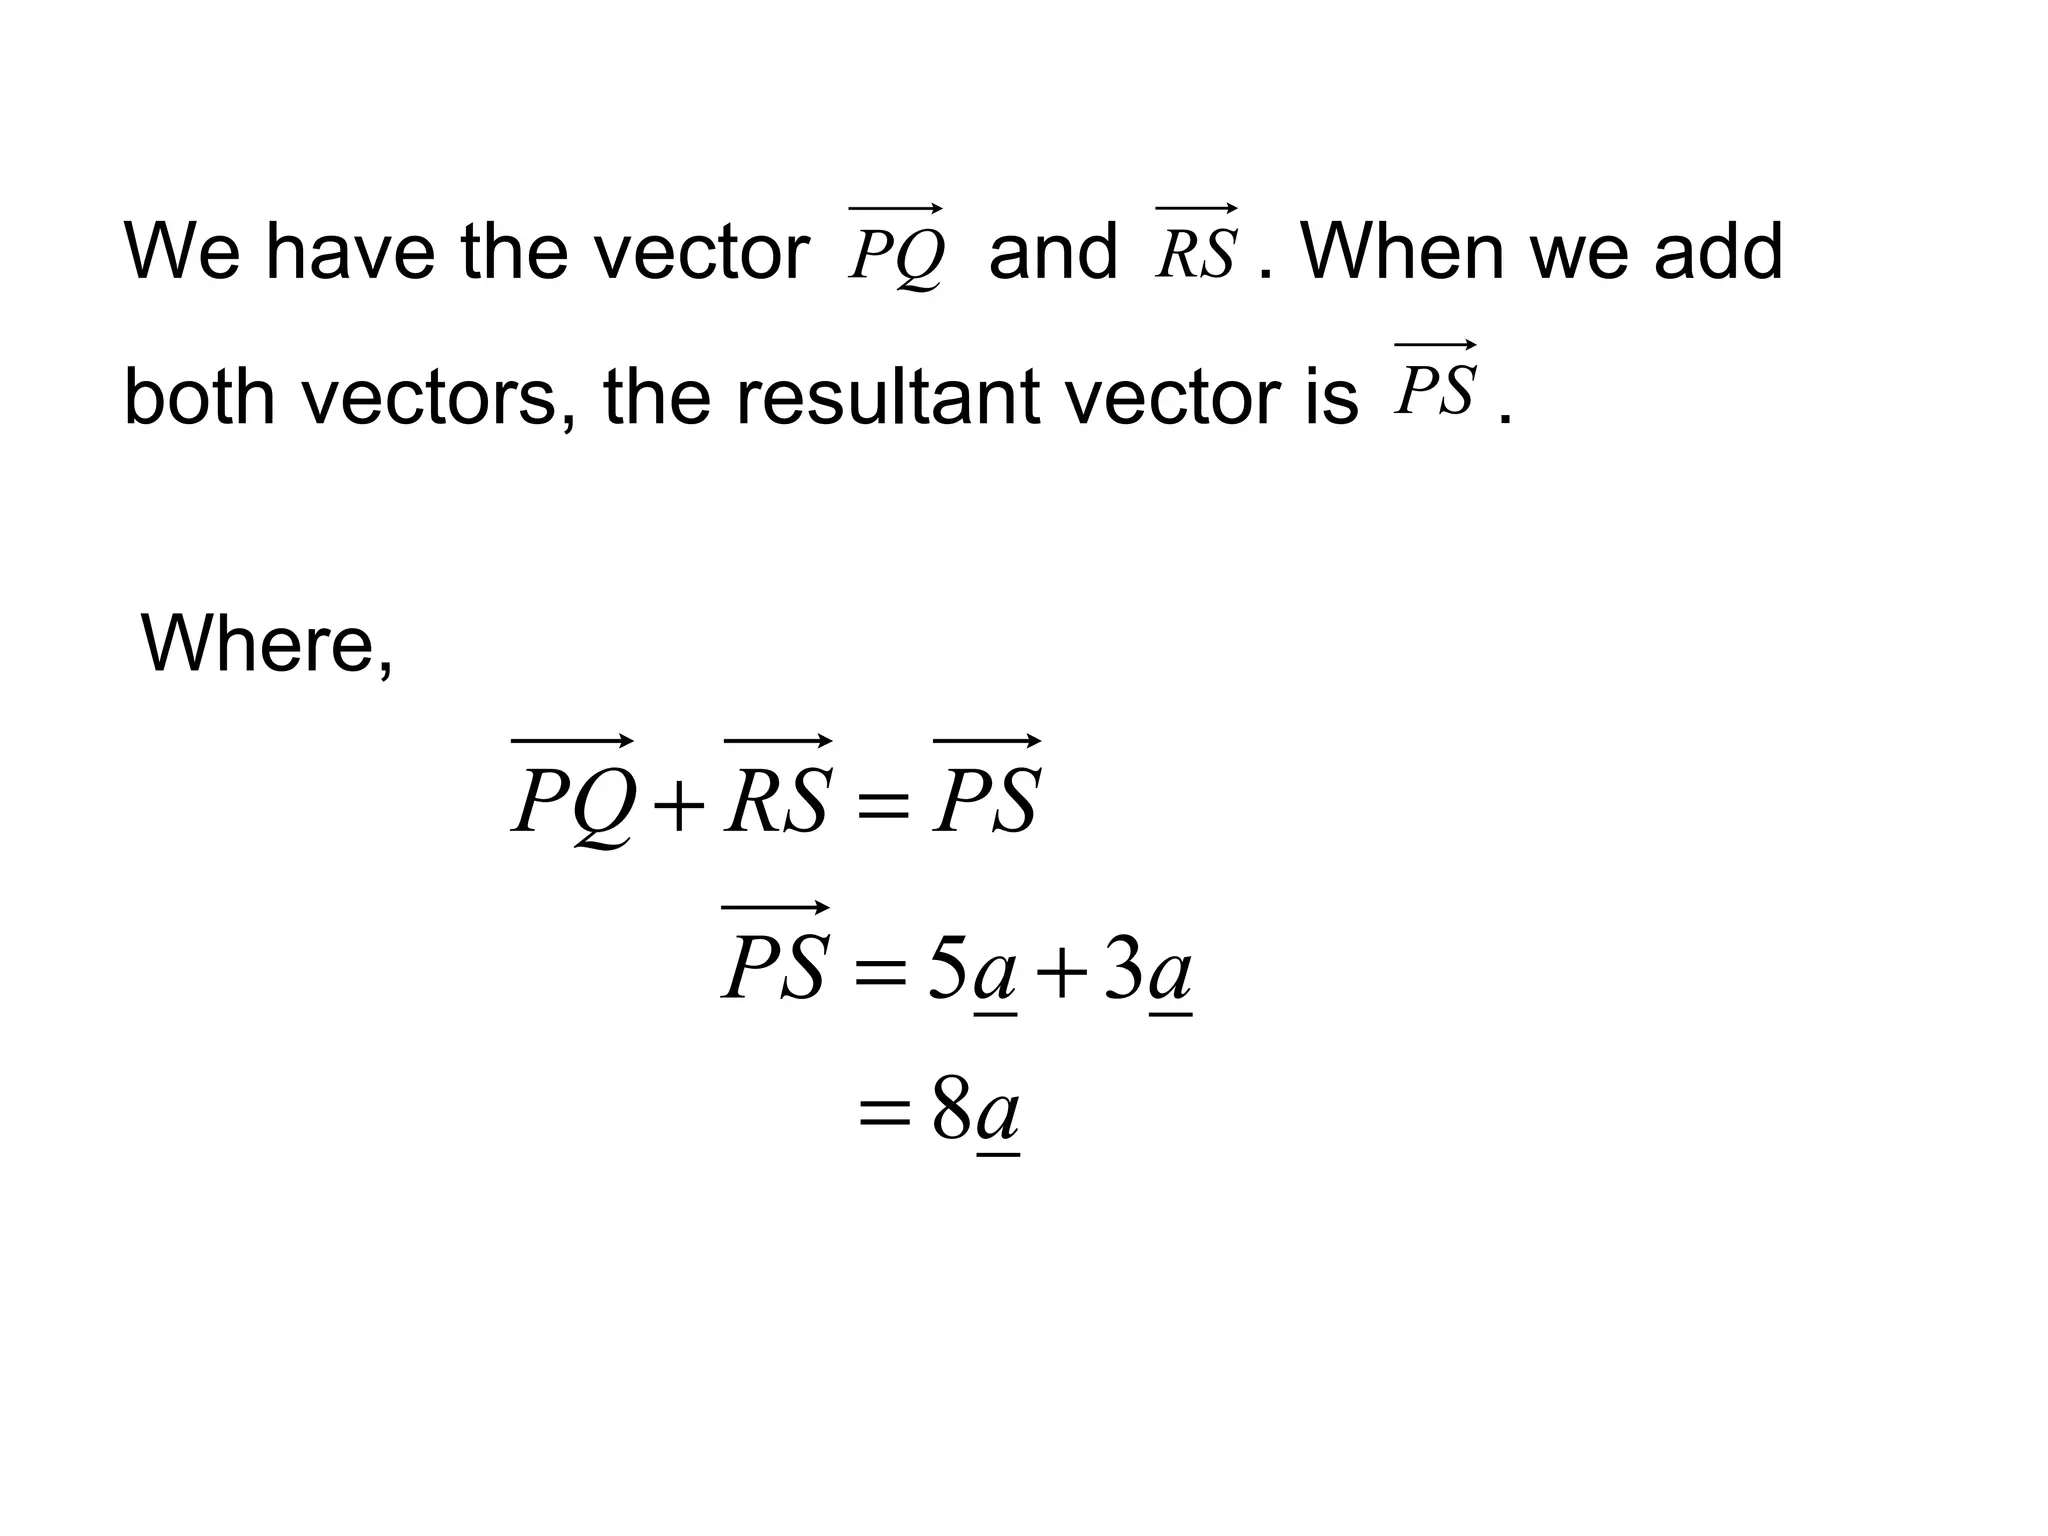
Methods of Solving Quadratic EquationsMaria Wilson
The quadratic equation is about the polynomial equation in the single variable where the highest exponent of a variable is only 2. If you want to know solving quadratic equations, you will have three main ways to solve the quadratic equation.
Parallel Lines & the Triangle Angle-Sum Theoremrenfoshee
This lesson reviews the concepts of parallel lines and the Triangle Angle-Sum Theorem. I deliver this presentation using a tablet laptop in which I am able to write on the screen using a stylus pen. By working out the solutions with the students, it becomes interactive and engaging.
matrices
The beginnings of matrices goes back to the second century BC although traces can be seen back to the fourth century BC. However it was not until near the end of the 17th Century that the ideas reappeared and development really got underway.
It is not surprising that the beginnings of matrices and determinants should arise through the study of systems of linear equations. The Babylonians studied problems which lead to simultaneous linear equations and some of these are preserved in clay tablets which survive.
This presentation educates you about R - Vectors, Steps to Establish a Regression, lm() Function and predict() Function.
For more topics stay tuned with Learnbay
data science....................................................................................................................................................................................................................................................................................................................................................................................................................................................................................................................................................................................................................................................................................................................................................................................................................................................................................................................................................................................................................................................................................................................................................................................................................................................................................................................................................................................................................................................................................................................................................................................................................................................................................................................................................................................................................................................................................................................................................................................................................................................................................................................................................................................................................................................................................................................................................................................................................................................................................................................................................................................................................................................................................................................................................................................................................................................................................................................................................................................................................................................................................................
Illustrate the nature of bivariate data;
Construct a scatter plot;
Describe shapes (form), trend (direction), and variation (strength) based on the scatter plot; and
Estimate strength of association between the variables based on a scatter plot.
Visit the website for other Services: https://cristinamontenegro92.wixsite.com/onevs
1. Form 5: Linear Law 2.1 Line of Best Fit - Drawing lines of best fit If x and y are two variables related linearly , then when the values of y are plotted against the values of x, a straight line is obtained. Graph of y against x
2. How is it related to the topic vector in the subtopic of addition and subtraction? Look at the next slide so that you can see the connection.
3. Connection When we have two lines of best fit, we can add or subtract the lines. If the lines are linear, they can be added or subtracted whether they are parallel or non-parallel to each other.
4. Line of best fit The two diagrams show the line of best fit. These two lines are parallel to each other. P Q R S
5. We have the vector and . When we add both vectors, the resultant vector is . Where,