![Disaster Index (DI) The weight for each indicators: Average magnitude of earthquake (0.3); Number of deaths and missings, percentage of deaths and missings(0.3, 0.15 for each); Number of collapsed houses per 10,000 persons (0.2, 0.1 for each); Risk of geological disaster: impacted residents (0.1); Percentage of people relocated(0.1). DI=∑(fk* DIk) DIk is the normalized indicator value : DIk = [DIk –min(DIk)]/ [max(DIk)-min(DIk)] ; fk is the weight for each indicator](https://image.slidesharecdn.com/20100603-davos-2010ppt1012/85/Integrated-Risks-Transfer-Mode-of-Large-Scale-Disasters-in-China-and-World-23-320.jpg)
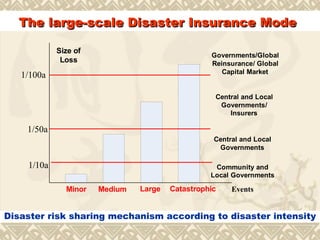
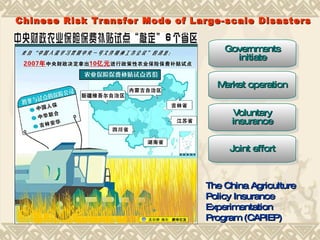
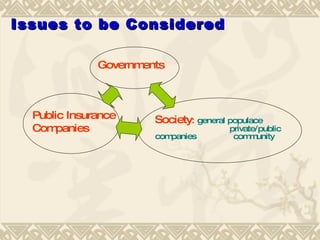


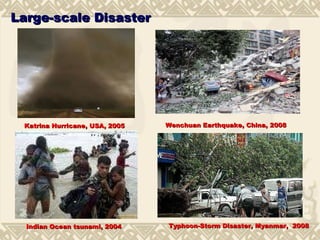
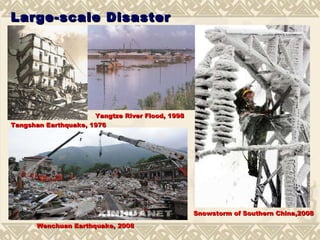
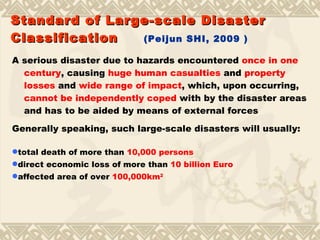
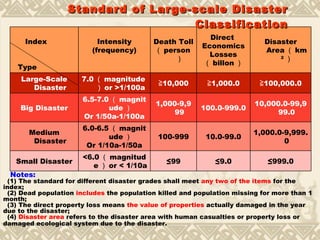
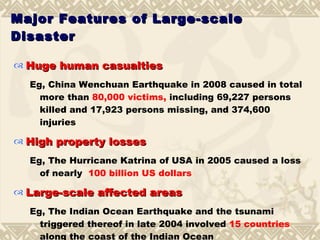
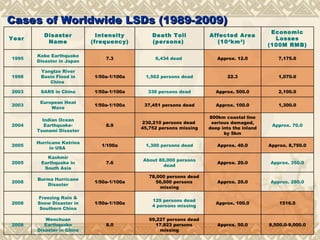
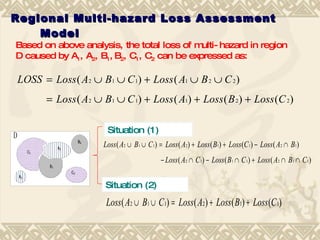
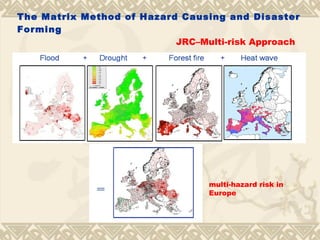
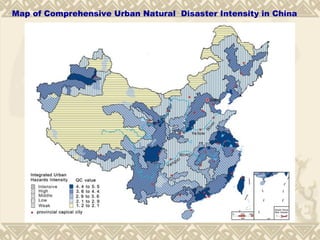
The document discusses large scale disasters, their risk assessment, and integrated risk transfer modes in China and worldwide. It defines large scale disasters as events causing over 10,000 deaths or $1 billion in damages that affect over 100,000 square kilometers. Risk is assessed using models accounting for multiple hazards and disaster chains. China's risk transfer mode involves government support, insurance company operation, and stakeholder sharing of risk according to disaster intensity. Similar programs worldwide insure risks from earthquakes, floods, and other catastrophes.


![5G Explained! A High Level Overview [Introduction]](https://cdn.slidesharecdn.com/ss_thumbnails/5gexplainedahighleveloverview-260119165306-cc137a3e-thumbnail.jpg?width=640&height=640&fit=bounds)


