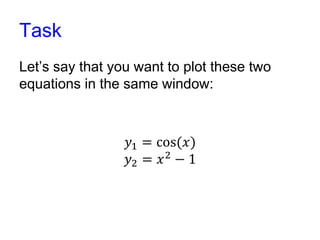
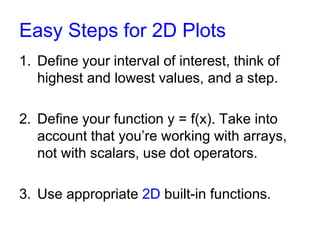
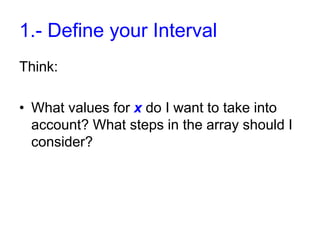
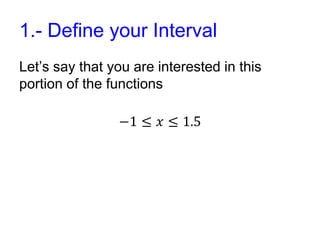
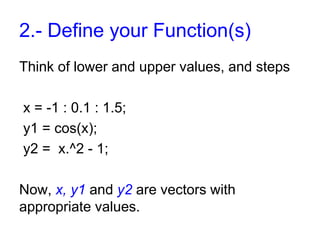
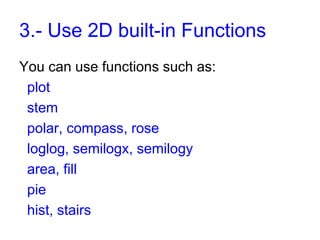
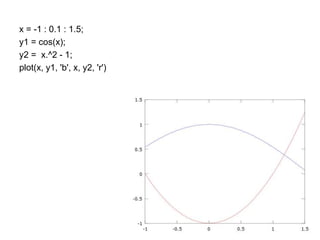
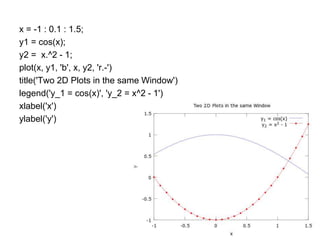
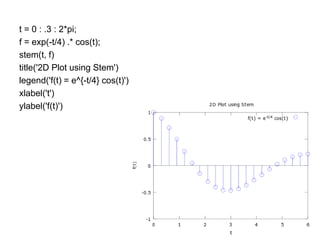
2D Plots
In Matlab
Task
Let’s say that you want to plot these two
equations in the same window:
𝑦1 = cos(𝑥)
𝑦2 = 𝑥2
− 1
Easy Steps for 2D Plots
1. Define your interval of interest, think of
highest and lowest values, and a step.
2. Define your function y = f(x). Take into
account that you’re working with arrays,
not with scalars, use dot operators.
3. Use appropriate 2D built-in functions.
1.- Define your Interval
Think:
• What values for x do I want to take into
account? What steps in the array should I
consider?
1.- Define your Interval
Let’s say that you are interested in this
portion of the functions
−1 ≤ 𝑥 ≤ 1.5
2.- Define your Function(s)
Think of lower and upper values, and steps
x = -1 : 0.1 : 1.5;
y1 = cos(x);
y2 = x.^2 - 1;
Now, x, y1 and y2 are vectors with
appropriate values.
3.- Use 2D built-in Functions
You can use functions such as:
plot
stem
polar, compass, rose
loglog, semilogx, semilogy
area, fill
pie
hist, stairs
x = -1 : 0.1 : 1.5;
y1 = cos(x);
y2 = x.^2 - 1;
plot(x, y1, 'b', x, y2, 'r')
x = -1 : 0.1 : 1.5;
y1 = cos(x);
y2 = x.^2 - 1;
plot(x, y1, 'b', x, y2, 'r.-')
title('Two 2D Plots in the same Window')
legend('y_1 = cos(x)', 'y_2 = x^2 - 1')
xlabel('x')
ylabel('y')
t = 0 : .3 : 2*pi;
f = exp(-t/4) .* cos(t);
stem(t, f)
title('2D Plot using Stem')
legend('f(t) = e^{-t/4} cos(t)')
xlabel('t')
ylabel('f(t)')
2D Plots in Matlab
For more examples and details, visit:
matrixlab-examples.com/matlab-plot-2tier.html

2D Plot Matlab

  • 1.
  • 2.
    Task Let’s say thatyou want to plot these two equations in the same window: 𝑦1 = cos(𝑥) 𝑦2 = 𝑥2 − 1
  • 3.
    Easy Steps for2D Plots 1. Define your interval of interest, think of highest and lowest values, and a step. 2. Define your function y = f(x). Take into account that you’re working with arrays, not with scalars, use dot operators. 3. Use appropriate 2D built-in functions.
  • 4.
    1.- Define yourInterval Think: • What values for x do I want to take into account? What steps in the array should I consider?
  • 5.
    1.- Define yourInterval Let’s say that you are interested in this portion of the functions −1 ≤ 𝑥 ≤ 1.5
  • 6.
    2.- Define yourFunction(s) Think of lower and upper values, and steps x = -1 : 0.1 : 1.5; y1 = cos(x); y2 = x.^2 - 1; Now, x, y1 and y2 are vectors with appropriate values.
  • 7.
    3.- Use 2Dbuilt-in Functions You can use functions such as: plot stem polar, compass, rose loglog, semilogx, semilogy area, fill pie hist, stairs
  • 8.
    x = -1: 0.1 : 1.5; y1 = cos(x); y2 = x.^2 - 1; plot(x, y1, 'b', x, y2, 'r')
  • 9.
    x = -1: 0.1 : 1.5; y1 = cos(x); y2 = x.^2 - 1; plot(x, y1, 'b', x, y2, 'r.-') title('Two 2D Plots in the same Window') legend('y_1 = cos(x)', 'y_2 = x^2 - 1') xlabel('x') ylabel('y')
  • 10.
    t = 0: .3 : 2*pi; f = exp(-t/4) .* cos(t); stem(t, f) title('2D Plot using Stem') legend('f(t) = e^{-t/4} cos(t)') xlabel('t') ylabel('f(t)')
  • 11.
    2D Plots inMatlab For more examples and details, visit: matrixlab-examples.com/matlab-plot-2tier.html