Downloaded 55 times
![Piecewise Functions
First important concept: special indices
In Matlab, if we have vector x = [-2 -1 0 1 2 3 4 5 6 7 8 9], and do this:
i2 = x(0 < x & x <= 3)
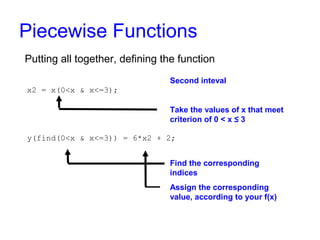
we’ll take all the values in vector x that meet the condition 0 < x ≤ 3, that is,
i2 = [1 2 3]
If we do:
i3 = x(3 < x & x <= 8)
we’ll take all the values in vector x that meet the condition 3 < x ≤ 8, thus
i3 = [4 5 6 7 8]](https://image.slidesharecdn.com/piecewise-141004022245-conversion-gate01/85/Piecewise-Functions-in-Matlab-8-320.jpg)
![Piecewise Functions
Second important concept: function find
In Matlab, if we have vector x = [-2 -1 0 1 2 3 4 5 6 7 8 9], and do this:
find(0 < x & x <= 3)
we’ll find the indices (not values) in vector x that meet 0 < x ≤ 3, so we’ll get
the vector [4 5 6].
If we do:
find(3 < x & x <= 8)
we’ll get the vector [7 8 9 10 11]](https://image.slidesharecdn.com/piecewise-141004022245-conversion-gate01/85/Piecewise-Functions-in-Matlab-9-320.jpg)

![Piecewise Functions
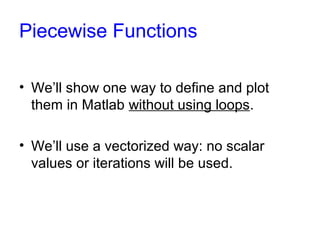
Now, if we type this code…
clc, clear all, close all
x = -2 : .01 : 9;
y = piecewise(x);
plot(x, y)
axis([-2 9 -10 25])
grid on
We get this plot…](https://image.slidesharecdn.com/piecewise-141004022245-conversion-gate01/85/Piecewise-Functions-in-Matlab-15-320.jpg)

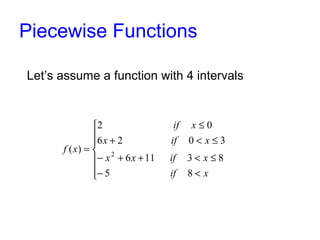
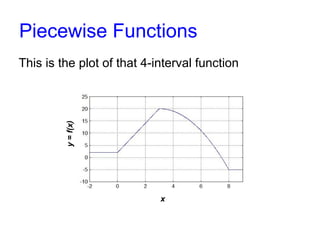
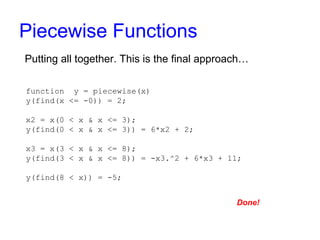
This document discusses how to define and plot piecewise functions in Matlab without using loops. It explains that a piecewise function is made up of multiple subfunctions, each applying to an interval of the main function's domain. It provides an example of a 4-interval piecewise function and shows how to define it in Matlab using specially selected indices and the "find" function to assign values based on the interval. Defining the piecewise function this way allows it to be plotted vectorized, without scalar values or iterations.


